Results for
Diagramming
372 templates
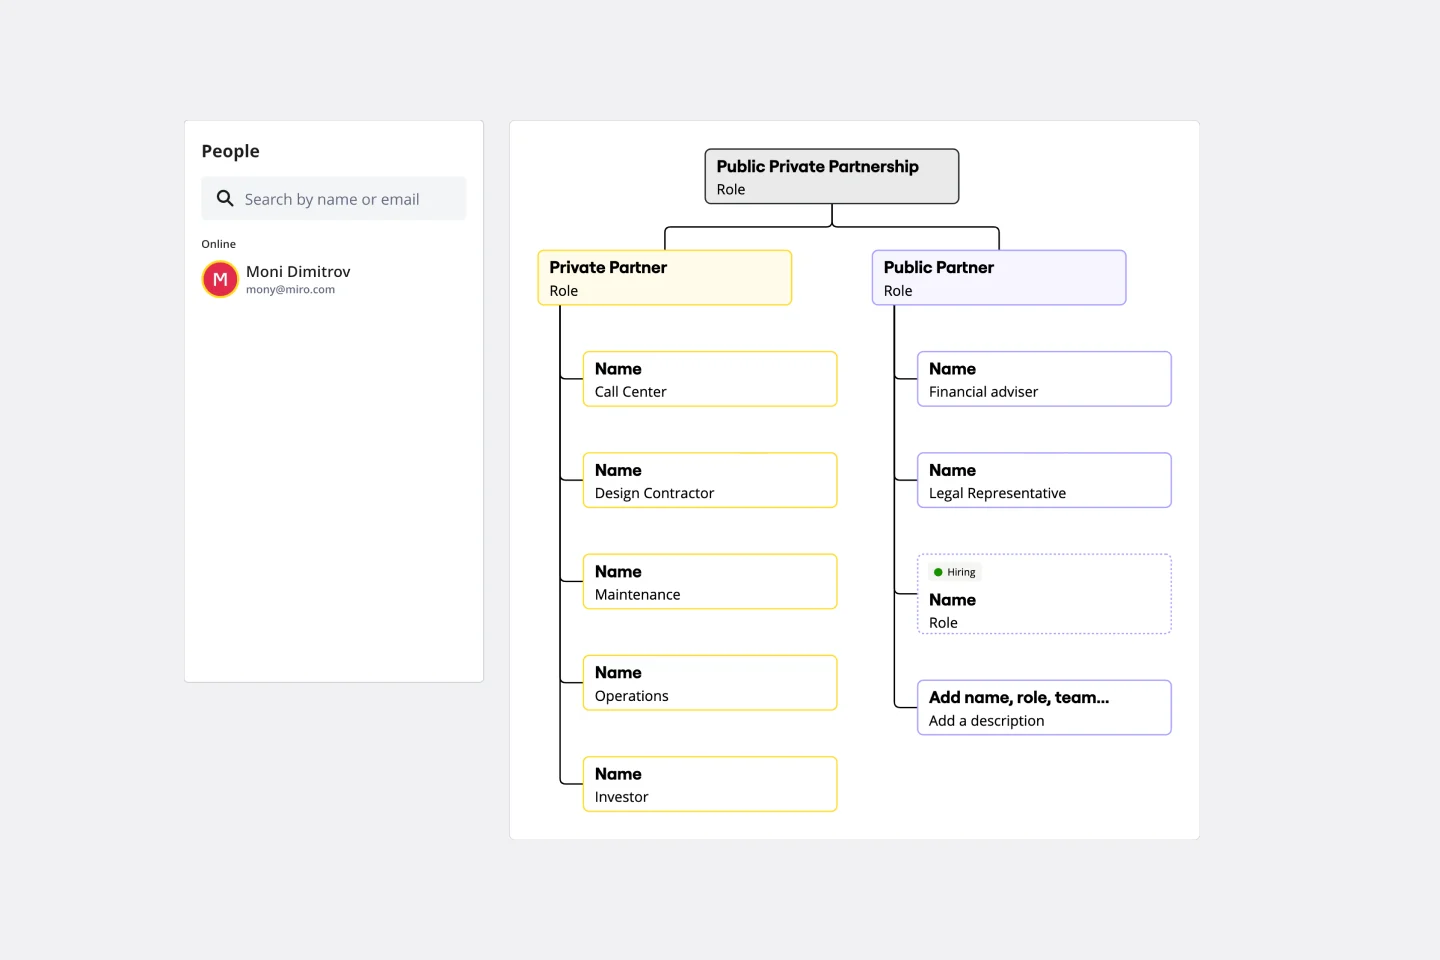
Partnership Org Chart Template
0likes
2uses
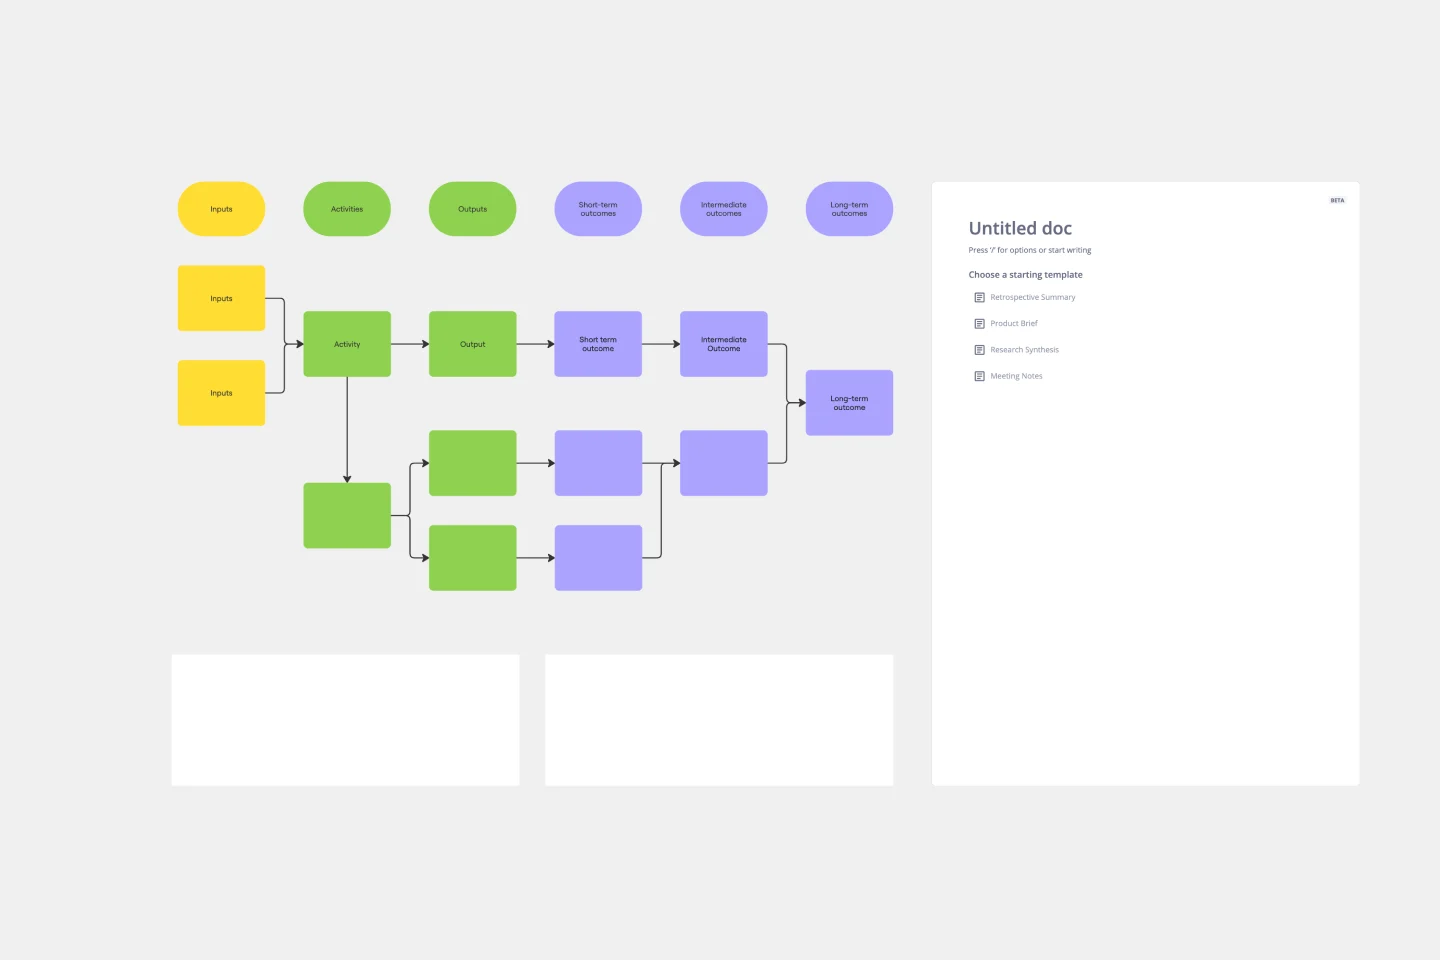
Logic Model Template
0likes
16uses
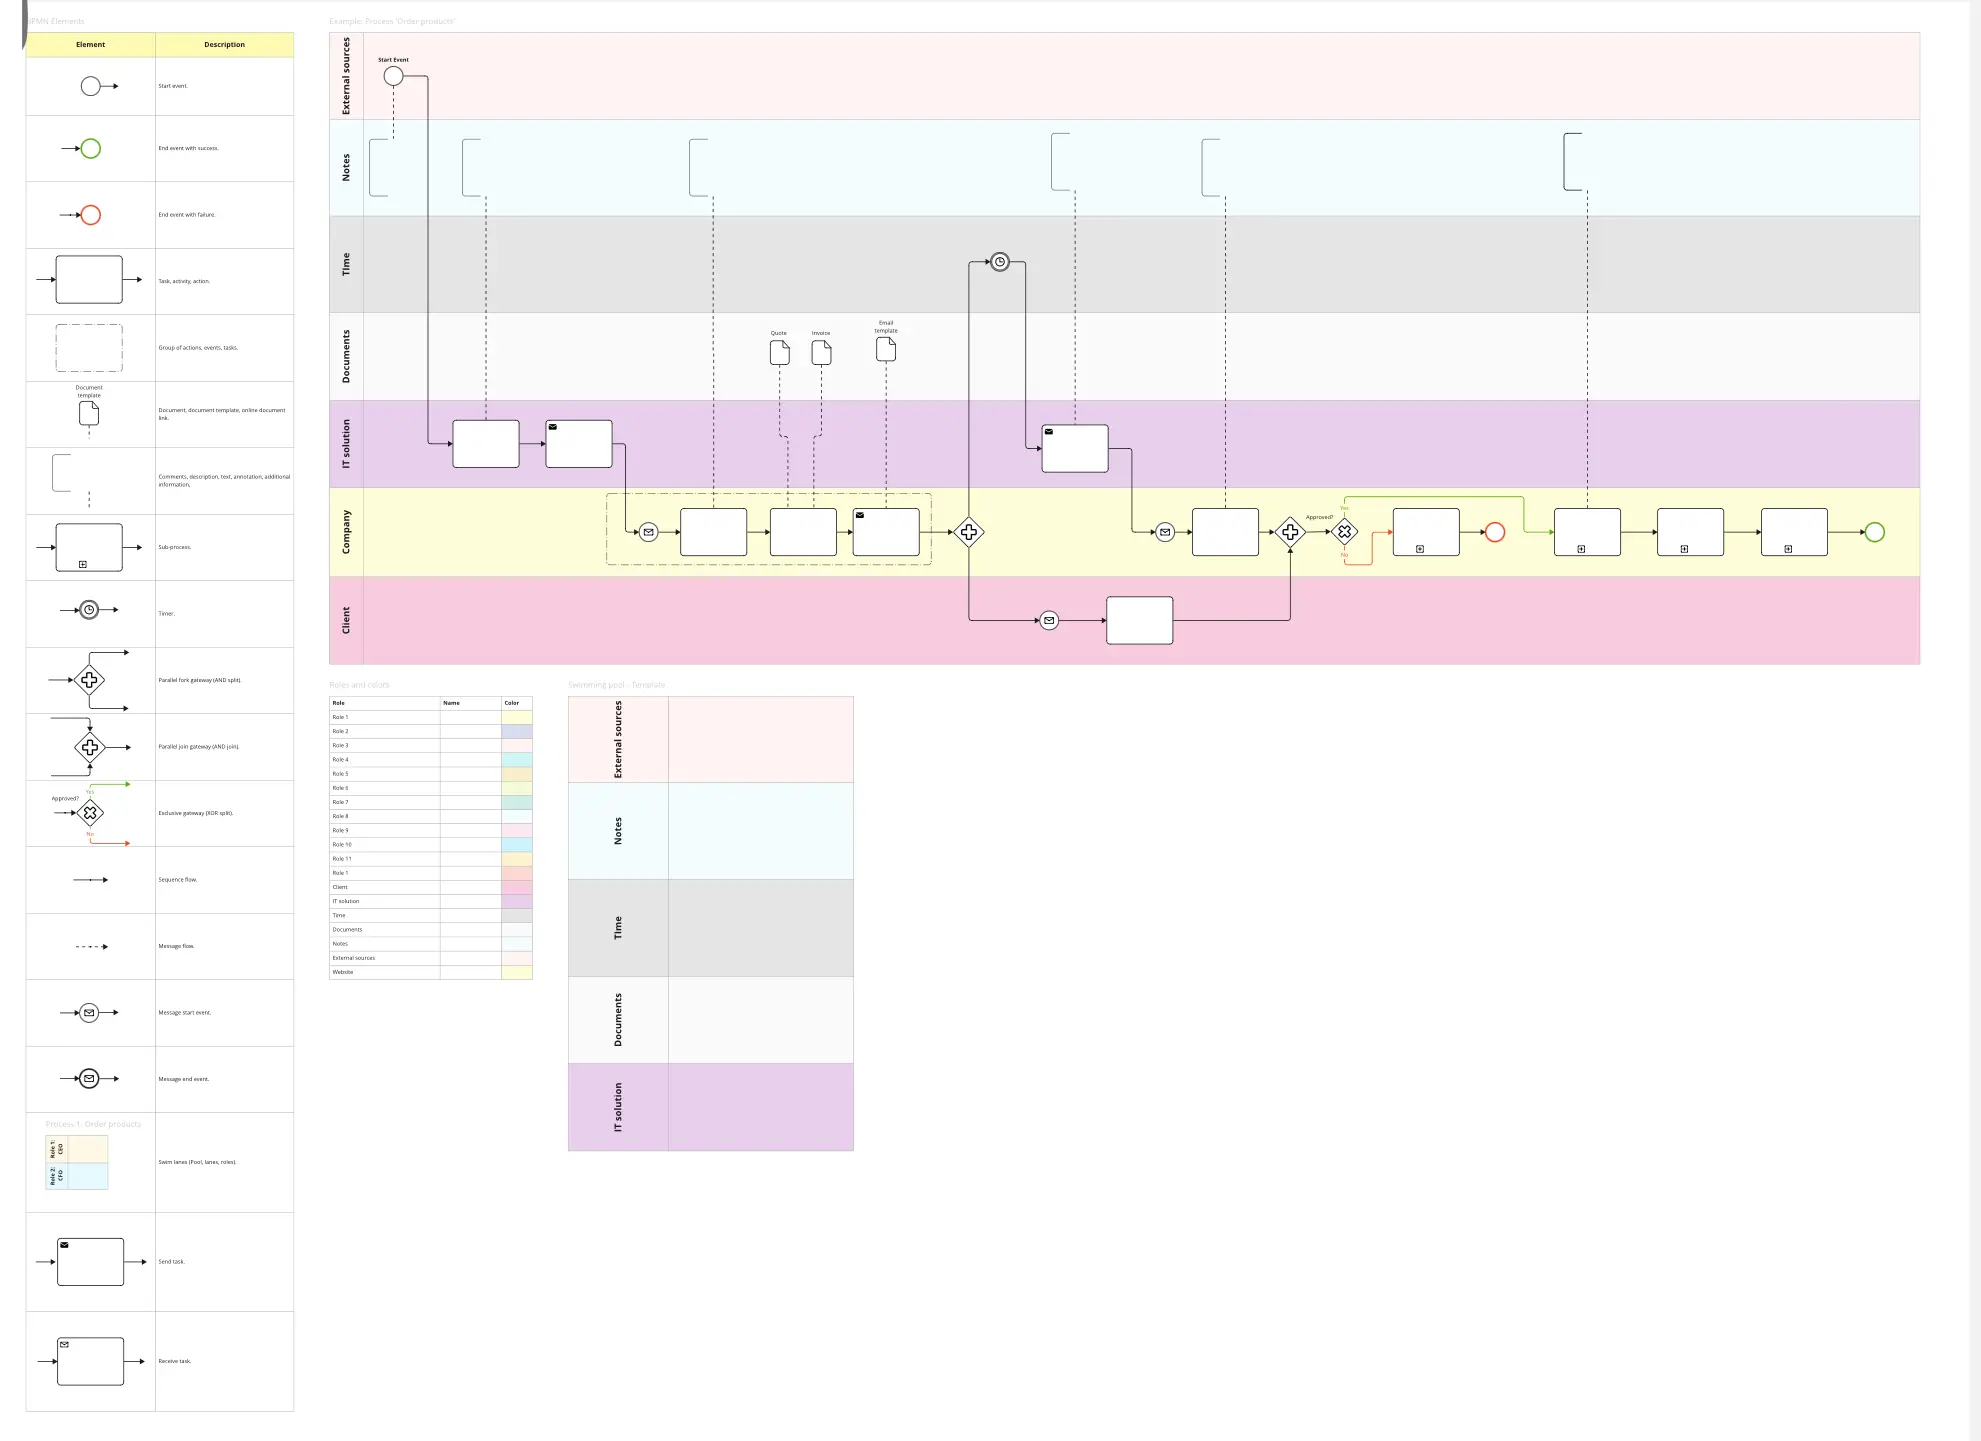
BPMN Template
60likes
762uses
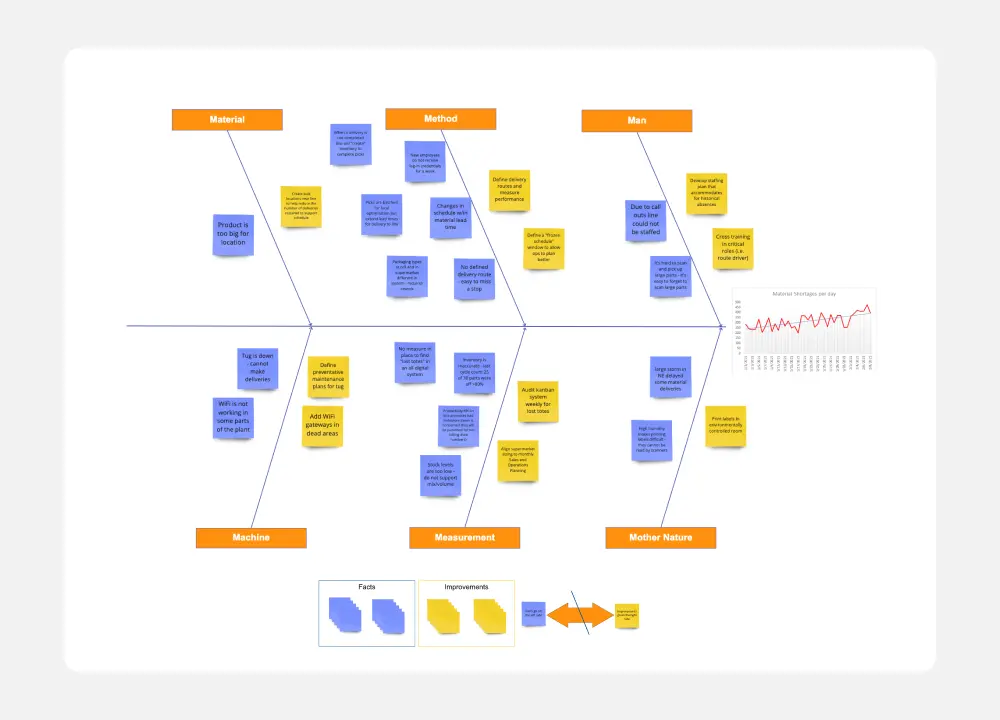
Crowd Sourced Cause and Effect
58likes
1.5Kuses
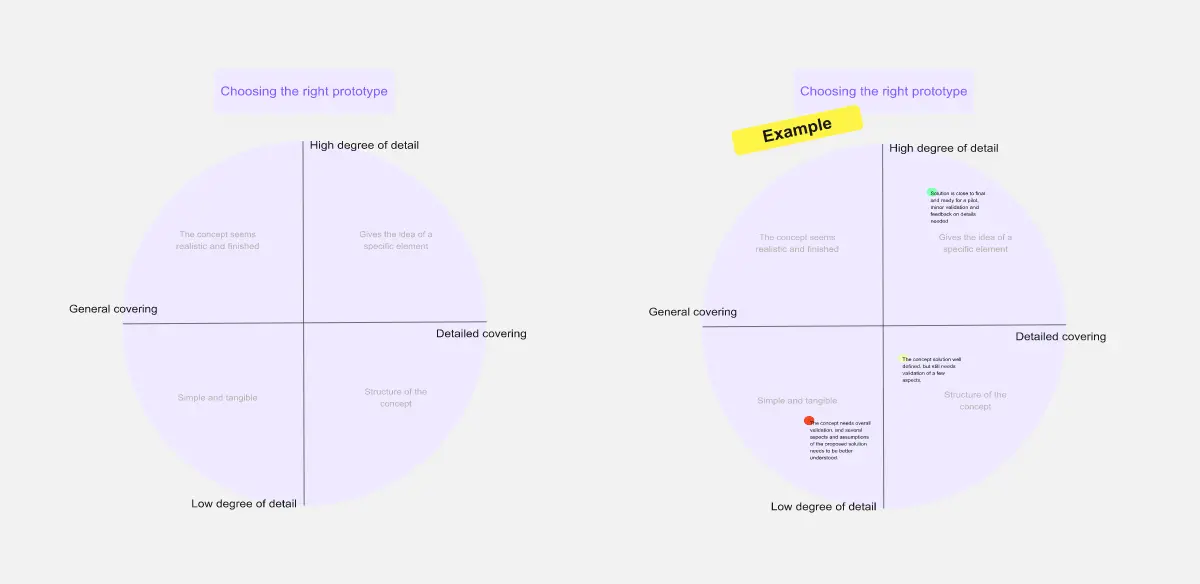
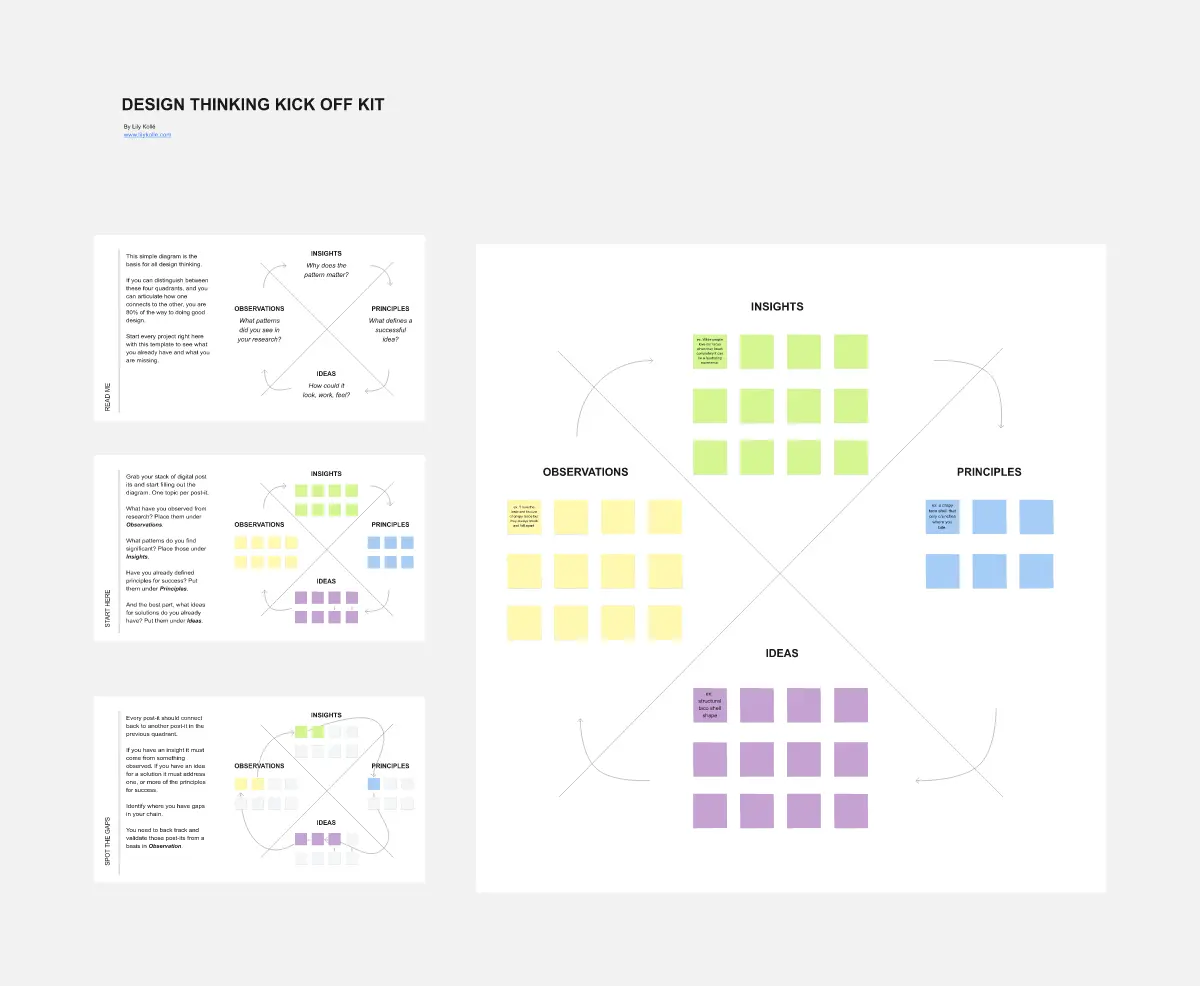
Design Thinking Kick-off Kit
24likes
46uses
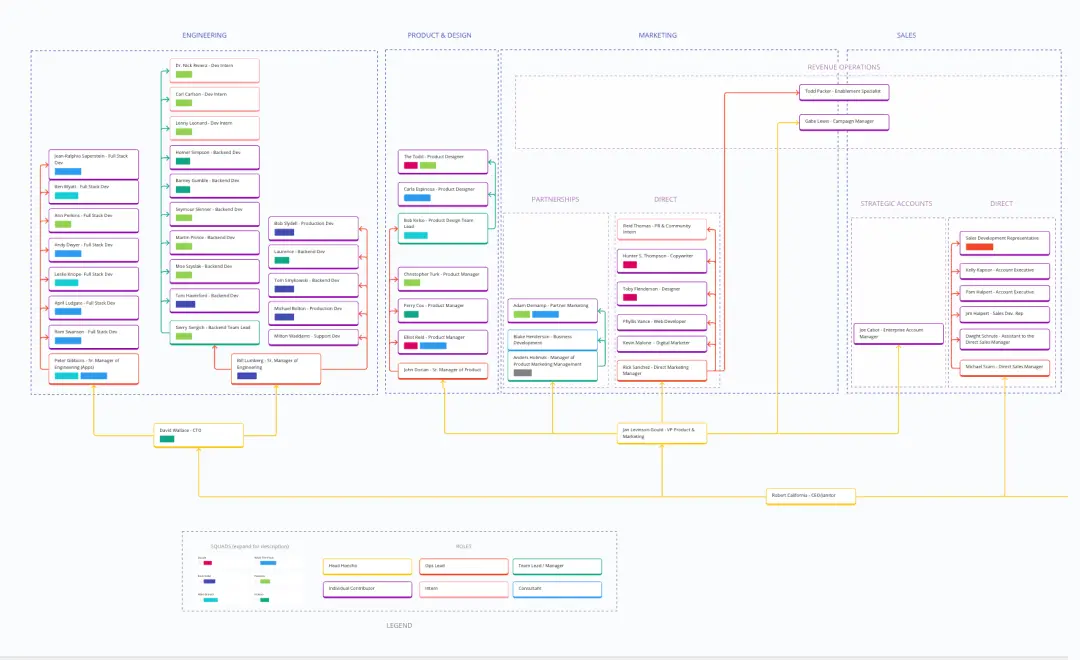
Company Organization Chart
435likes
4.2Kuses
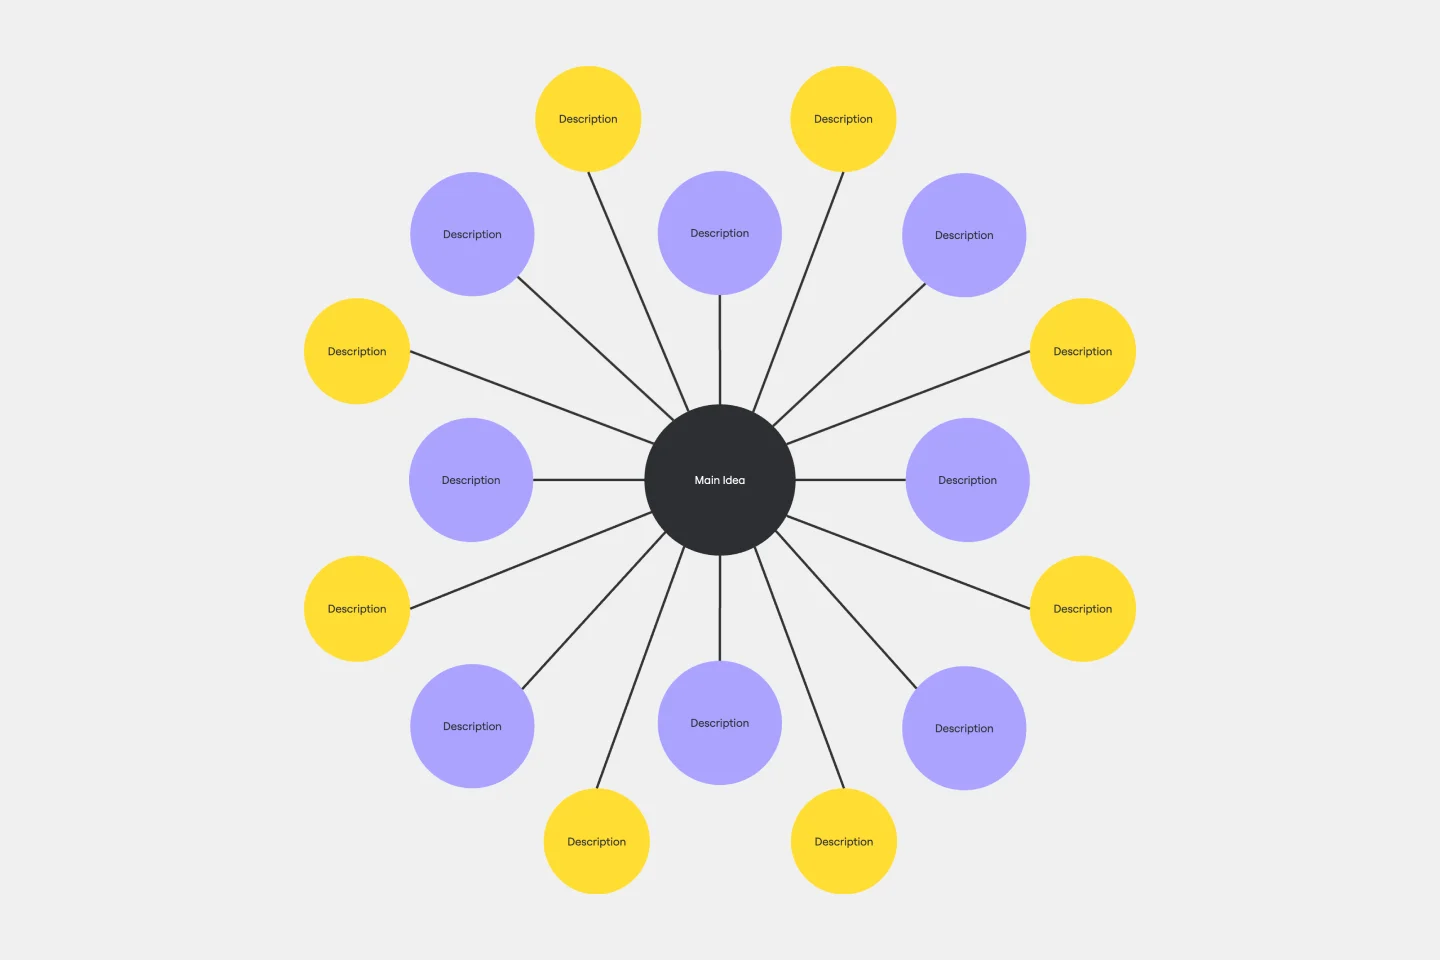
Bubble Map Template
1likes
14uses
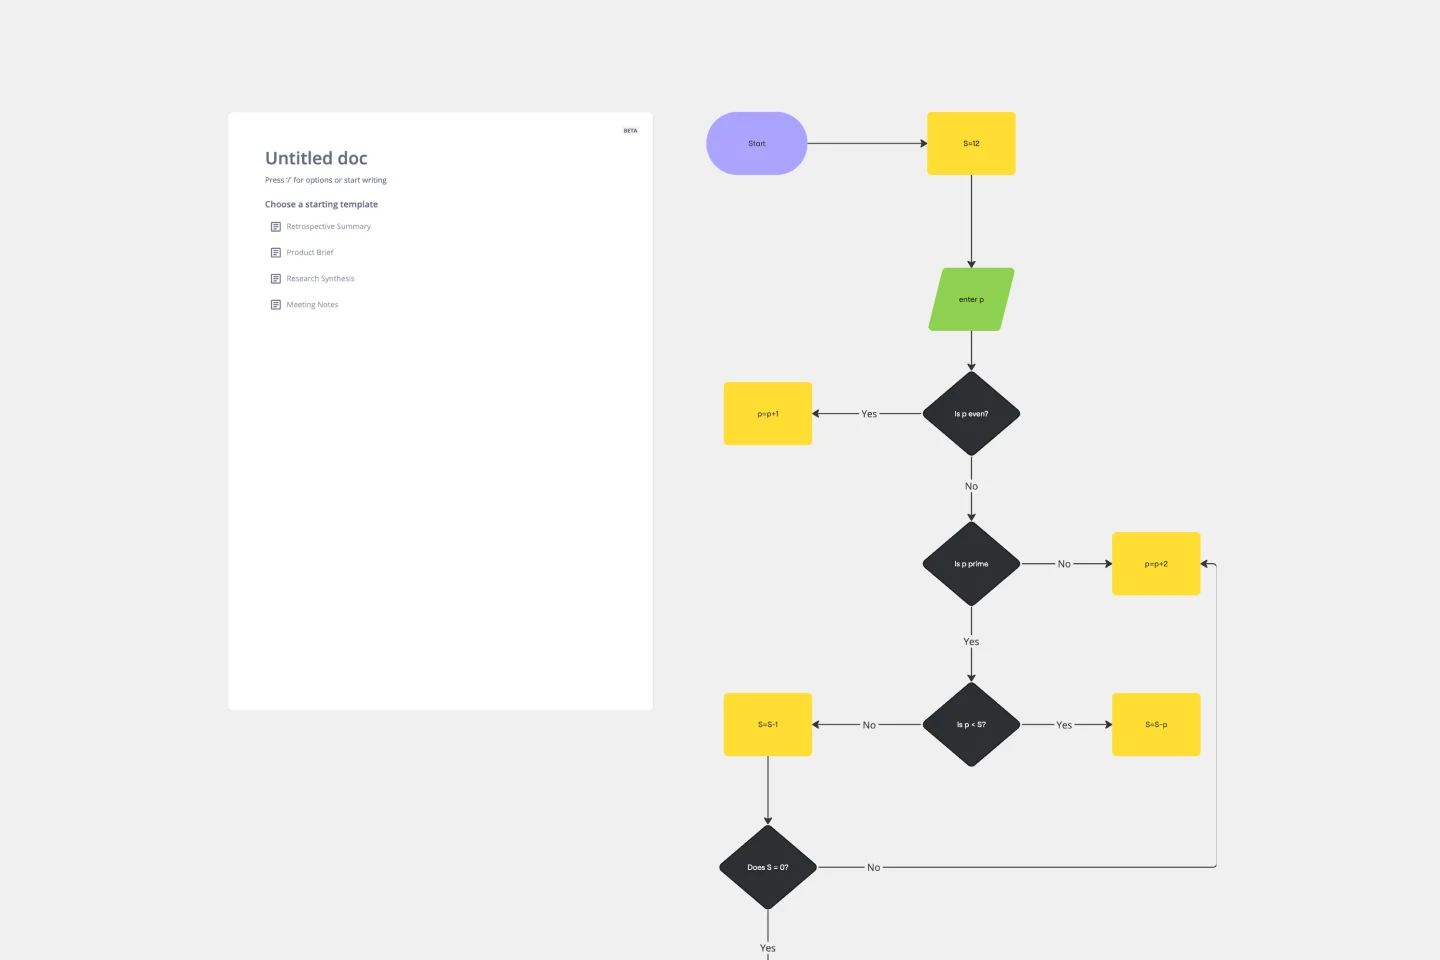
Algorithm Flowchart Template
0likes
9uses
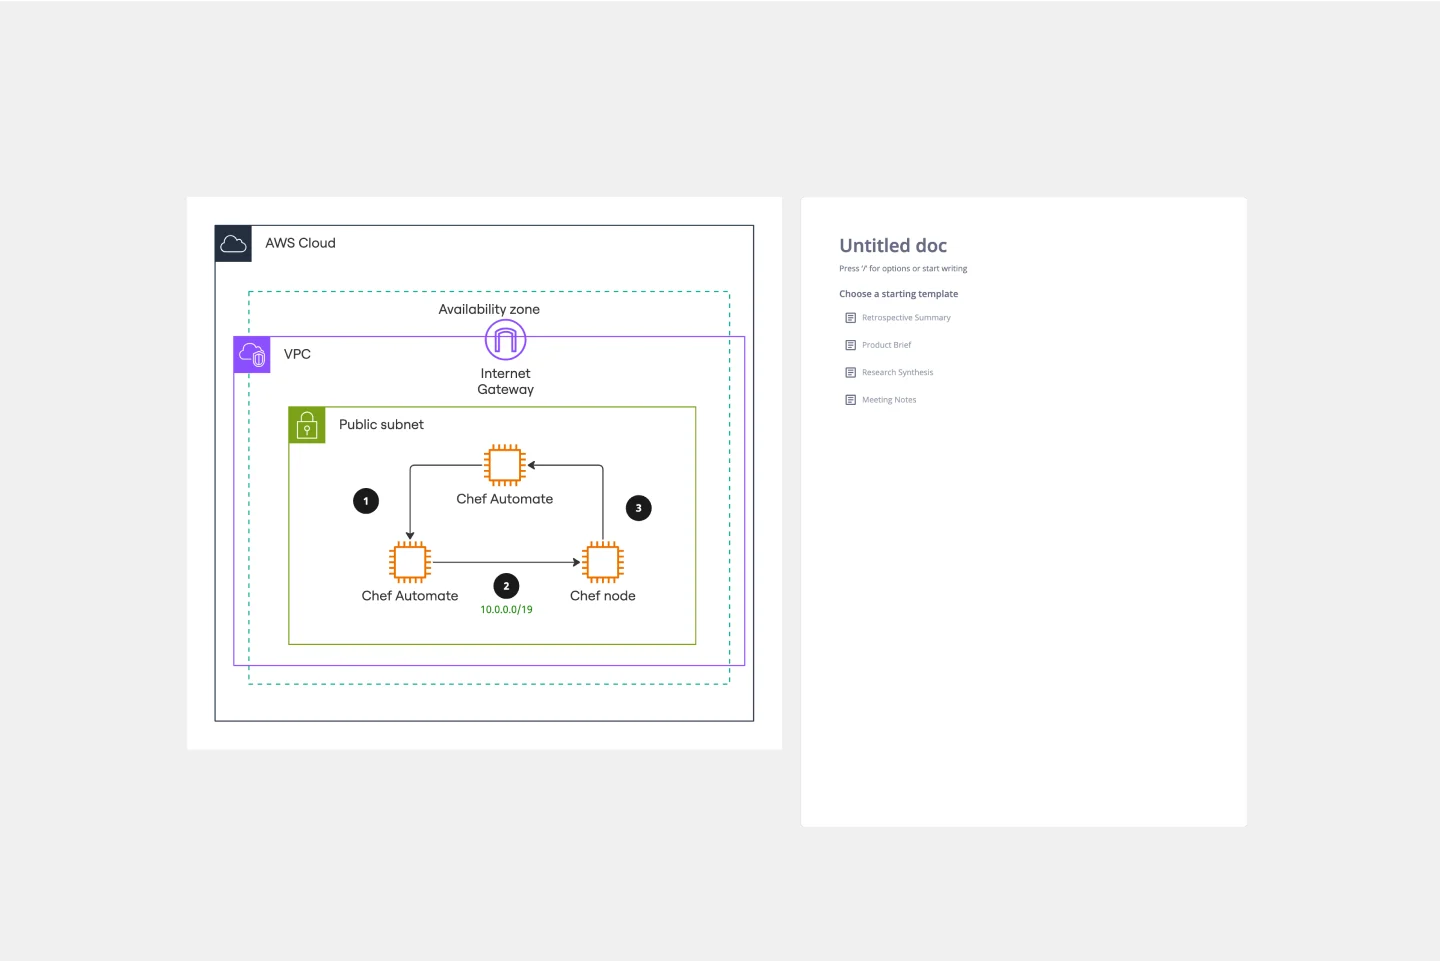
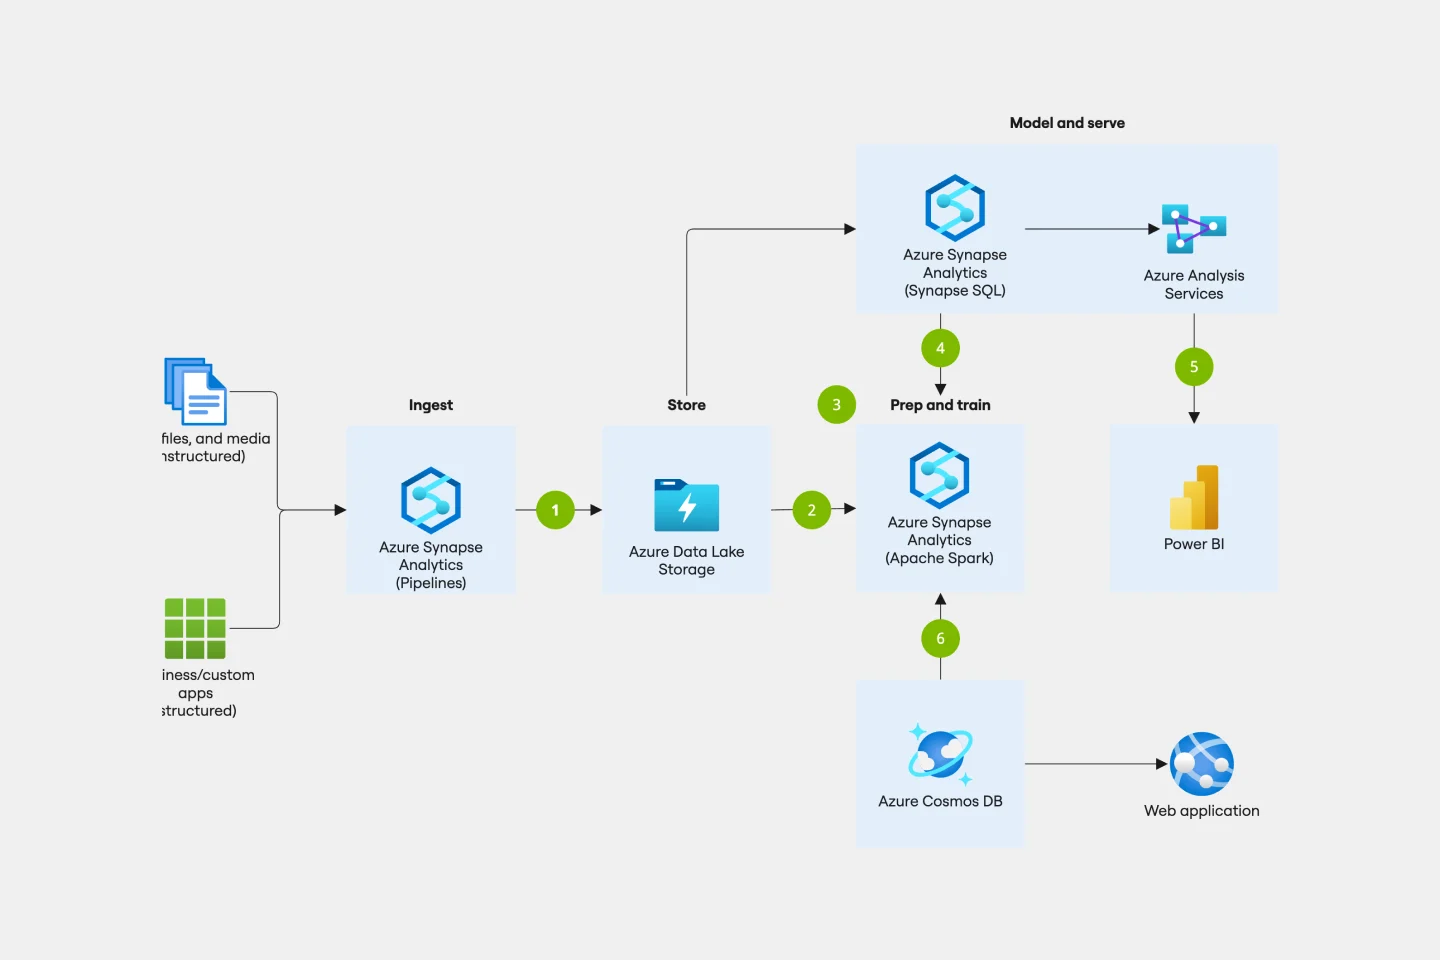
Azure Data Flow Template
0likes
10uses
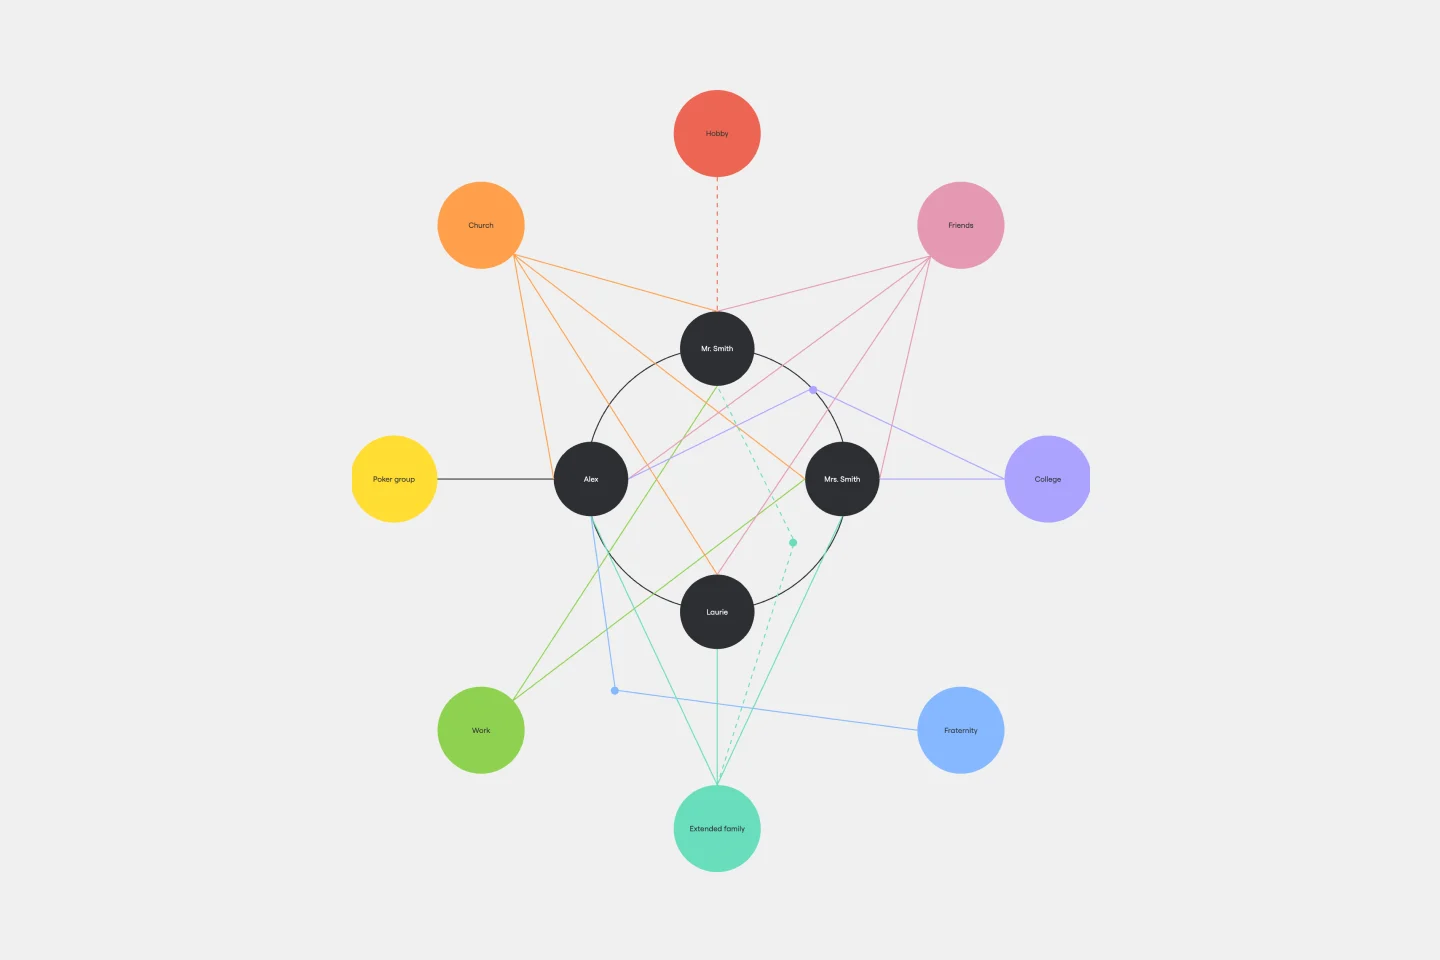
Ecomap Template
0likes
40uses