Table of contents
Table of contents
Types of graphic organizers
Summary:
- Graphic organizers are visual tools that help you structure information, spot connections, and think more clearly
- Use them for mapping out projects, breaking down complex concepts, or brainstorming your next big idea
- This guide walks you through the most common types of graphic organizers and shows you when to use each one
- Get ready-to-use templates so you can start fast — no design skills required
What is a graphic organizer?
A graphic organizer is a visual tool that structures information spatially to make relationships between ideas easier to see, understand, and remember. Rather than presenting information as linear text, graphic organizers use shapes, lines, and spatial arrangement to show how concepts connect, whether that's through hierarchy, sequence, comparison, or cause and effect.
They're widely used in education to scaffold complex thinking, and in professional settings to facilitate workshops, retrospectives, strategy sessions, and collaborative decision-making. The type of graphic organizer you choose should match the type of thinking you're trying to support: a Venn diagram for comparison, a concept map for associations, a timeline for sequence, and so on.
Types of graphic organizers explained
Graphic organizers are flexible tools used in many areas, such as education, project management, and business planning. They help organize and visualize information, making it easier to understand and communicate.
In this article, we will explore a variety of graphic organizers, each suited to specific types of data and analysis.
Collaborative AI Workflows
Join thousands of teams using Miro to build the right thing, faster.
Conceptual framework graphic organizers
Conceptual framework organizers help in breaking down complex concepts into simpler elements for easy understanding and retention.
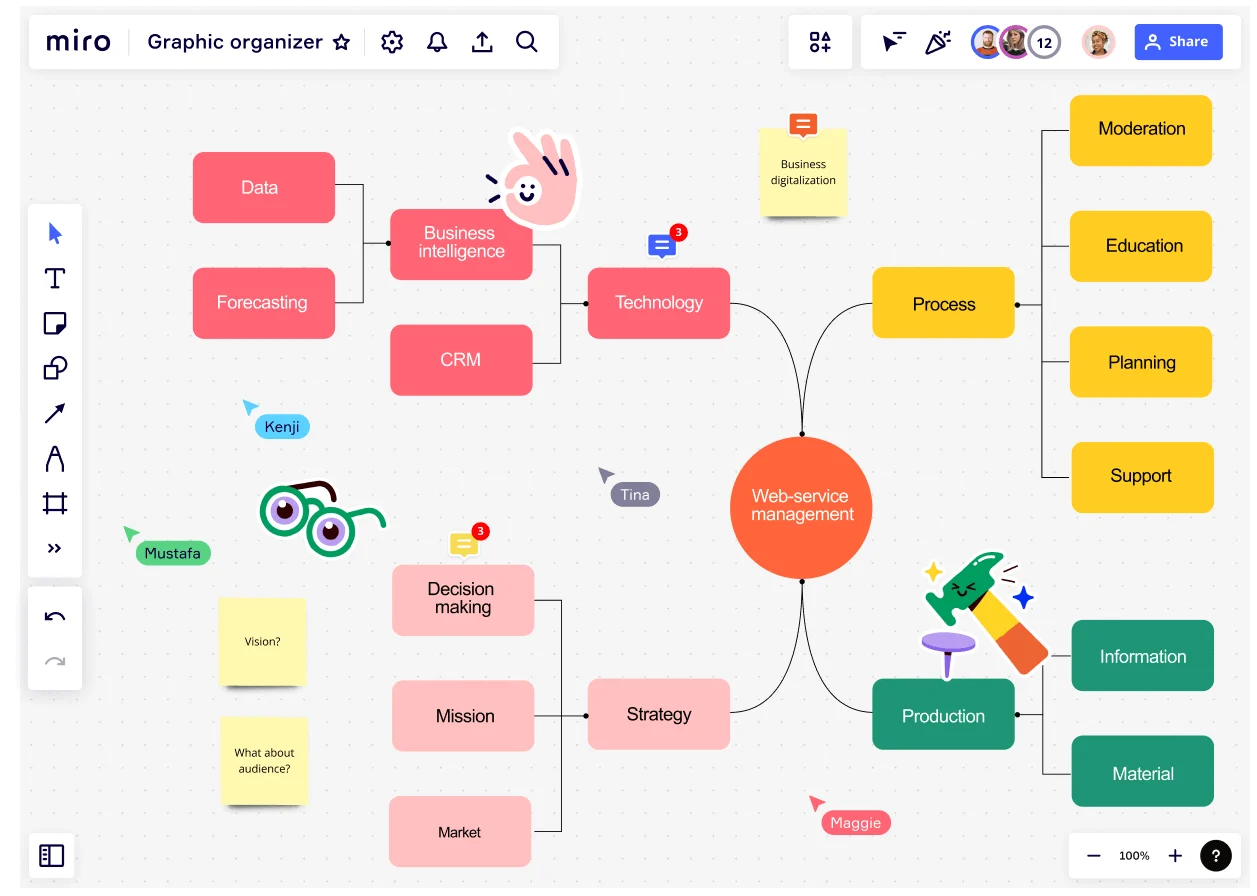
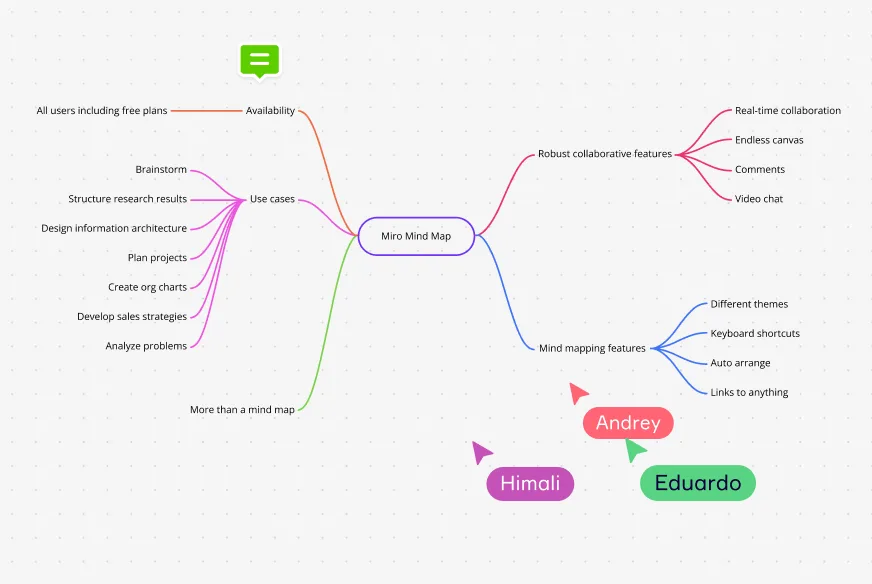
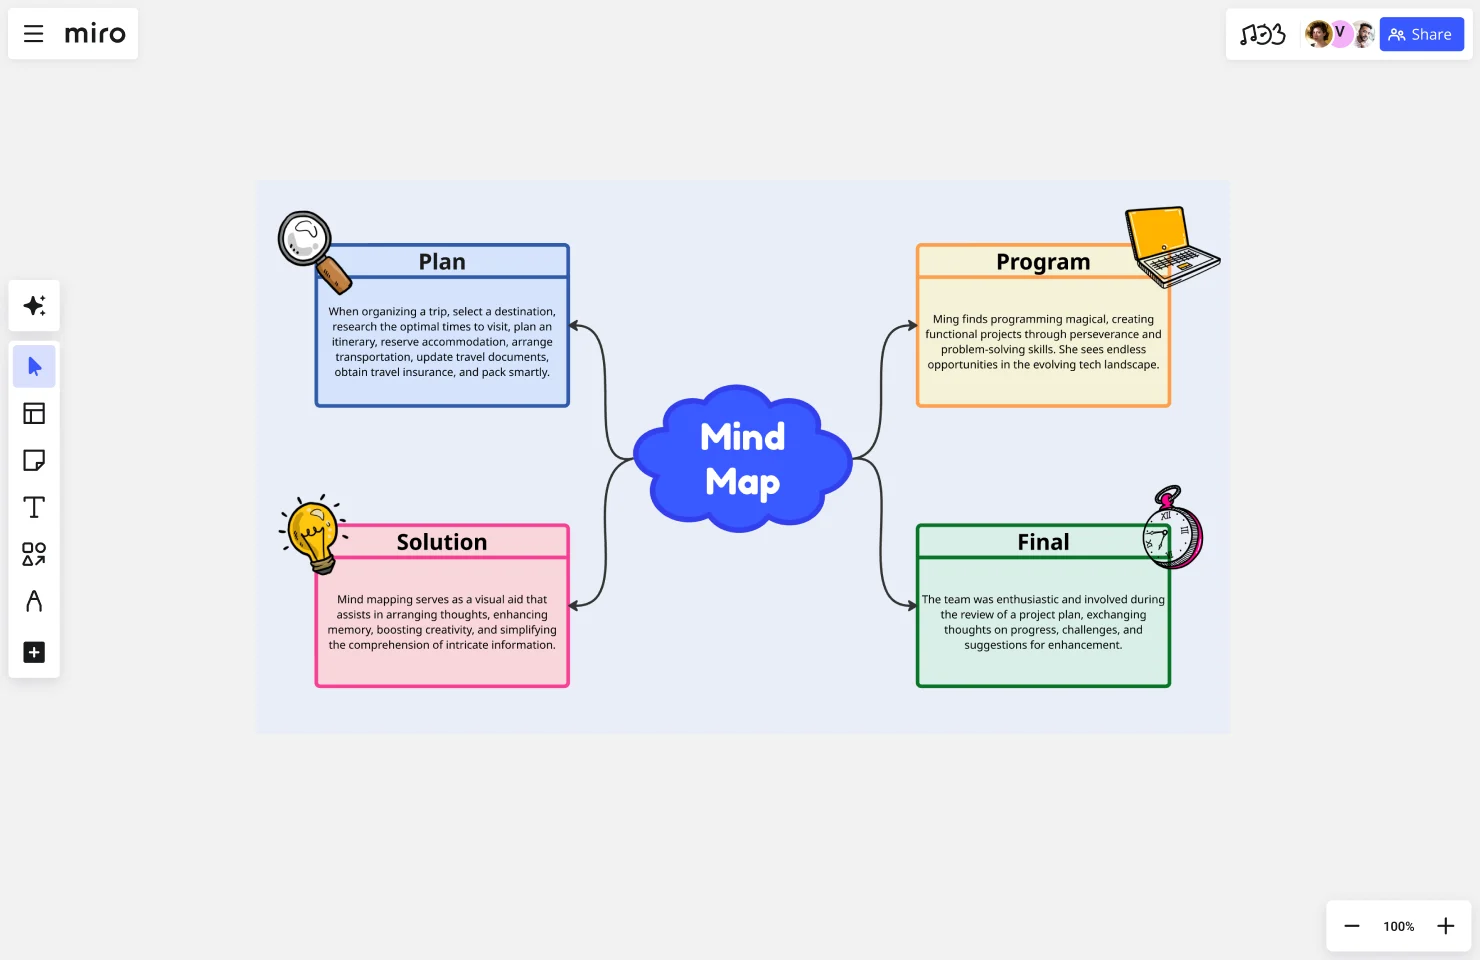
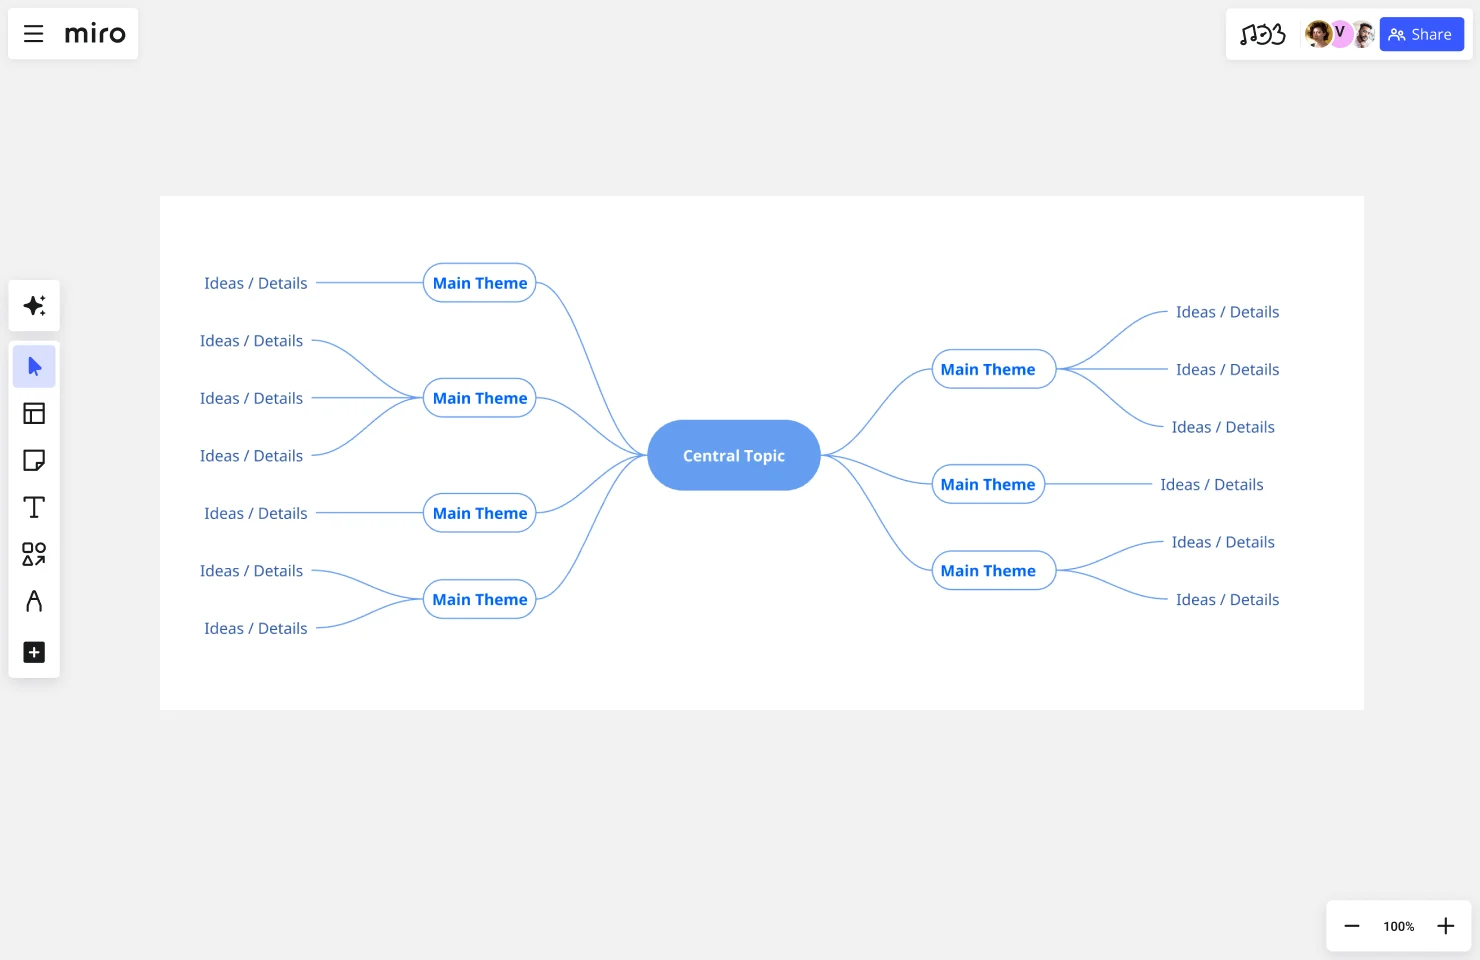
Mind maps
Mind maps are defined by their radial structure, emanating from a central idea. They are instrumental in brainstorming sessions and fostering creative thinking. The structure includes a central node with branches representing related subtopics.
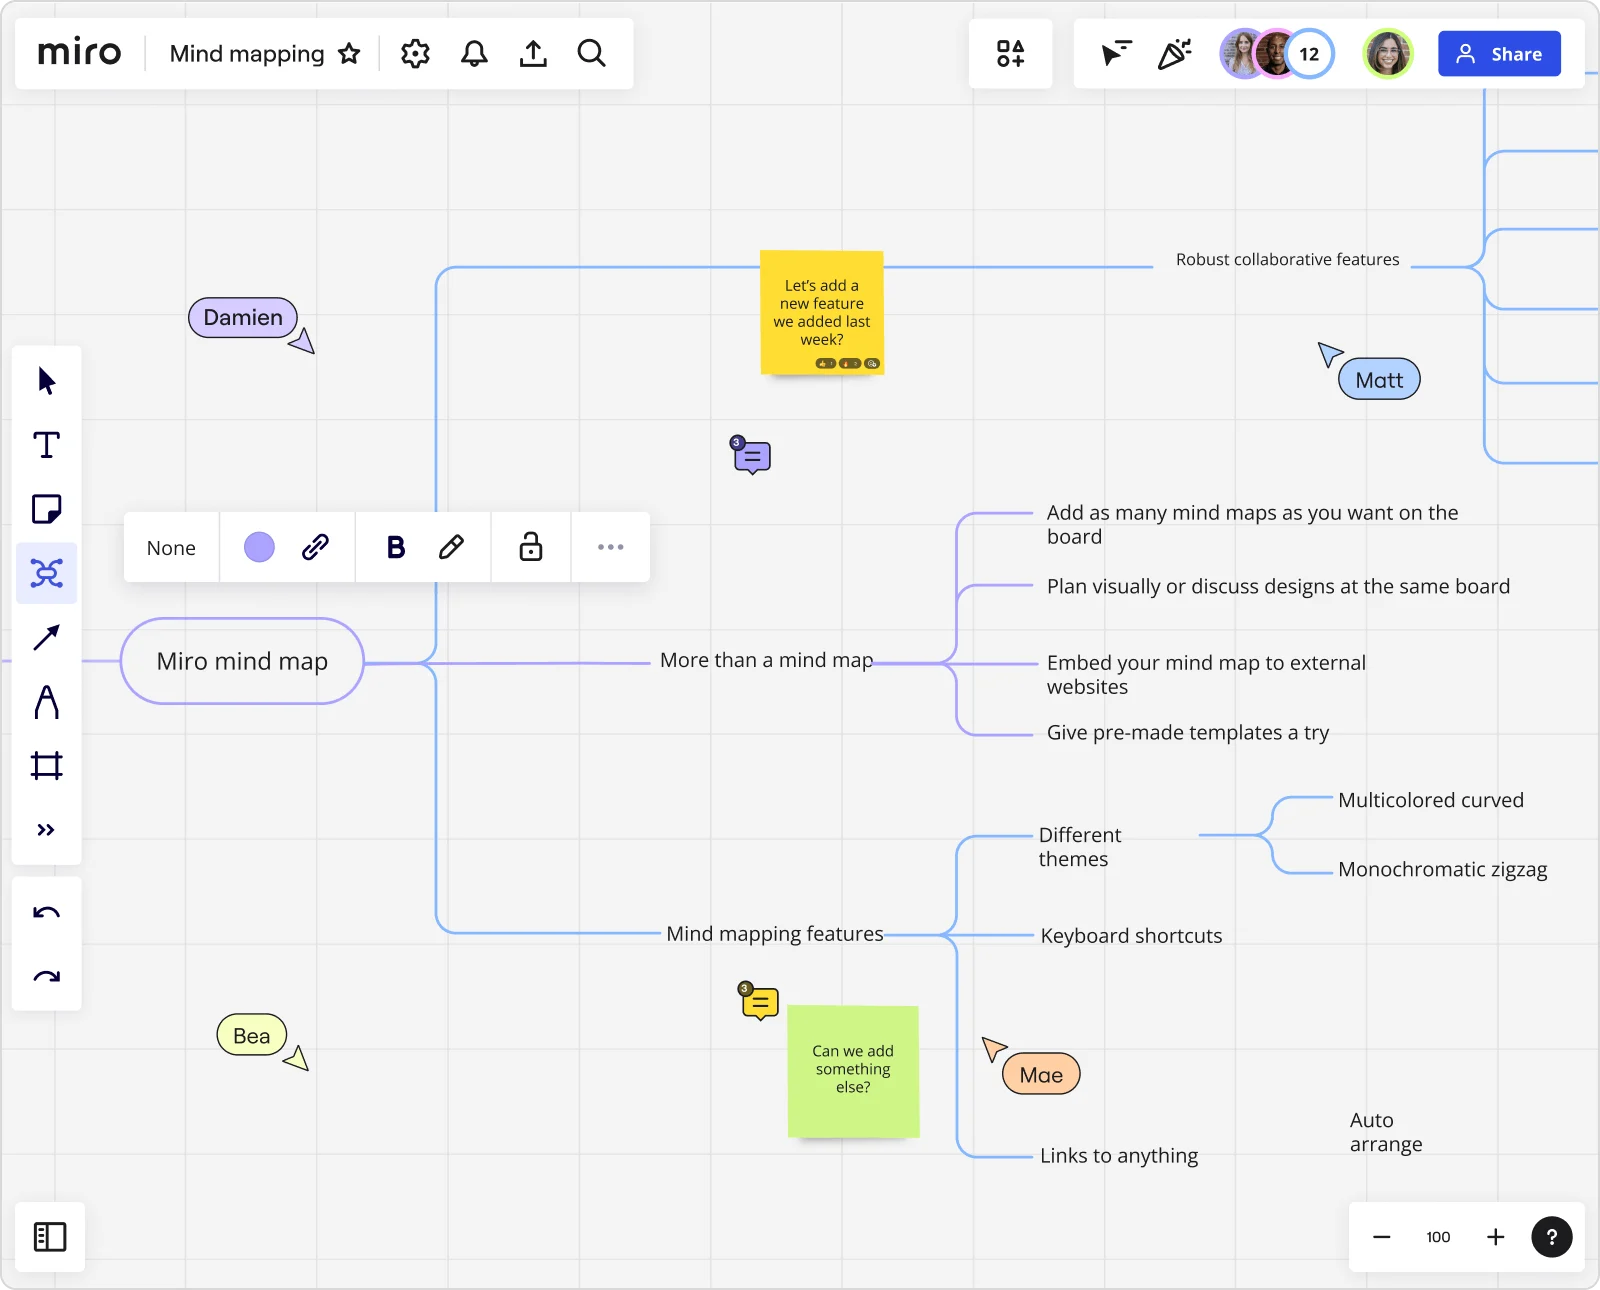
With Miro’s mind mapping tool, you can better structure your ideas.
Concept maps
Concept Maps are similar to mind maps, but with a focus on cross-links between different concepts. They are used extensively in educational settings to help with learning and knowledge assessment.
Boost creativity and generate ideas using a concept map maker.
Spider diagrams
Spider Diagrams, or spidergrams, are a form of brainstorming diagram that is used to visually organize information. Typically, they are used to organize data that is interconnected and hierarchical.
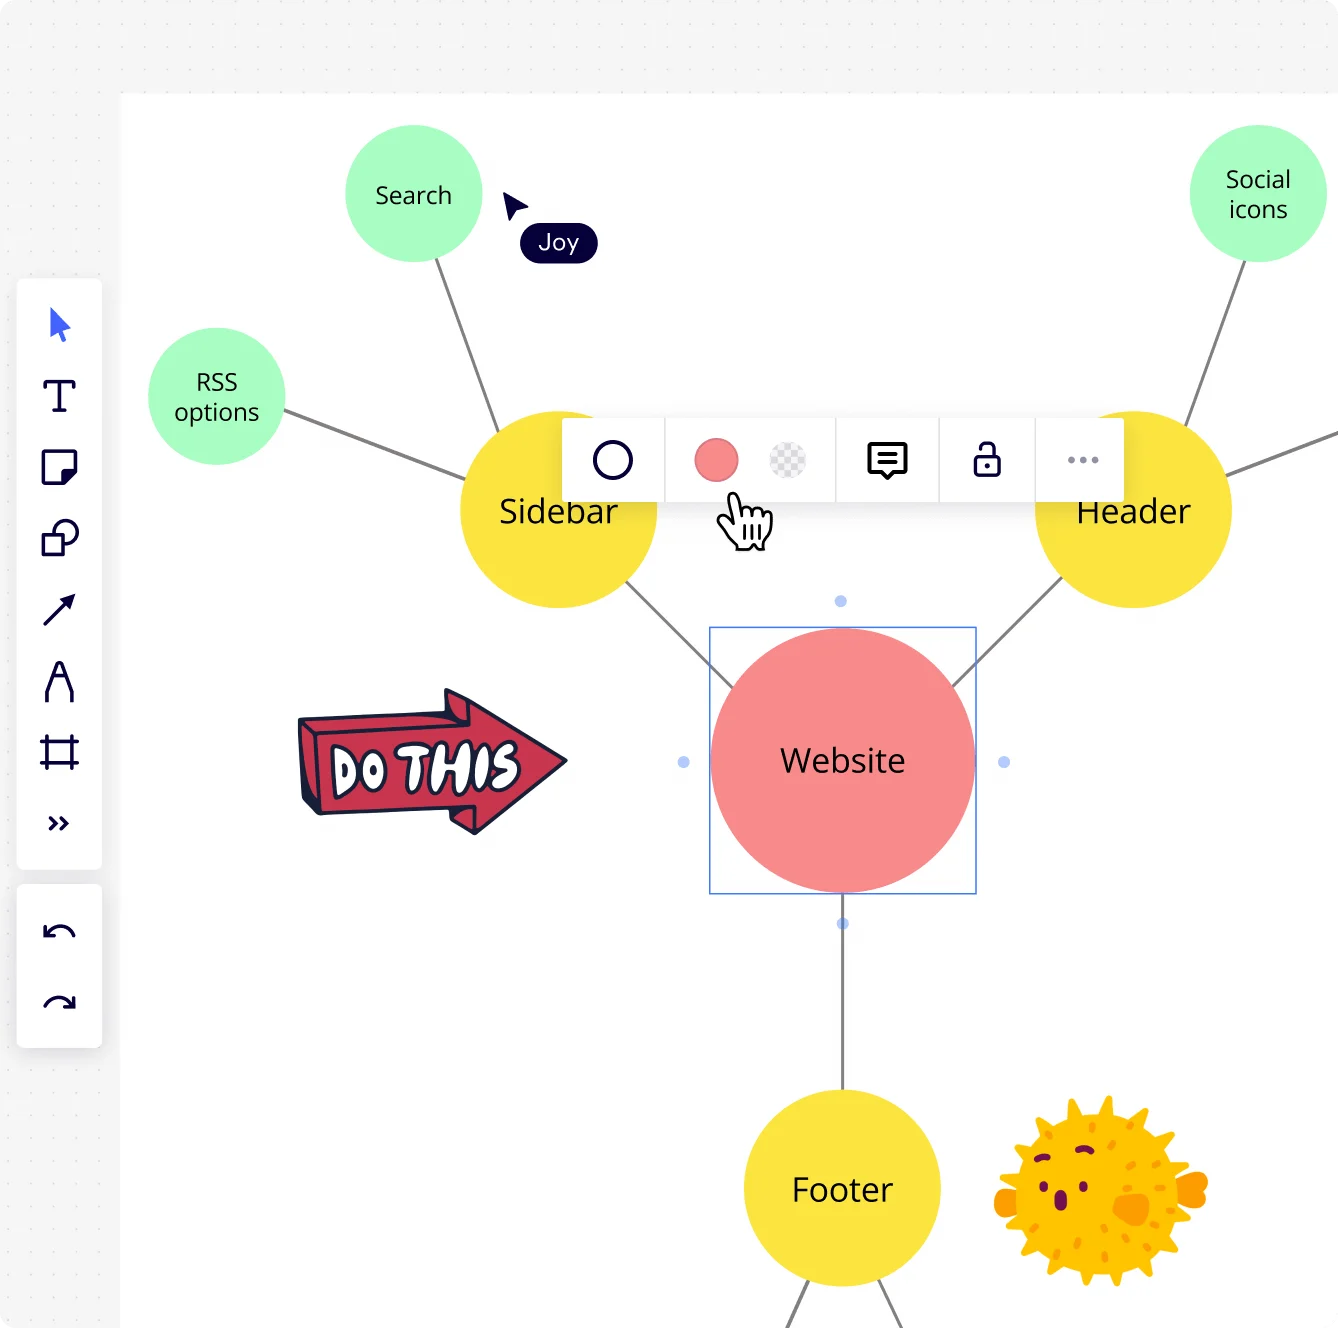
Get started with an online spider diagram
Bubble maps
Bubble Maps are used to describe the qualities of a given topic using adjectives and descriptive phrases, useful for language development and teaching.
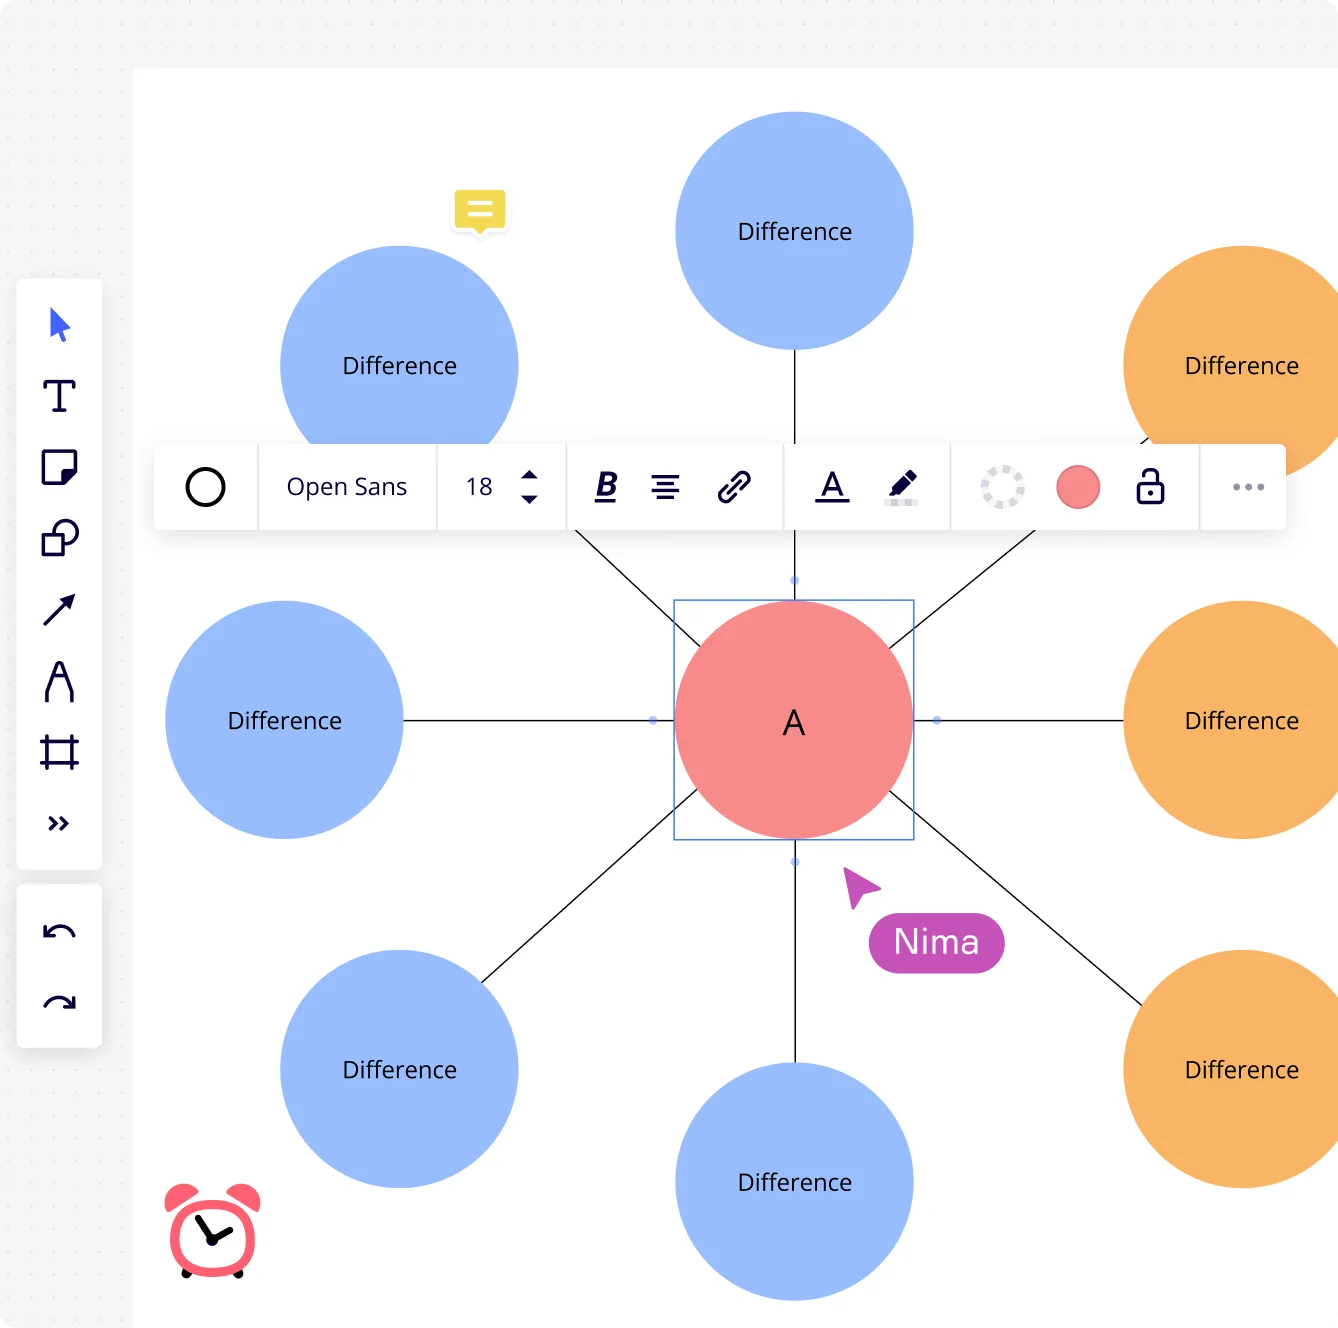
Try out Miro’s bubble map maker to create a bubble map or double bubble map.
Comparison and contrast graphic organizers
This section delves into the types of graphic organizers that help in delineating the similarities and differences between various elements.
Venn Diagrams
Venn Diagrams are circles that overlap to illustrate the similarities and differences between different sets. They have been used in various fields to provide a visual representation of relationships.

Use Miro’s online Venn diagrams
T Charts
T Charts are simple two-column charts that allow for comparison, pros and cons, and other dualistic presentations of information.
Hierarchical and relational organizers
Hierarchical and Relational Organizers are designed to represent the relationships between different levels within a system or concept. Let's take a look at these useful types of graphic organizers.
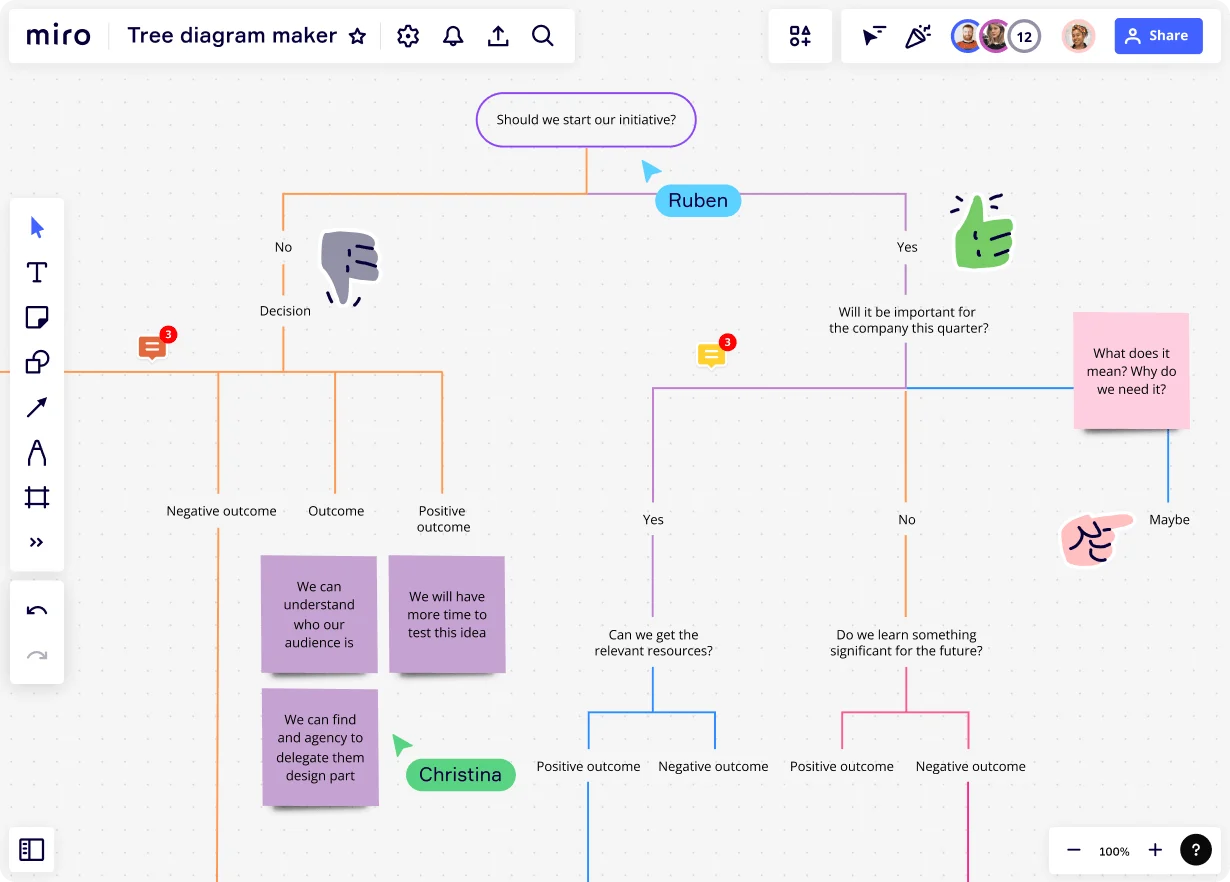
Tree Diagrams
Tree Diagrams are used to represent hierarchies, branching from a single root to various nodes. Each branch represents a decision or outcome, showing different paths and outcomes.
Organizational Charts
Organizational Charts depict the structure of an organization, illustrating the hierarchy and relationship between different roles.
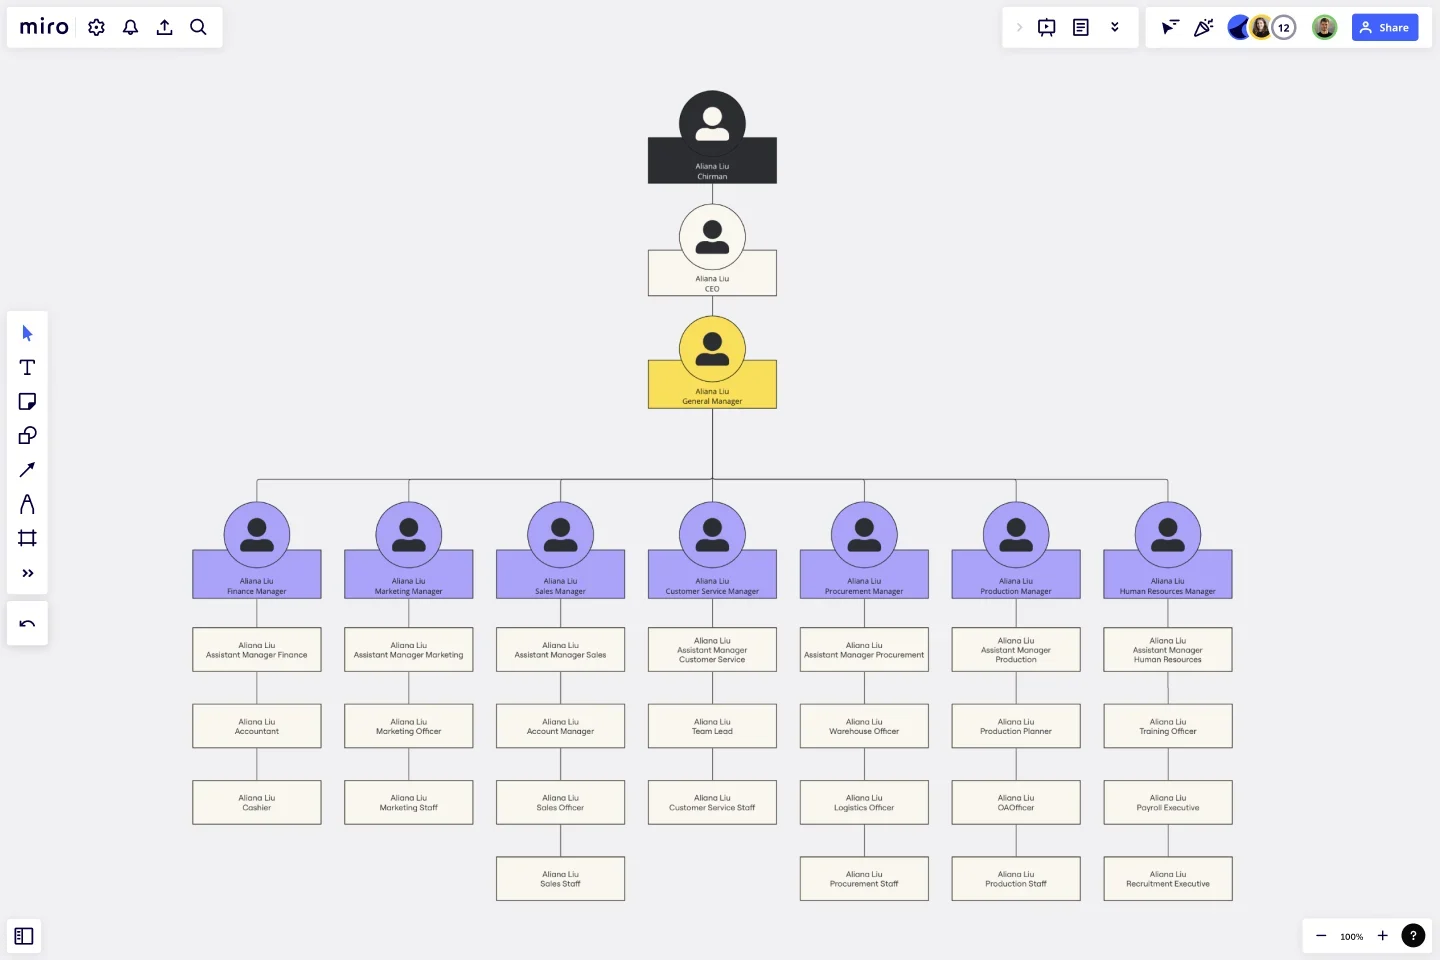
Make an org chart easily to represent your organization’s hierarchy.
Pyramid Diagrams
Pyramid Diagrams show a hierarchical structure that is arranged vertically, with the largest amount of information at the bottom and the smallest at the top, often used to represent foundational relationships.
Sequence and process organizers
These graphic organizers are crucial for mapping out chronological events or steps in a process.
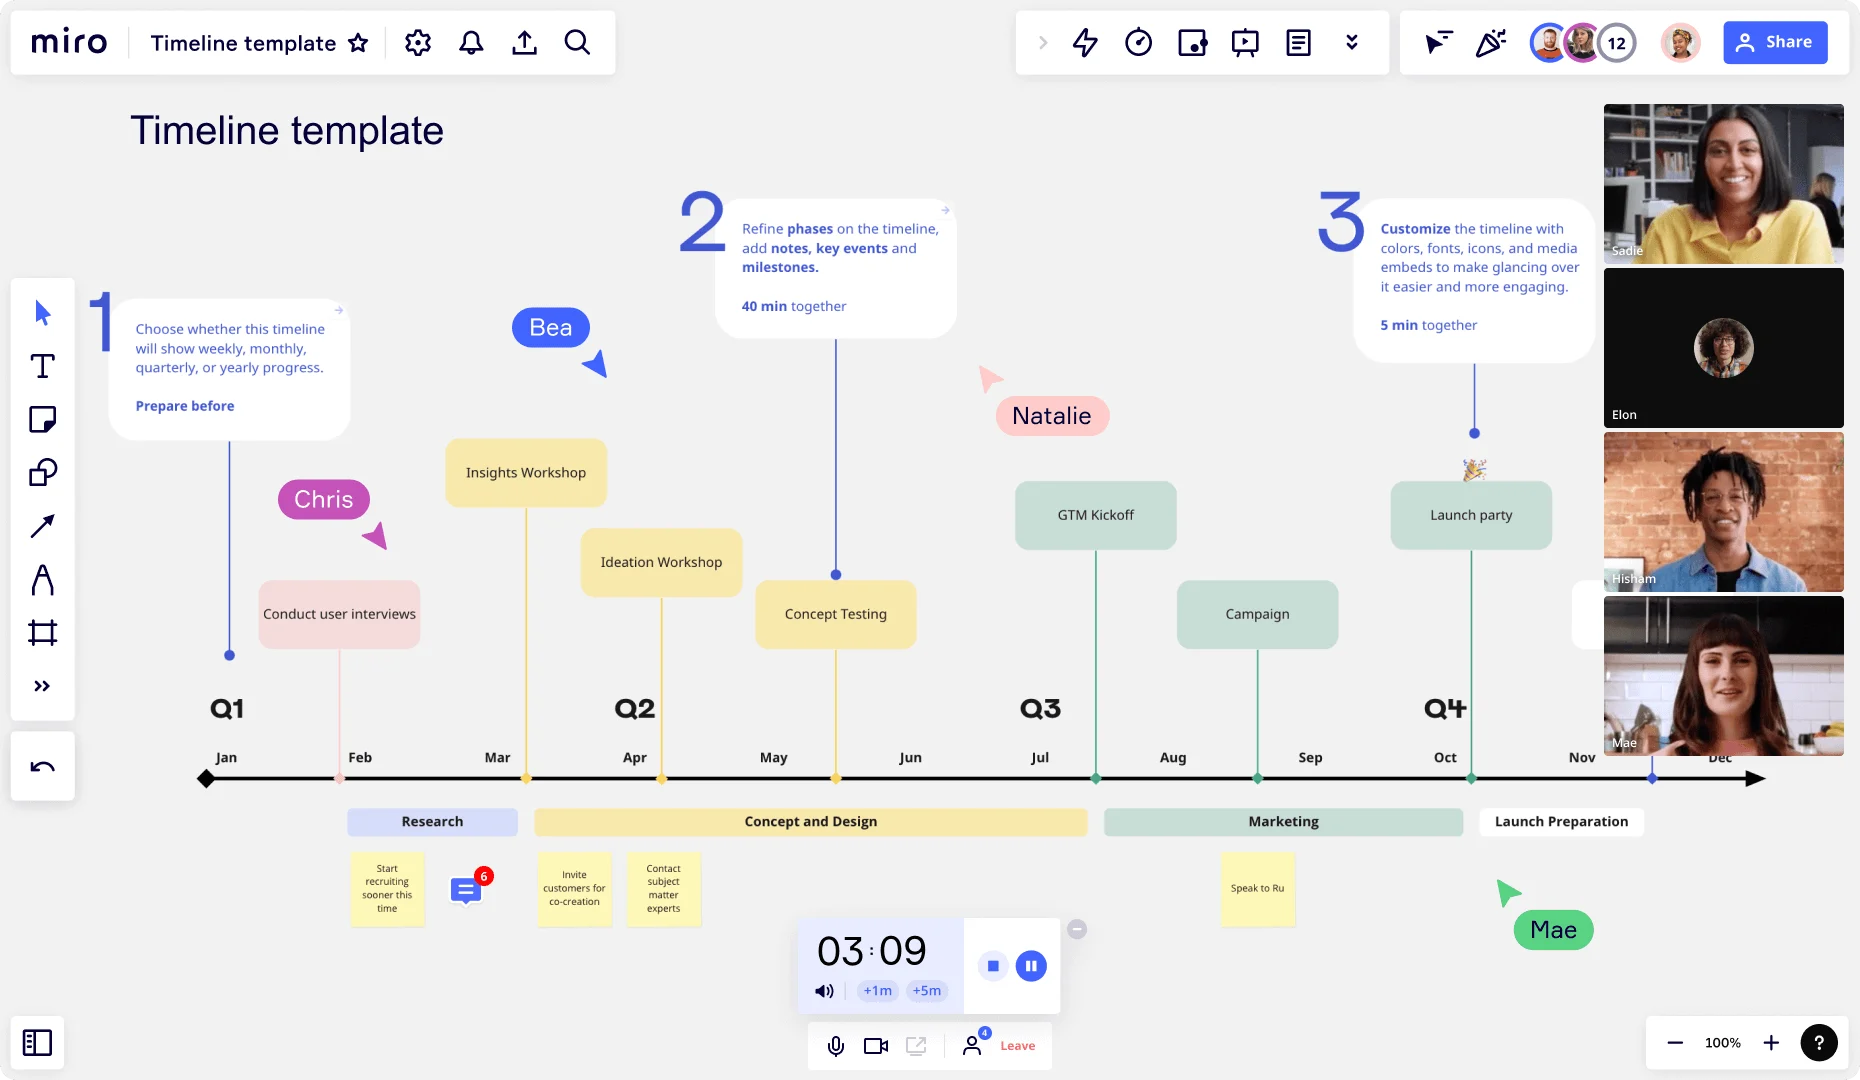
Timeline
Timelines are linear representations of events over time, which can be used to track project milestones or historical events.
Flowcharts
Flowcharts are diagrams that depict a process or a workflow, providing a step-by-step representation of a sequence of actions or steps.
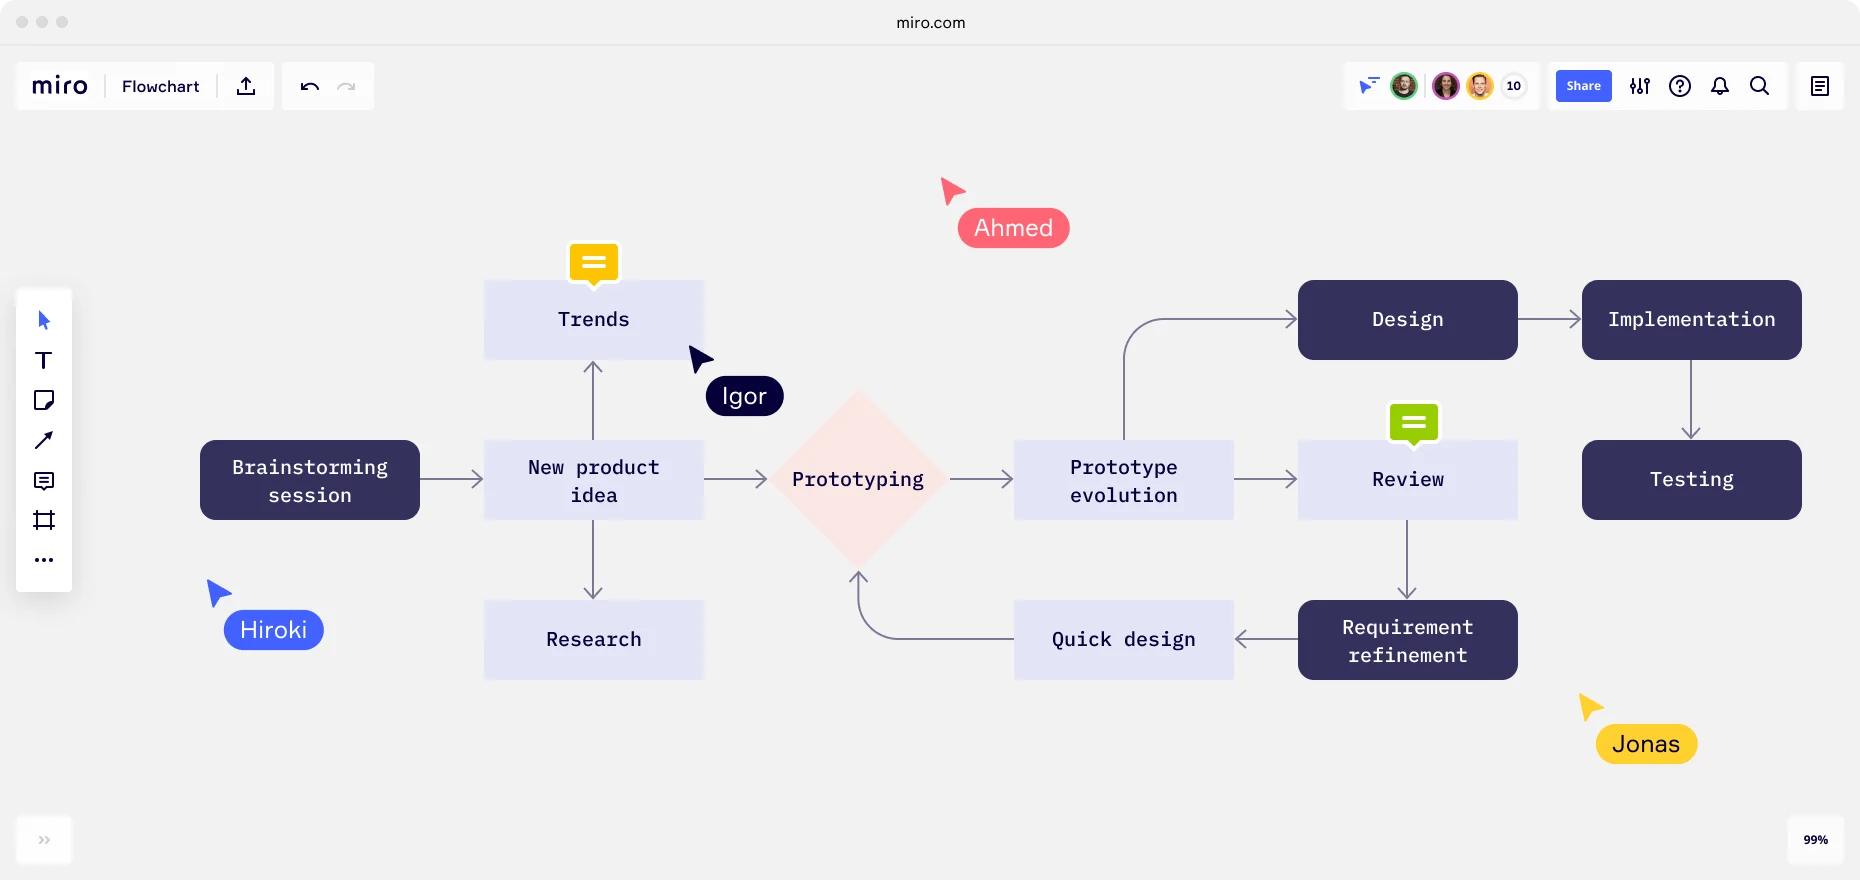
With Miro’s flowchart maker, you can easily build out a flowchart
Brainstorming graphic organizers
When your team hits a creative wall, the right brainstorming graphic organizer can transform scattered thoughts into structured innovation. These visual tools provide frameworks that help teams generate, organize, and refine ideas collaboratively — moving you from "we're stuck" to "we've got this" faster.
Here are eight powerful brainstorming graphic organizers available in Miro's template library, each designed to unlock creativity in different ways:
Canvas Brainstorming Template
This flexible canvas brainstorming template gives your team an open canvas for free-form ideation. It's ideal when you need to capture a high volume of ideas quickly without constraints, then organize them visually by themes, categories, or priority. Use it for initial brainstorming sessions where you want maximum creative freedom before imposing structure.
Curious Cat Brainstorm
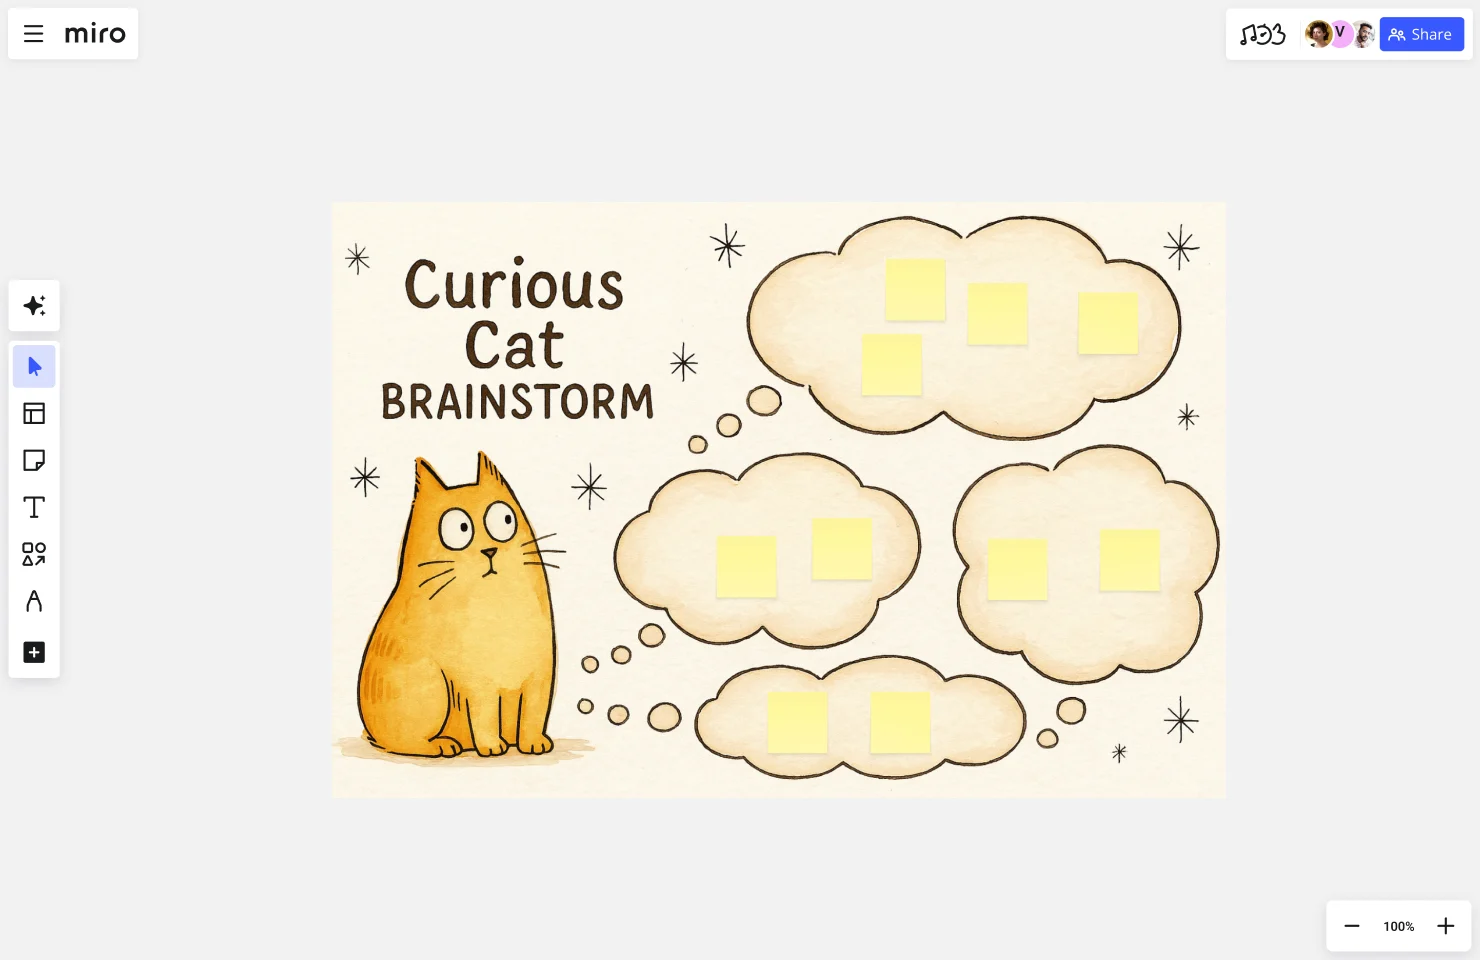
Built around asking provocative questions, this template helps teams dig deeper into problems before jumping to solutions. The Curious Cat approach encourages participants to challenge assumptions and explore "what if" scenarios, making it particularly valuable when you suspect your team might be solving the wrong problem or missing key insights.
Product Brief Brainstorm
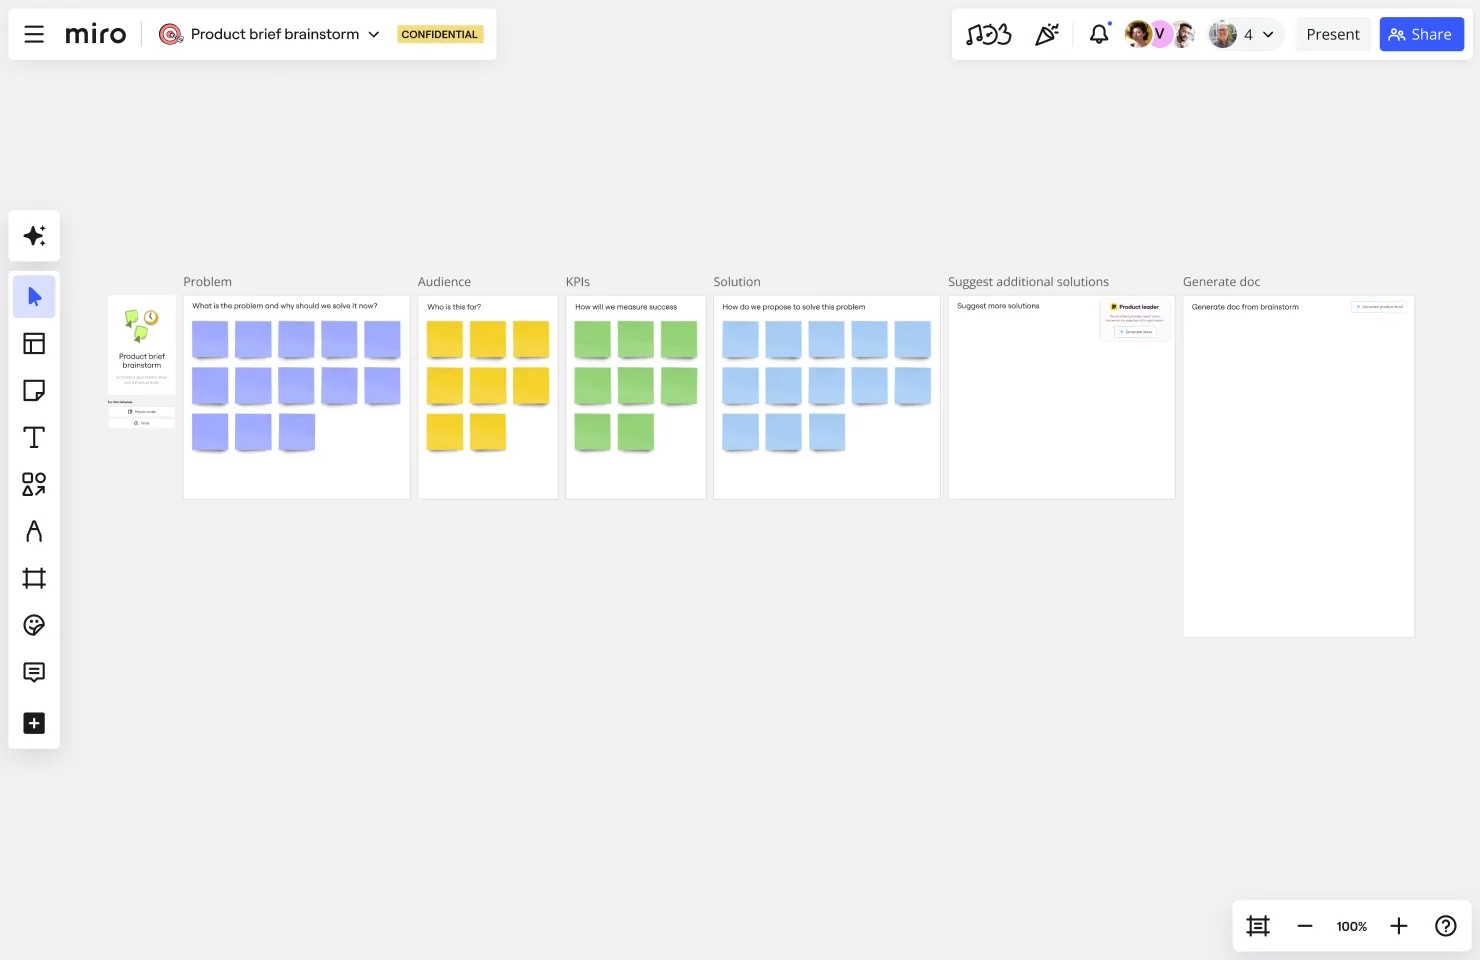
This structured product template guides product teams through brainstorming sessions focused on defining product requirements, features, and user needs. It's especially useful for cross-functional teams who need to align on product vision, scope, and priorities before development begins — ensuring everyone's ideas are captured within a product-focused framework.
Blue Colorful Illustrative Mind Map by Rizwan Khawaja
This visually engaging mind map template uses color and illustration to make idea mapping more intuitive and memorable. Starting from a central concept, teams can branch out into related ideas, sub-topics, and connections. The visual hierarchy helps teams see relationships between concepts and identify patterns that might otherwise go unnoticed.
Light Blue Systemic Mind Map Brainstorm by Carolina Poll
This systemic mind map takes a more holistic approach to brainstorming, helping teams visualize how different elements of a system interact and influence each other. It's particularly effective for complex problem-solving where you need to understand interconnections, dependencies, and potential ripple effects of ideas or decisions.
1-2-4-All Brainstorming Technique
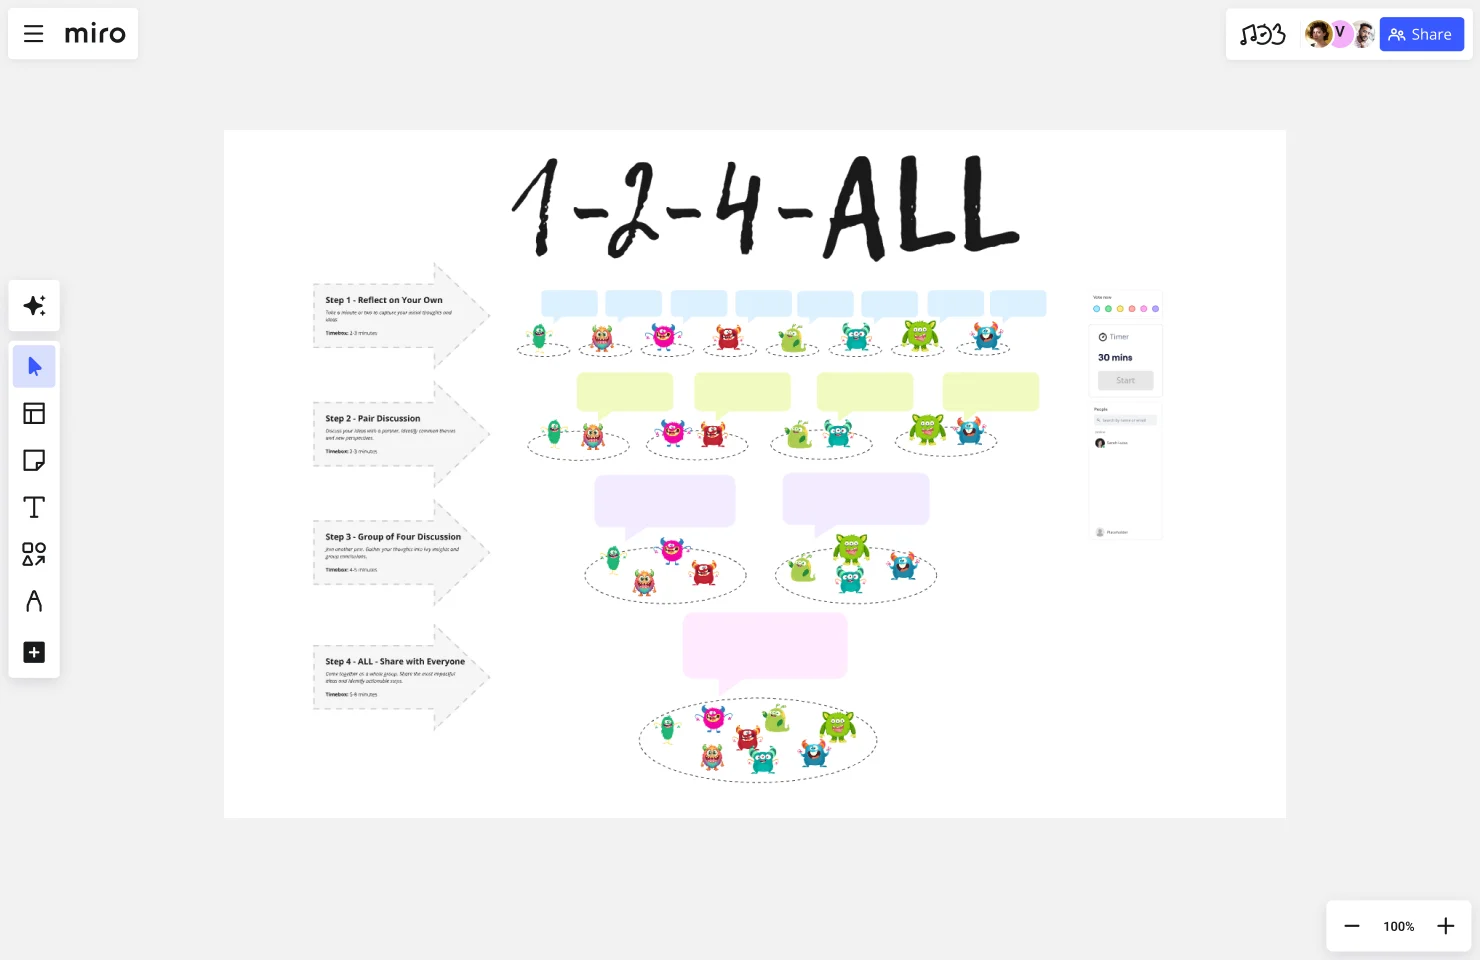
This progressive brainstorming method starts with individual reflection (1), pairs people for discussion (2), expands to small groups (4), and finally brings everyone together (All). The structured progression ensures quieter team members have time to develop ideas individually before group discussion, resulting in more diverse contributions and better idea quality.
Dragon Spark Board
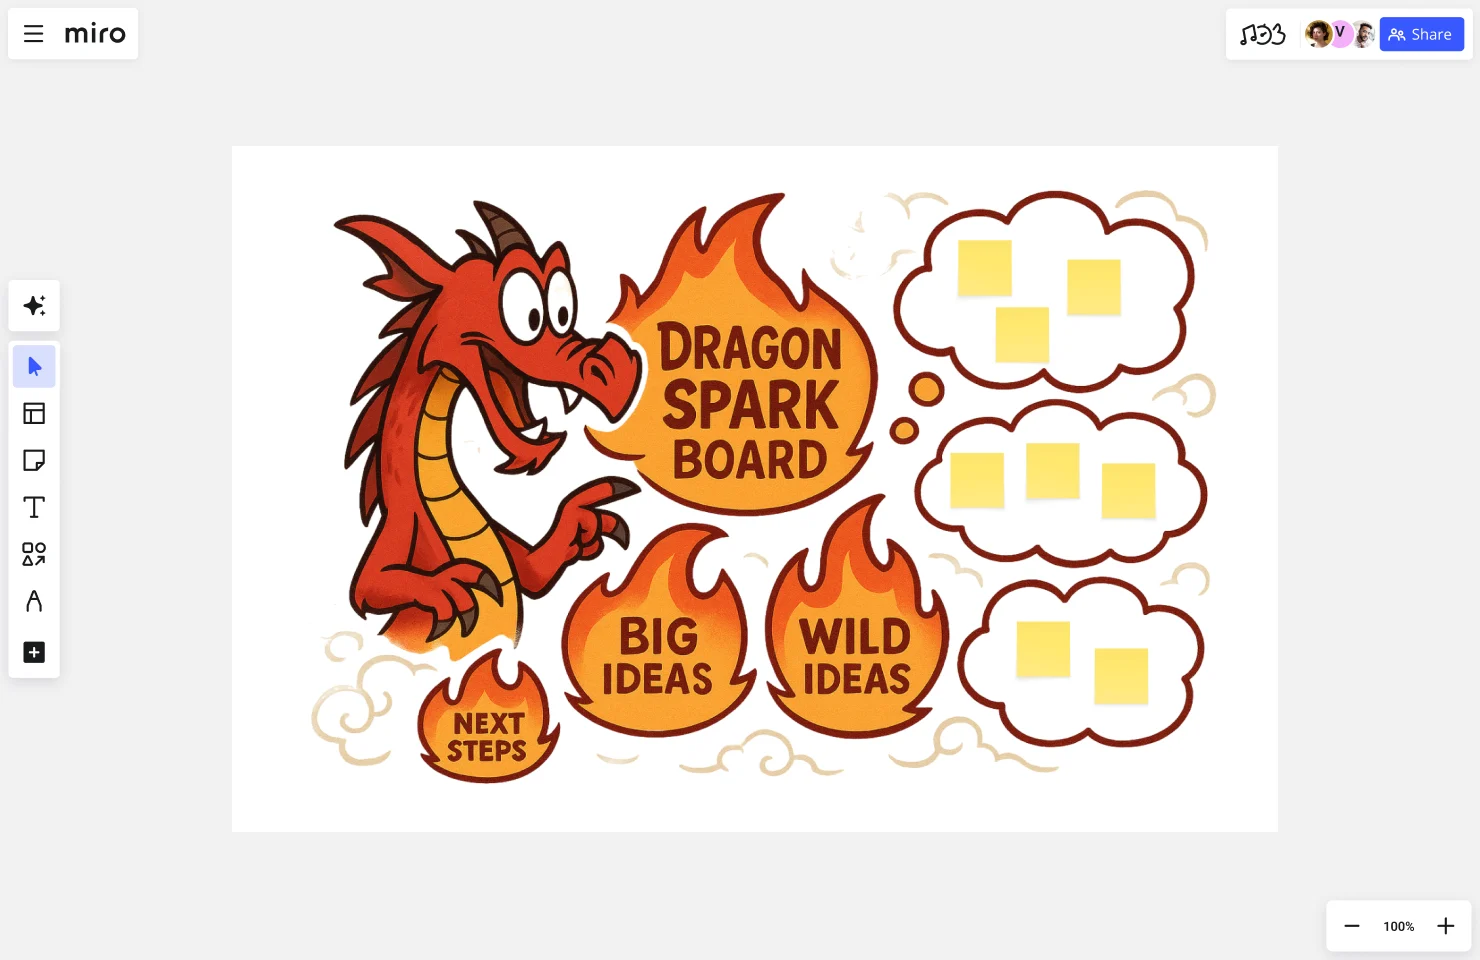
Designed to ignite bold, transformative thinking, the Dragon Spark Board helps teams generate audacious ideas without self-censorship. This template is ideal when you need breakthrough innovation rather than incremental improvements — think moonshot projects, disruptive strategies, or reimagining what's possible when you remove conventional constraints.
SCAMPER
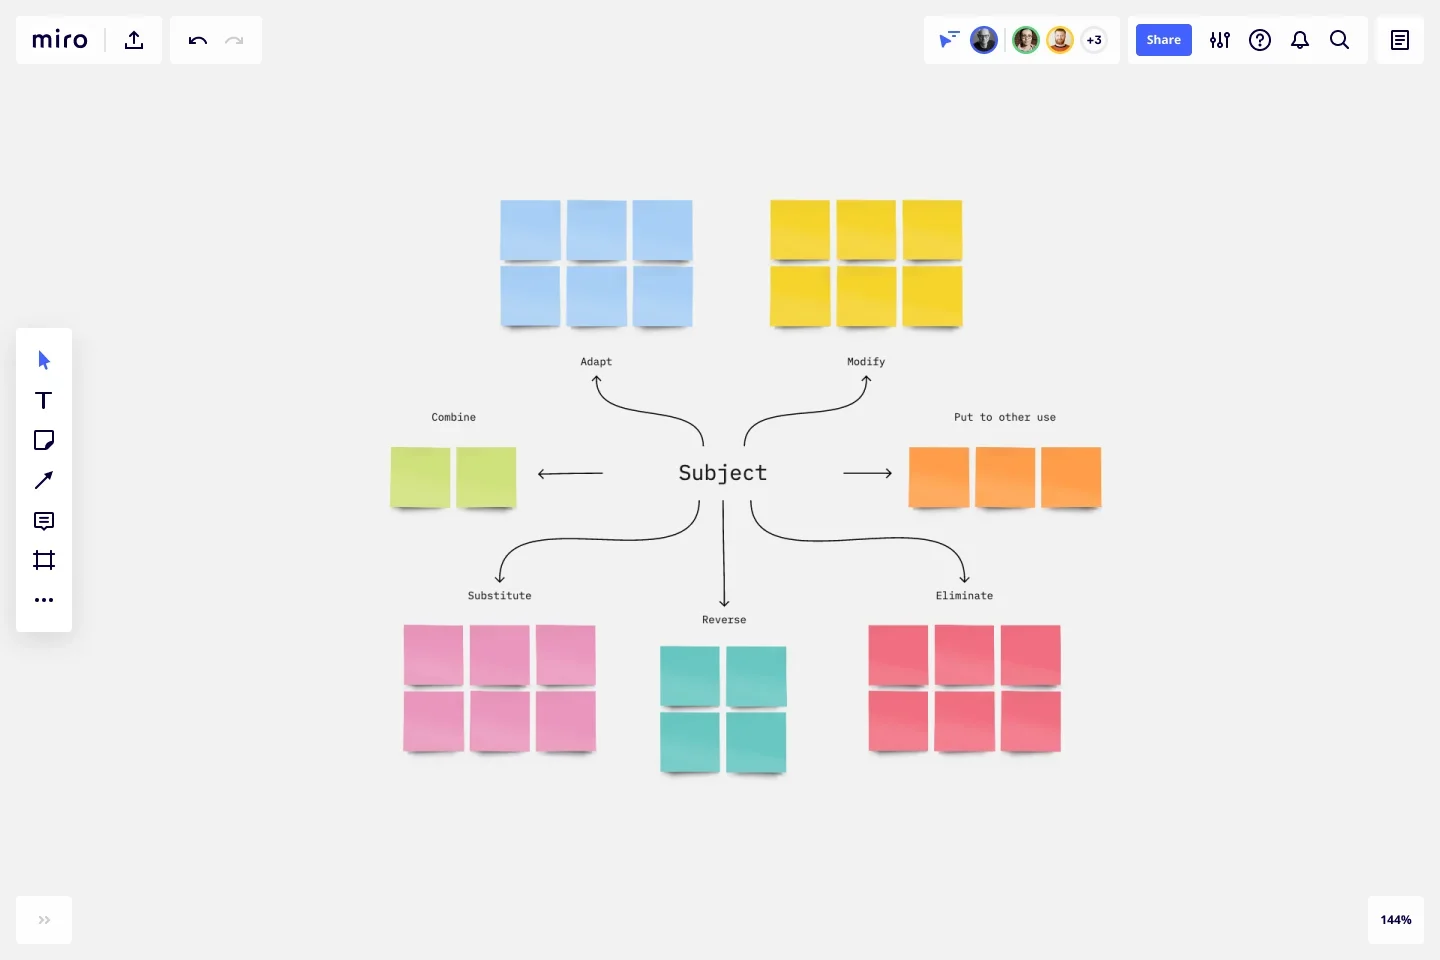
SCAMPER is an acronym for seven different ways to approach creative problem-solving: Substitute, Combine, Adapt, Modify, Put to another use, Eliminate, and Reverse. This template walks teams through each lens systematically, ensuring you've explored multiple angles before settling on a direction. It's particularly valuable for product innovation and process improvement initiatives.
These graphic organizers give your team the structure needed to channel creativity productively. Choose the template that matches your challenge — whether you need open-ended exploration, systematic analysis, or structured progression — and start collaborating.
Choosing the right graphic organizer for your task
Selecting the most effective online graphic organizer is crucial for achieving your informational and communicative goals. This choice should be driven by the nature of the content, the needs of the audience, and the complexity of the information.
When choosing a graphic organizer, consider the purpose of the information you're presenting, your audience, and the nature and volume of information. Adhering to design principles is key in creating effective graphic organizers. Ensure that the chosen organizer enhances the communication of your ideas.
If you're comparing two or more things, use a Venn diagram or T-chart. If you're exploring a concept and its connections, use a concept map or mind map. If you're mapping a sequence or process, use a timeline or flowchart. If you're breaking a topic into subcategories, use a tree diagram or hierarchy chart. The key question is: what kind of relationship am I trying to make visible?
Create graphic organizers in Miro
Every template mentioned above is ready for you in Miro — no design skills required. But here's what makes creating graphic organizers in Miro different:
Your team can collaborate in real time. Multiple people can add ideas, move items around, and build on each other's thinking simultaneously — whether you're in the same room or distributed across time zones.
Templates get you started fast. Click a template, customize it for your needs, and start collaborating immediately. No blank canvas paralysis.
Everything connects. Your graphic organizers don't live in isolation. Link them to other boards, embed documents, attach files, and integrate with tools like Jira, Slack, or Microsoft Teams so context flows between where you plan and where you execute.
AI gives you a head start. Use Miro AI to generate initial mind maps, process flows, or concept maps based on your prompts. Then refine collaboratively with your team.
Ready to bring structure to your next challenge? Pick a graphic organizer template, invite your team, and start making sense of complexity — together.
Graphic organizers FAQs
Can I customize these graphic organizer templates? Absolutely. Every Miro template is fully customizable — change colors, add or remove sections, adjust layouts, or blend elements from multiple templates. The templates give you structure, but you're in full control of how they evolve.
Can I share graphic organizers with people outside my organization? Yes. You can invite external collaborators as guests to specific boards, or share boards via public or password-protected links. You control access levels — view only, can comment, or can edit — so external partners, clients, or stakeholders can participate at the right level.
Does Miro integrate with tools my team already uses? Most likely. Miro connects with 100+ apps including Slack, Microsoft Teams, Google Workspace, Jira, Asana, Figma, and more. You can embed Miro boards in other tools, sync data between platforms, and trigger actions across your workflow — so your graphic organizers stay connected to where work happens.
Is there a Miro community where I can find more templates and ideas? Yes. Miro's Community includes thousands of user-created templates, educational content, and discussions where practitioners share how they're using graphic organizers to solve real problems. You'll also find templates built by other Miro users in the template library — like the mind maps featured in this article.
How much does Miro cost? Miro offers a Free plan with unlimited team members and three editable boards — great for trying out graphic organizers and small projects. Paid plans start at $8/member/month (billed annually) and include unlimited boards, advanced features, integrations, and admin controls. See all plan options and pricing.
Can I use Miro offline? Miro works best with an internet connection since it's designed for real-time collaboration. However, the Miro desktop app offers limited offline viewing of recently accessed boards. Any changes you make offline will sync once you're back online.
Author: Miro Team
Last update: June 15, 2025