In December 1921, industrial psychologists Lillian Gilbreth and Frank Bunker Gilbreth presented a new model for problem solving to the American Society of Mechanical Engineers in New York City.
Their “process chart” — known today as a flowchart — is a method of visualizing a process in order to improve it. More than one hundred years later, companies from manufacturing to tech startups use flowcharts to pinpoint bottlenecks, improve efficiency, and enhance decision-making for their biggest challenges.
How flowcharts simplify problem solving
Visualizing a problem lets us see it in its entirety and process how different components interact. That’s because, according to the Gestalt Principles, with visual representation, our minds can quickly perceive individual elements as a whole and understand a problem better.
“Every detail of a process is more or less affected by every other detail,” the Gilbreths theorized. “Therefore, the entire process must be presented in such [a] form that it can be visualized all at once before any changes are made in any of its subdivisions.”
Once you see how individual elements work together to create a process, you can take steps to modify elements to improve the whole.
What is a problem-solving flowchart?
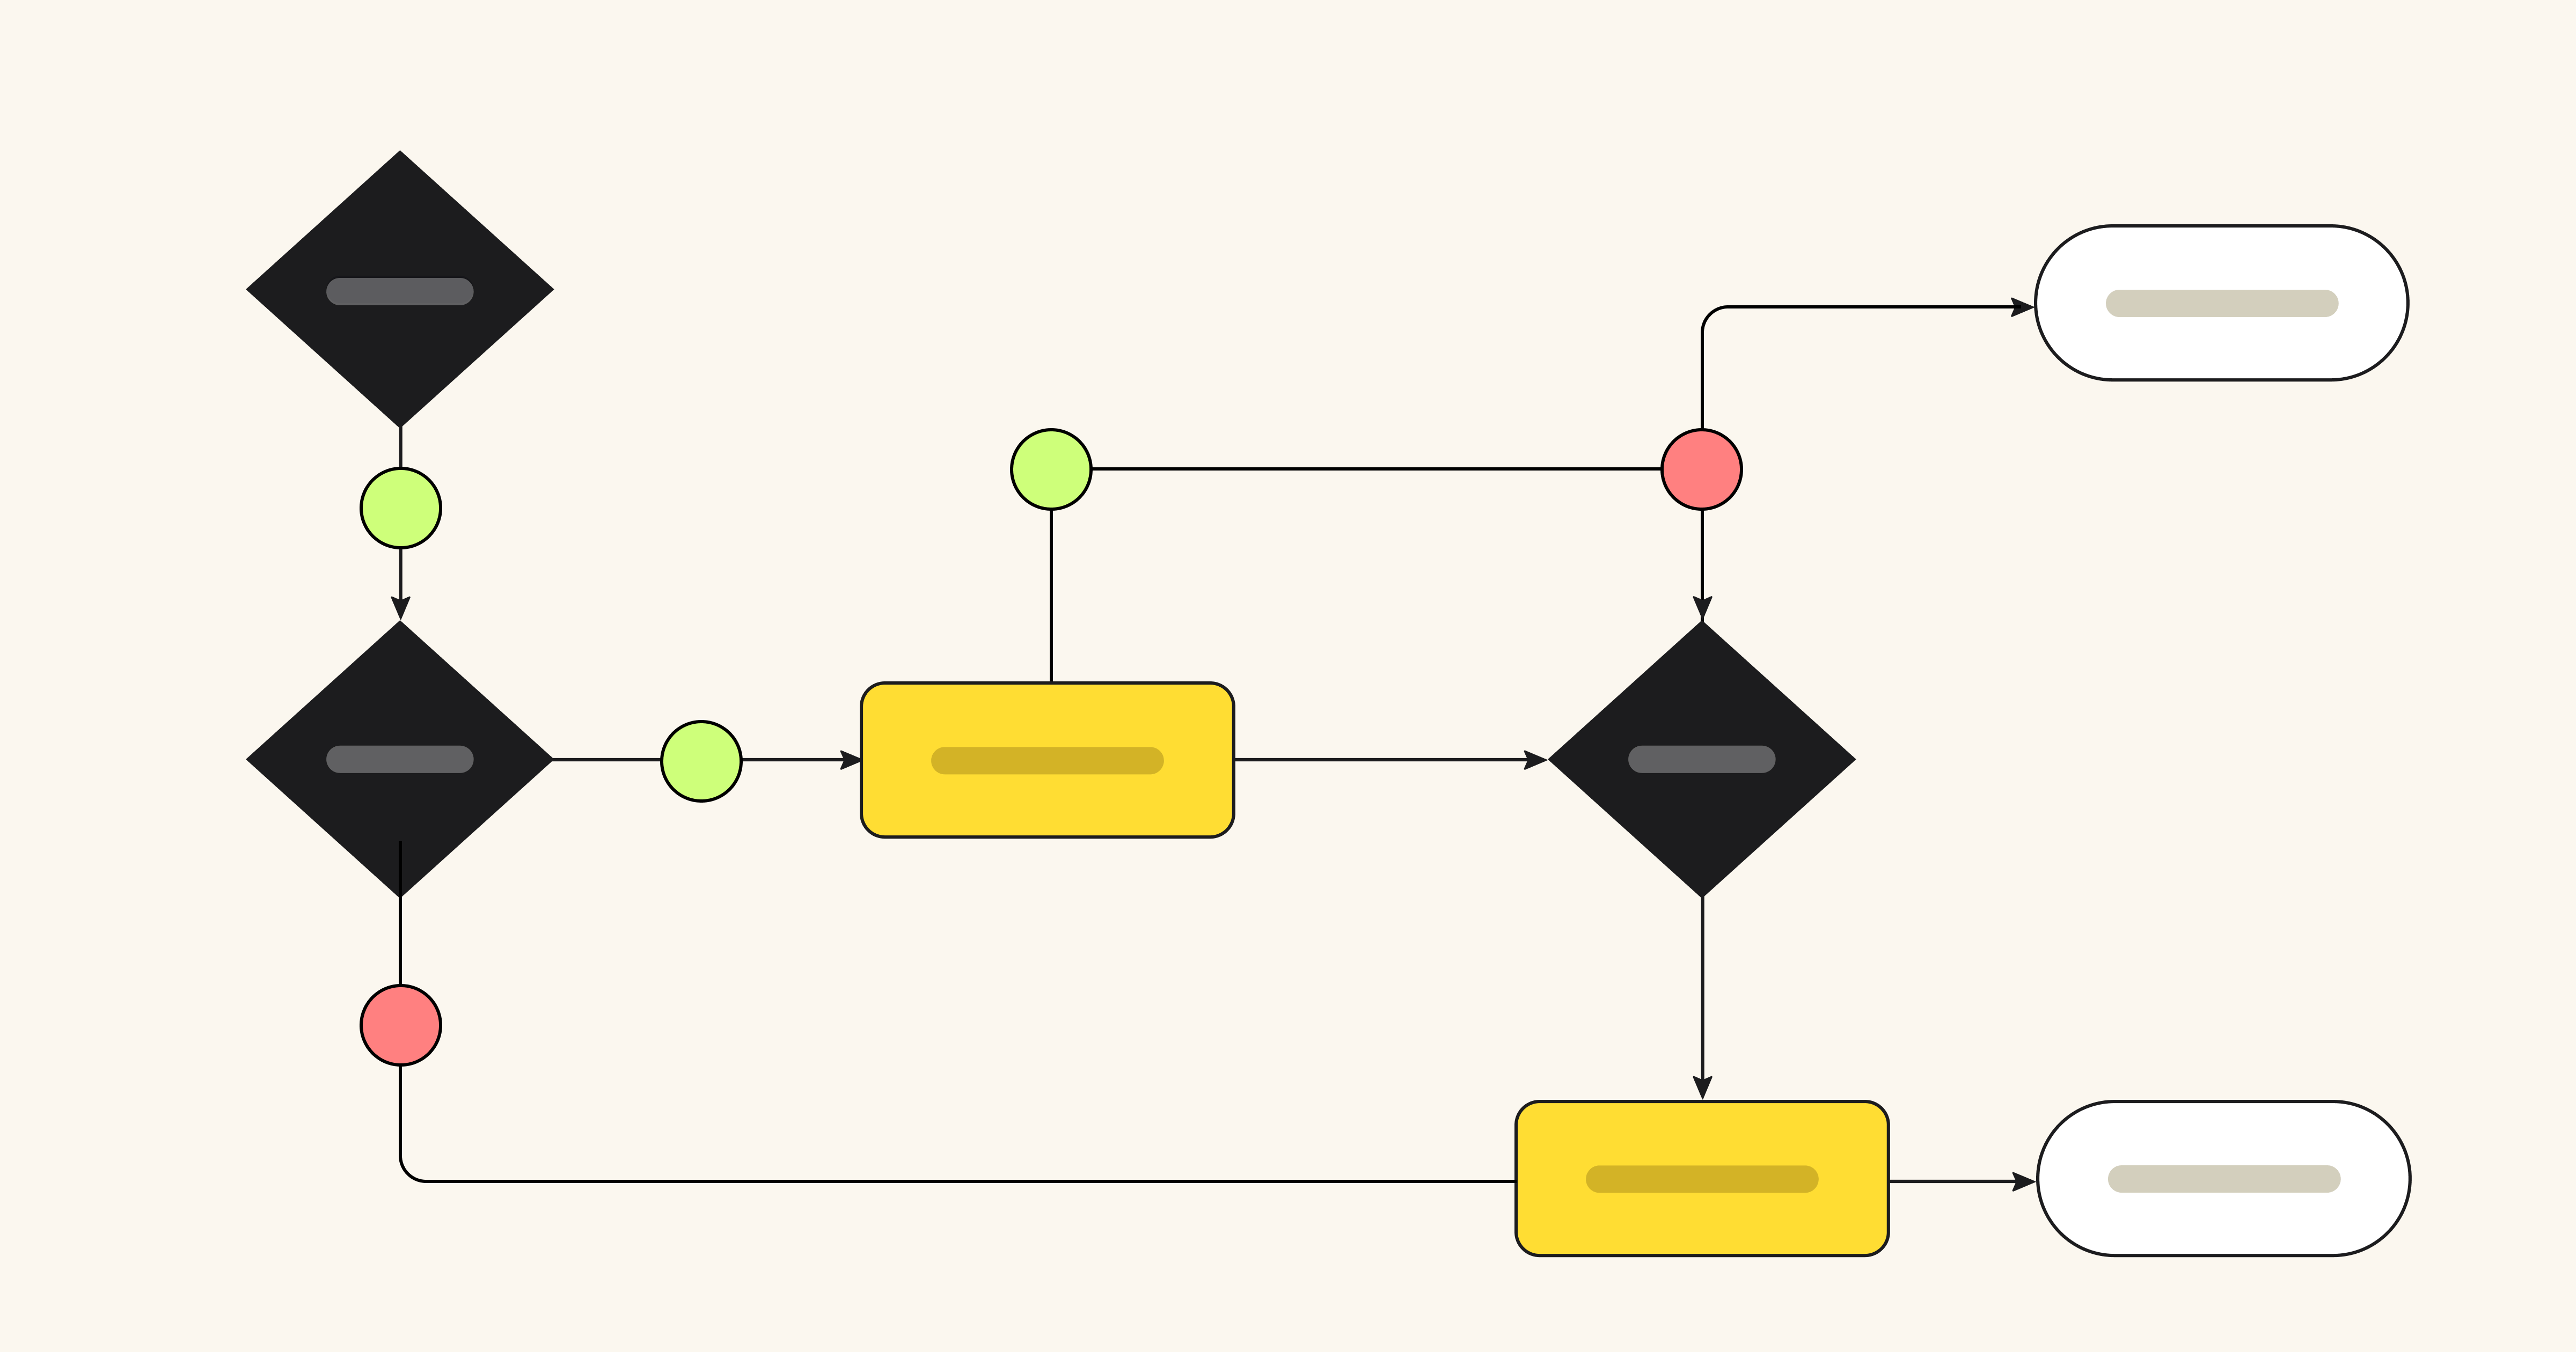
A problem-solving flowchart is a flowchart that helps process improvement, troubleshooting, or decision-making. Flowcharts use shapes, symbols, and connecting arrows to map out a problem or flow. This technique illustrates how many steps are in a process, entry and endpoints, the flow of information and materials, and any branches or decision points.
For example, this problem-solving flowchart template shows how you can use a flowchart to troubleshoot a technical problem. The flow guides users through basic questions and actions to a likely solution.
When to use a flowchart for problem solving
Flowcharts can be useful in several instances:
- When you’re aware of a problem, but aren’t sure of the root cause or the best way to solve it.
- When you want to improve a product or service or specific outcomes, like delivery time.
- When you’re entering a new market and want to create solutions that are a market fit for real customer problems.
You can also explore flowchart templates to visualize and structure your thought process more effectively, helping you identify potential bottlenecks, inefficiencies, or steps in your strategy that need refinement.
The stages of problem solving
To understand how to use flowcharts for problem solving, we’ll use the double diamond design-thinking process. This approach divides problem solving into four stages: discover, define, develop, and deliver. Most people start problem solving in the middle of the diamonds, believing that they know the problem and can start on solutions right away. Instead, you should start even earlier.

https://www.designcouncil.org.uk/our-resources/the-double-diamond
1. Discover
Starting with research helps people understand, rather than simply assume, the problem. Design Council co-founder Jonathan Ball advises, “Go back and ask, ‘Have I been asked to solve the right problem?’”
Problem-solving requests normally come to product or engineering teams from leadership or customers. Statements like “This isn’t selling well” or “This process takes too long” describe pain points, but they’re too vague to form functional solutions.
There are multiple ways to explore the root of a problem:
- Qualitative user research like user interviews
- Quantitative user research like user testing and heatmap tracking
- Workshops, like Upwork’s problem-solving workshop with Miro that led participants through brainstorming, discussing, and voting on top problems to solve
- Flowcharts to illustrate challenges in the “as-is” process.
As-is process mapping
Flowcharts can help solve problems by first mapping out the problematic process. If a process map doesn’t exist, isn’t updated, or hasn’t been well communicated, this is the best starting point.
Ask all teams involved to participate in mapping out the current process. During the process, you may identify bottlenecks or areas of misunderstanding.
2. Define
Next, refine your discovery into a single statement. A problem statement should explain who is affected, their end goal, the challenge, and the impact of the challenge. Here’s an example of a problem statement:
“Users of [software name] encounter frustration when they try to customize a monthly sales report. They are not able to customize the data within the platform reporting, and instead are abandoning the process and exporting raw data to compile outside of the platform. This takes longer, makes it harder for them to reach business goals, and lowers satisfaction with the software.”
You can get to the heart of a problem by asking why solving the problem is important and how the problem originated. Miro’s problem statement template is useful for this exercise.
3. Develop
Once you’ve defined the problem, you’re ready to move to the second diamond — the solution space. Flowcharts are ideal for mapping out potential solutions for testing. Just like an as-is process map, a proposed or to-be process map illustrates how a process should work, showing entry points, decision points, actions, parties, and endpoints.
In the development stage, use testing to reject ideas that don’t work and refine your solution. “The earlier and more often you can prototype and test, the better the outcome will be,” shares Ball.
It’s important to note that changing a process isn’t always the solution to your problems. Simply visualizing it and addressing misplaced expectations can also be a solution.
4. Deliver
Once you ship a solution, your work isn’t done. Communicate the update to users, collect feedback, track outcomes, and commit to continuous improvement.
How to make a visual problem-solving flowchart
Interested in trying your hand at visual problem solving? The specific techniques for visual problem solving are as numerous as there are problems, but below we’ll outline three to get you started. All of them use Miro as their foundation, which allows for collaboration in real time, so you can create effective visuals to guide your process.
1. Cyclical problem-solving process
This structured problem-solving process by Senior UX Designer Marcos Rezende walks teams through eight steps for tackling organizational challenges. It includes identifying the problem, gathering and analyzing data, generating solutions, and implementing them. Because this process is cyclical, it’s valuable for continuous improvement.
2. Cross-functional flowchart
If you’re attempting to solve internal workflow problems, a cross-functional flowchart can help you pinpoint challenges across silos. This template from Hiro Studio walks teams through outlining process steps and their relationships, identifying unnecessary complexity or duplication, and uncovering opportunities for improvement.
Consultant John White explains why this technique is effective: “When we document a process flow, we get everyone on the same page by removing assumptions of what we think is happening, and we document what is actually happening.”
Embed intro video: https://miro.com/miroverse/cross-functional-flowchart/
3. Problem tree
Instead of a traditional flowchart, this technique visualizes a problem as a tree. This visualization approach is designed to give a holistic view of a problem (the tree trunk) with its impacts (branches) and root causes (roots).
Frameworks for decision-making
Beyond flowcharts, visualization can help leaders make better decisions by framing decision criteria in visual form. Here are a few ways you can illustrate your thought process in visual form for more effective decisions.
1. Risk matrix template
This risk matrix template helps leaders visualize the likelihood of adverse events happening by placing them on a matrix from rare to very likely and trivial to extreme.
2. Project scope template
How often do you need to argue that a request is “out of scope”? This simple framework helps you define a project scope at the beginning, so you have a touchstone to return to as a project evolves. This helps to manage goals, increase clarity, and keep projects within timeline and budget.
2. Priority matrix template
When you have competing priorities, deciding how to invest your time and budget is difficult. To determine the best outcomes, use these priority matrix templates to map out initiatives by urgency and importance. This brings agility to your team and keeps your focus on what matters most.
You can find more decision-making visualization templates here.
From visualization to optimization: How visual problem solving leads to innovation
Over a century after its birth, the flowchart remains a valuable tool to help companies approach a problem differently, using visual cues to understand all the moving parts.
With flowcharts and other visual tools, you can:
- Explore and define the right problem to solve
- Map out current processes to pinpoint the root cause of problems
- Propose and test new workflows and solutions
- Visualize a problem at a high level and work through frameworks for better decisions
Visualizing problems helps our brains “see” problems and solutions where we might have otherwise missed a connection. Using problem-solving flowcharts as a tool, you’ll set your teams up for better communication and innovation, too.