
Table of contents
Table of contents
Process improvement methodologies
Summary
In this guide, you'll learn:
- What process improvement methodologies are and why they matter for modern teams dealing with distributed work, unclear handoffs, and inefficient workflows
- Seven proven methodologies — including Lean, Six Sigma, Kaizen, Agile, Kanban, PDCA, and Business Process Reengineering — with clear guidance on when to use each approach
- How to choose the right methodology based on your problem type, organizational readiness, scope of change, and available resources
- How flowcharts accelerate improvement by making processes visible, revealing bottlenecks, and enabling collaborative problem-solving across teams
- Practical implementation with Miro's AI workspace — from AI-powered process mapping to real-time collaboration features that help distributed teams analyze and optimize workflows together
- Real results from companies like Medibank, which compressed their innovation cycle from six months to six weeks by combining structured methodologies with collaborative visual tools
- Common mistakes to avoid — including skipping root cause analysis, ignoring the people side of change, and measuring the wrong metrics
Collaborative AI Workflows
Join thousands of teams using Miro to build the right thing, faster.
Delivering products on time and on budget shouldn't feel like an uphill battle. But when teams rely on scattered tools, unclear processes, and endless status meetings, even simple projects drag on for months.
The reality? Most teams waste significant time on inefficient workflows. Research shows that poorly facilitated meetings alone cost organizations thousands of hours annually. Add unclear handoffs, duplicated work, and communication gaps, and you're looking at serious productivity drain.
Process improvement methodologies help teams identify these bottlenecks and build workflows that actually work. Instead of guessing where things go wrong, these structured approaches give you a clear framework to analyze, optimize, and standardize how work gets done.
In this guide, we'll walk through the most effective process improvement methodologies — from Lean and Six Sigma to Agile and Kanban — and show you how to apply them using Miro's AI-powered innovation workspace.
What are process improvement methodologies?
Process improvement methodologies are structured frameworks that help teams systematically analyze and optimize their workflows. Rather than making random changes and hoping for better results, these methodologies provide a repeatable approach to identifying inefficiencies, testing solutions, and measuring outcomes.
Think of them as your roadmap for getting from "this process is broken" to "this process consistently delivers results."
At their core, these methodologies share a few common principles:
- Data-driven decision making: Instead of relying on hunches, you analyze real metrics to understand where problems exist and whether your changes actually help.
- Continuous improvement: Process optimization isn't a one-time project — it's an ongoing practice of identifying opportunities and incrementally making things better.
- Systematic approach: Each methodology provides specific steps and tools, so teams can follow a proven path rather than reinventing the wheel.
- Focus on value: The goal isn't just efficiency for efficiency's sake — it's about delivering more value to customers while reducing waste and friction.
Different methodologies emphasize different aspects. Six Sigma focuses heavily on reducing variation and defects. Lean prioritizes eliminating waste. Agile emphasizes adaptability and customer feedback. But they all aim to help teams work smarter, not harder.
Why process improvement matters now
The stakes for process efficiency have never been higher. Teams face pressure to ship faster, collaborate across time zones, and adapt to constantly changing requirements. Legacy processes designed for in-person teams don't translate well to distributed work. Manual handoffs create delays. Lack of visibility leads to duplicated effort.
Process improvement methodologies give teams a structured way to address these challenges. Instead of accepting "that's just how we do things," teams can question assumptions, experiment with new approaches, and build workflows that scale.
Key process improvement methodologies explained
Let's explore the most widely-used process improvement methodologies and when each one makes sense for your team.
Lean methodology: Eliminate waste, maximize value
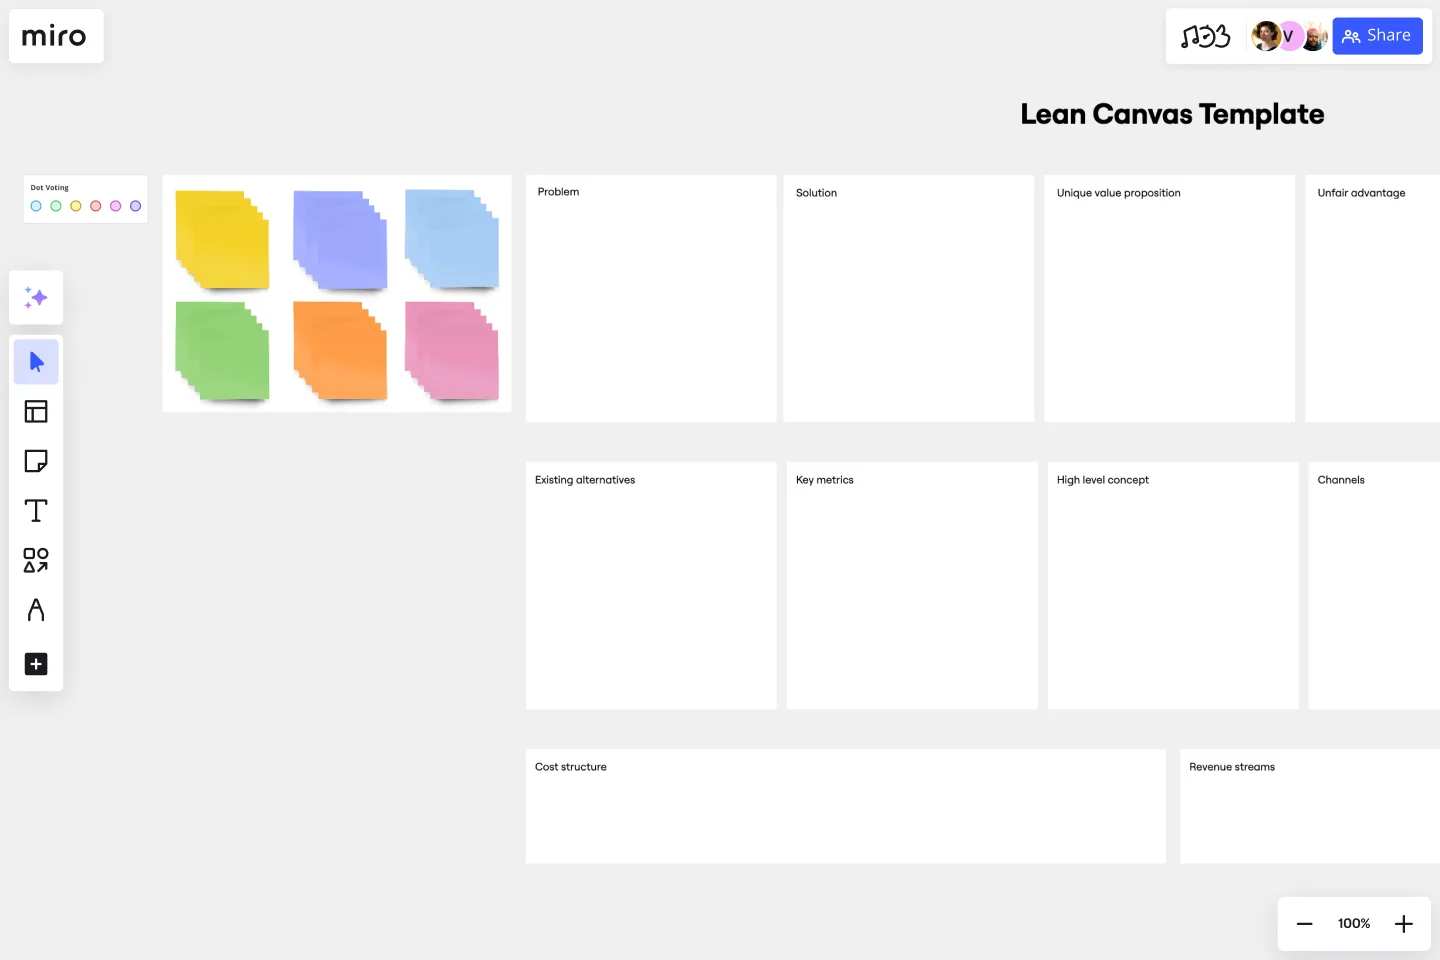
Lean originated in manufacturing but has become one of the most versatile process improvement approaches. The core philosophy? Eliminate anything that doesn't add value for the customer.
Lean identifies seven types of waste to target:
- Overproduction: Creating more than needed or before it's needed
- Waiting: Idle time between process steps
- Transportation: Unnecessary movement of materials or information
- Over-processing: Doing more work than the customer requires
- Inventory: Excess stock or work-in-progress piling up
- Motion: Inefficient movement of people or equipment
- Defects: Rework caused by errors or quality issues
When to use Lean: This methodology works well when you're dealing with complex workflows that have accumulated inefficiencies over time. It's particularly effective for cross-functional processes where work moves between different teams or systems.
For example, a product team might use Lean to streamline their feature development process by identifying handoff delays between design, engineering, and QA. By mapping the current workflow visually on a Miro board, they can spot wait times, redundant approval steps, and information gaps that slow down delivery.
With Miro's AI feature, teams can generate process maps quickly by describing their workflow, then use those maps to identify waste and test improvements.
Six Sigma: Reduce variation, improve quality
Six Sigma takes a rigorous, data-driven approach to process improvement. The goal is reducing variation in your processes so you consistently deliver high-quality outcomes.
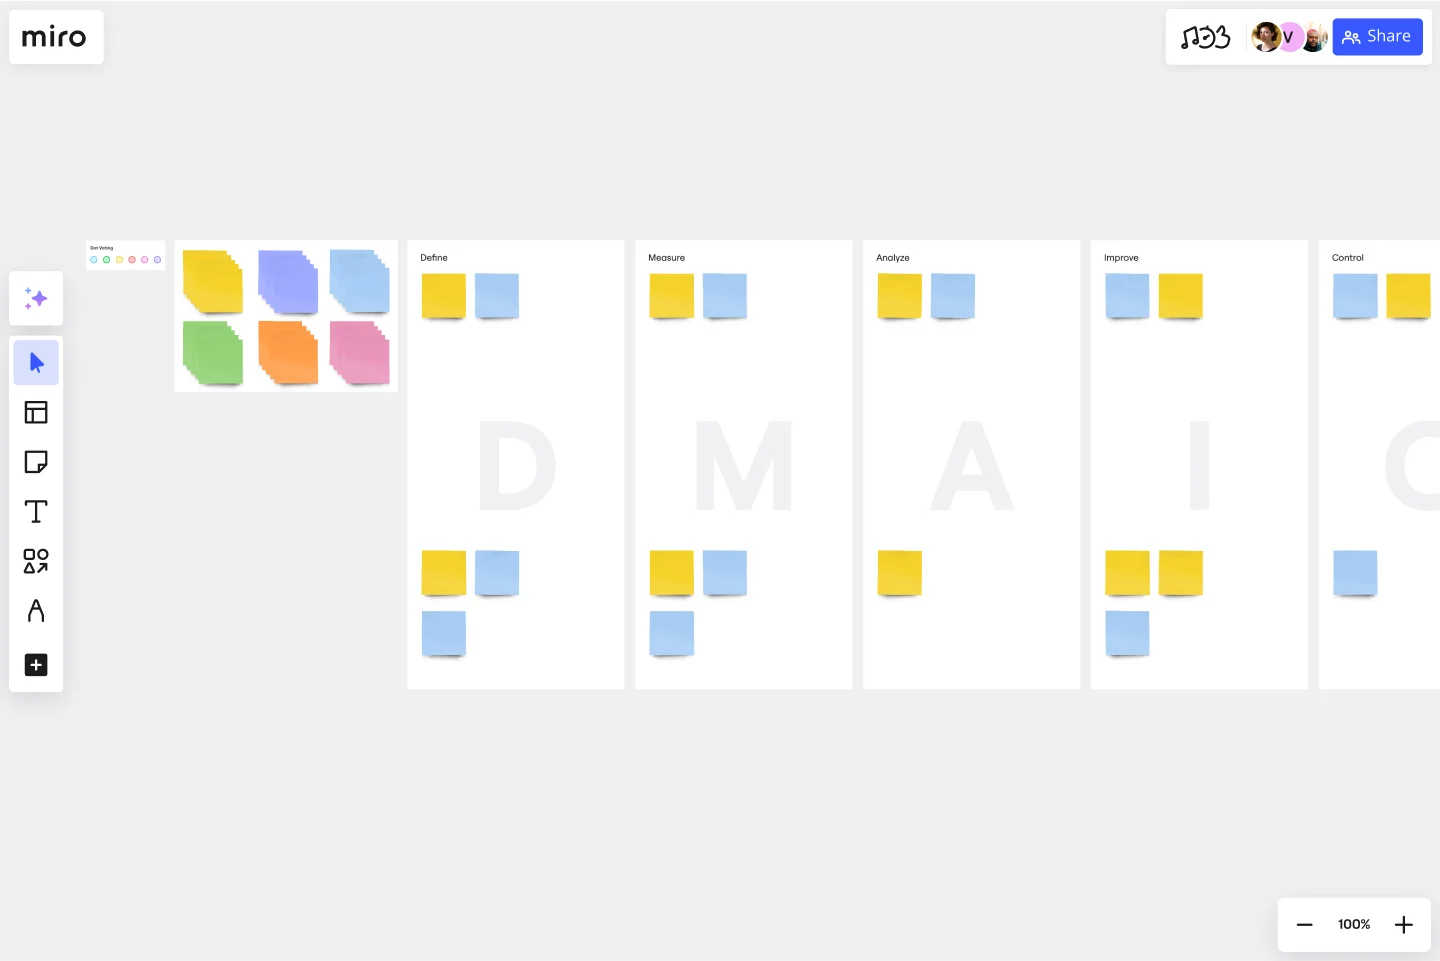
The methodology follows the DMAIC framework:
- Define: Clearly articulate the problem and goals
- Measure: Collect baseline data on current performance
- Analyze: Identify root causes of defects or variation
- Improve: Implement and test solutions
- Control: Monitor results and sustain improvements
Six Sigma uses statistical tools to understand process capability and pinpoint where defects occur. Teams aim for "six sigma" quality — meaning 99.99966% of outputs are defect-free.
When to use Six Sigma: This approach works best when quality consistency matters and you have quantifiable metrics to track. It's commonly used in manufacturing, healthcare, and financial services where errors have serious consequences.
A customer support team might use Six Sigma to reduce ticket resolution time variability. By measuring current performance, analyzing why some tickets take much longer than others, and implementing targeted improvements, they can create a more predictable experience for customers.
Miro's tables and diagrams make it easy to organize Six Sigma data and create visual representations of your DMAIC process, keeping all stakeholders aligned on goals and progress.
Kaizen: Small changes, big impact
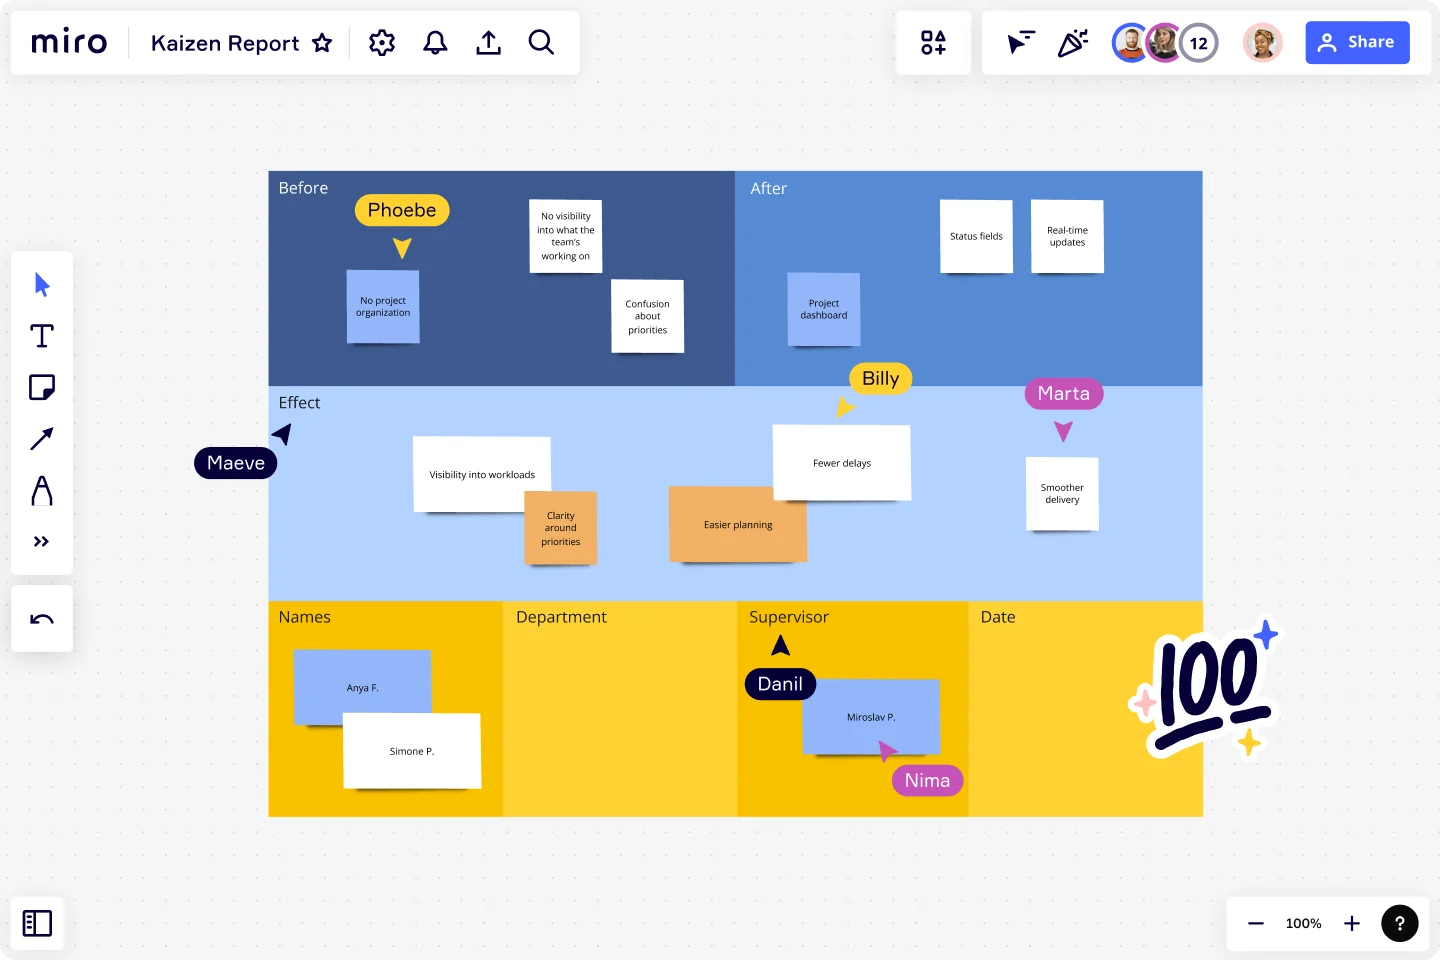
Kaizen is a Japanese term meaning "continuous improvement." Unlike methodologies that focus on major overhauls, Kaizen emphasizes making small, incremental improvements consistently over time.
The philosophy: everyone in the organization should actively look for ways to improve processes. Rather than waiting for leadership to drive change, team members suggest and implement small optimizations in their daily work.
Key principles of Kaizen:
- Changes should be small and manageable
- Improvements come from those closest to the work
- Focus on quick experiments rather than lengthy planning
- Measure results and iterate based on what you learn
When to use Kaizen: This methodology works well for teams looking to build a culture of continuous improvement without disrupting operations. It's particularly effective when you want to engage front-line employees in problem-solving.
An engineering team might run weekly Kaizen sessions where developers share small improvements they've made to their build process, testing approach, or code review workflow. Over time, these incremental changes compound into significant efficiency gains.
Miro's sticky notes and voting features make Kaizen sessions interactive and collaborative. Teams can quickly capture improvement ideas, prioritize them together, and track which experiments to try next.
Total Quality Management (TQM): Organization-wide excellence
Total Quality Management takes a holistic approach to process improvement by involving every level of the organization in quality initiatives. Rather than limiting improvement efforts to specific teams or processes, TQM embeds quality focus throughout the company culture.
Core principles of TQM:
- Customer focus drives all decisions
- Everyone participates in improvement efforts
- Process-centered thinking replaces individual blame
- Strategic approach aligns improvements with business goals
- Continuous improvement becomes part of daily operations
- Fact-based decision making guides priorities
When to use TQM: This methodology makes sense when you need cultural transformation, not just process tweaks. It requires commitment from leadership and works best when quality issues affect multiple departments.
A SaaS company struggling with customer churn might implement TQM by involving product, engineering, support, and sales teams in understanding quality issues from the customer perspective. Instead of treating symptoms in isolation, they address systemic problems together.
Miro provides a shared workspace where cross-functional teams can collaborate on TQM initiatives, from customer journey mapping to root cause analysis to solution brainstorming — all with AI assistance to accelerate the process.
Agile methodology: Adapt and iterate
Agile flips traditional project management on its head. Instead of detailed upfront planning and rigid execution, Agile teams work in short cycles, gathering feedback and adapting as they go.
Agile values:
- Individuals and interactions over processes and tools
- Working solutions over comprehensive documentation
- Customer collaboration over contract negotiation
- Responding to change over following a plan
Agile methodologies like Scrum and Kanban (covered separately below) provide frameworks for implementing these values. Teams break work into small increments, deliver frequently, and adjust priorities based on what they learn.
When to use Agile: This approach works well when requirements are uncertain or likely to change, when you need to deliver value quickly, and when customer feedback should shape your direction.
Product development teams commonly use Agile to balance speed with quality. Rather than spending months building a complete product based on assumptions, they release minimum viable versions, gather user feedback, and iterate rapidly.
Miro's AI-powered sticky notes help Agile teams generate ideas during sprint planning and retrospectives. The platform supports real-time collaboration across distributed teams, so everyone can participate regardless of location.
Kanban: Visualize work, limit work-in-progress
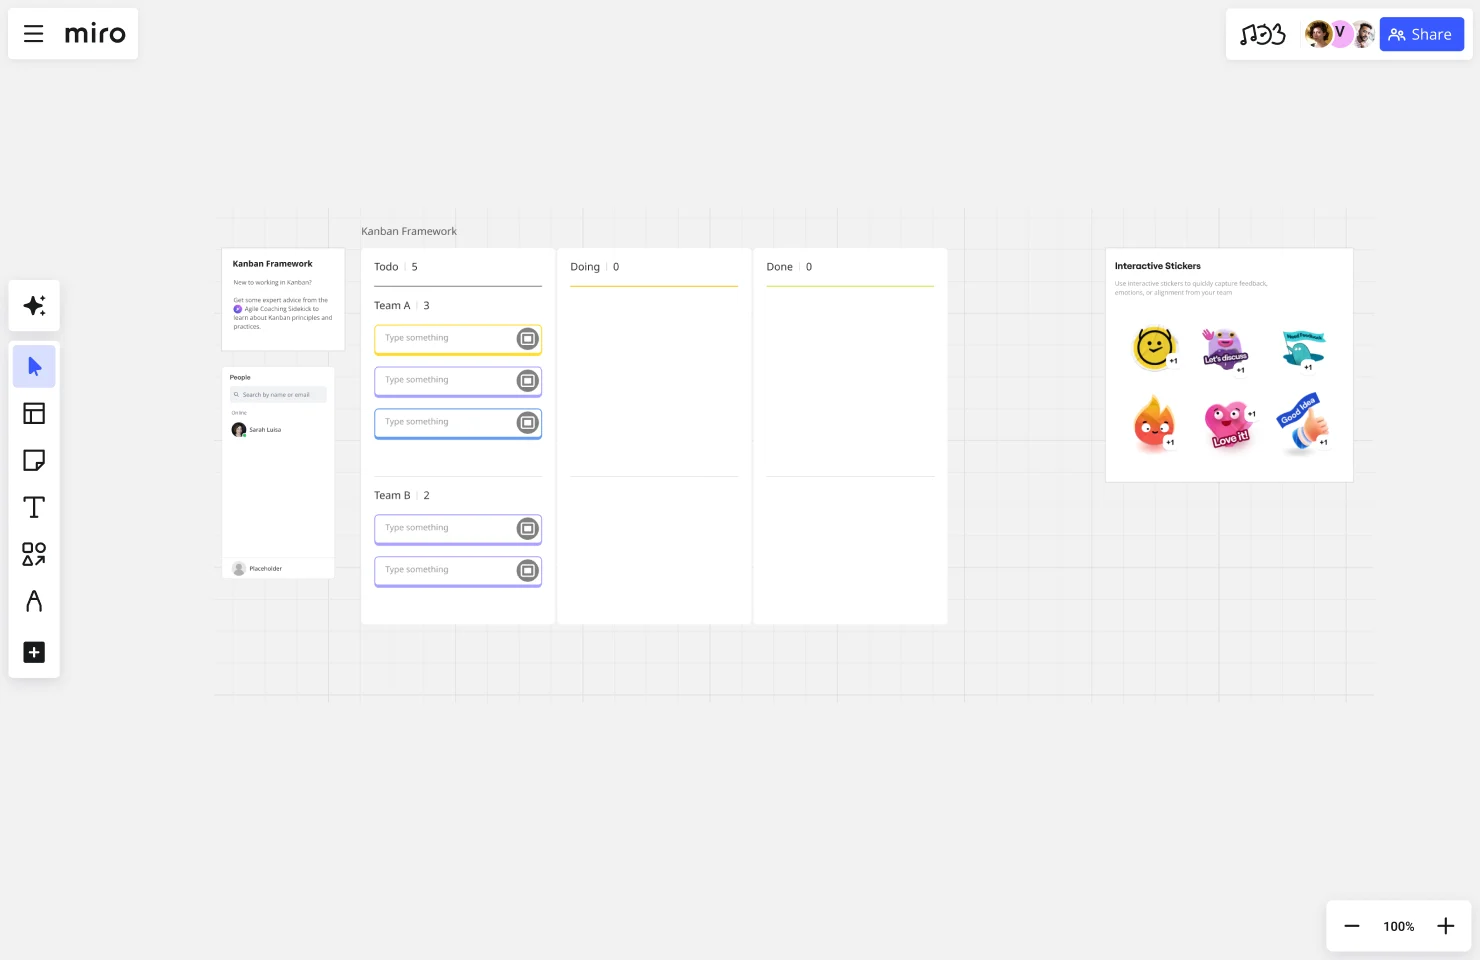
Kanban is a visual workflow management method that helps teams see their work, identify bottlenecks, and improve flow. Originally developed for manufacturing, it's now widely used in knowledge work.
A Kanban board has columns representing workflow stages (like "To Do," "In Progress," "Review," and "Done"). Work items move across columns as they progress. The key insight: limiting how many items can be "in progress" at once prevents overload and exposes where work gets stuck.
Core Kanban practices:
- Visualize the workflow so everyone sees what's happening
- Limit work-in-progress to prevent multitasking and context switching
- Manage flow by identifying and removing bottlenecks
- Make process policies explicit so the team knows how work moves
- Continuously improve through regular reflection
When to use Kanban: This methodology works well for teams with continuous incoming work (rather than project-based work), teams that need flexibility to shift priorities, and teams looking to improve flow without major process changes.
A marketing team might use Kanban to manage content production. By visualizing all content pieces moving through ideation, writing, design, review, and publishing stages, they can spot where work piles up and adjust capacity accordingly.
Miro's Kanban board templates provide a ready-made structure that teams can customize. With Miro AI, you can even generate an initial board setup based on your workflow description, then refine it with your team.
PDCA (Plan-Do-Check-Act): The continuous improvement cycle
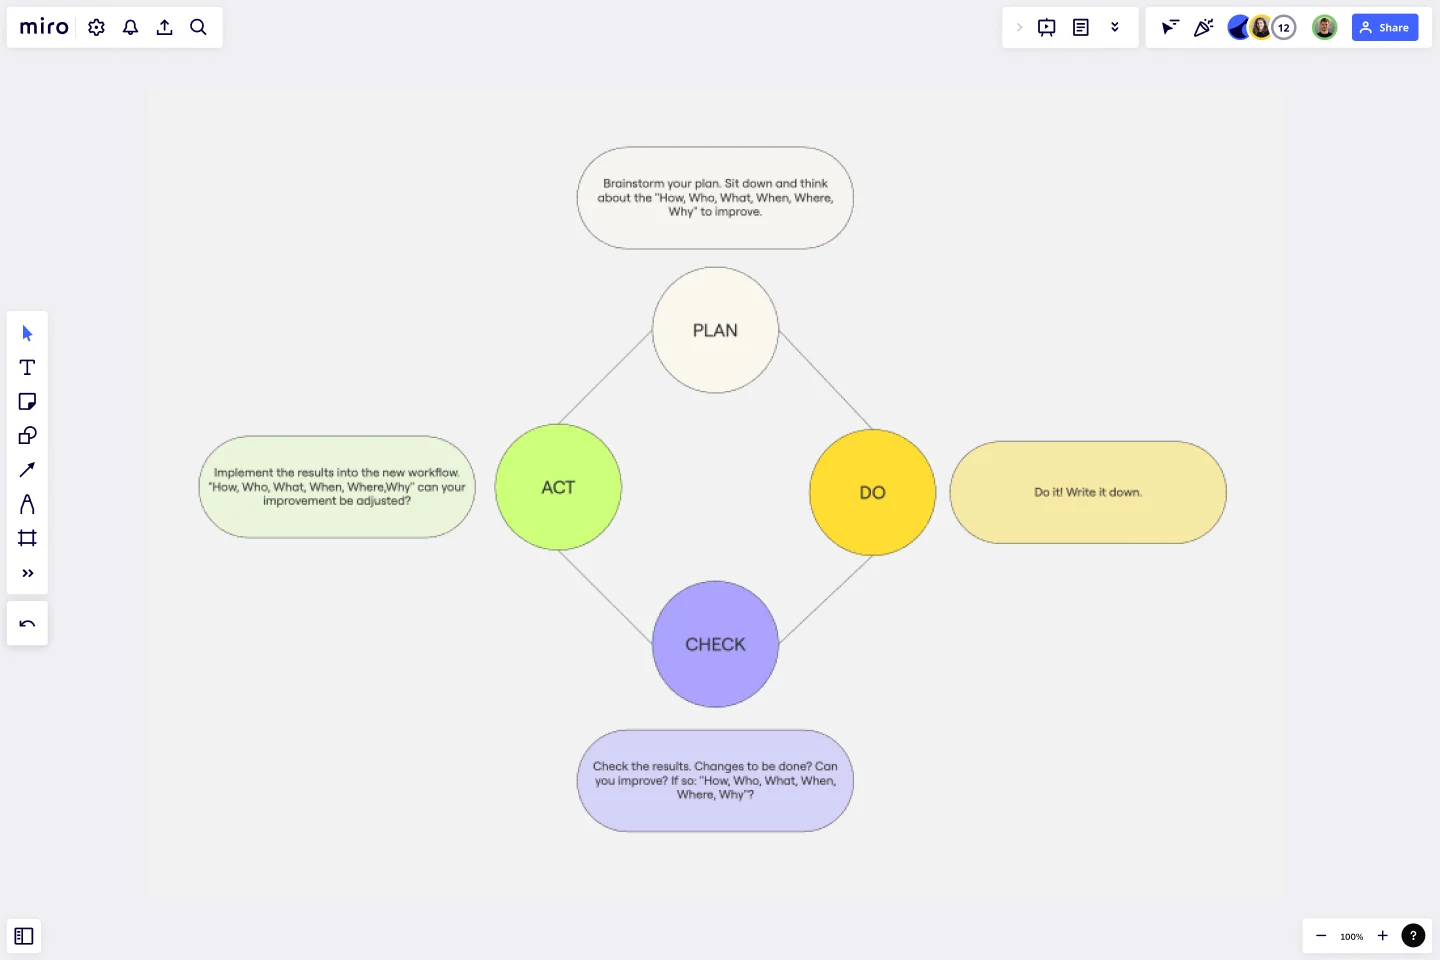
PDCA is a four-step iterative cycle for process improvement. It's simple enough for quick experiments but rigorous enough for complex process changes.
The four stages:
- Plan: Identify the problem, analyze root causes, and develop a hypothesis for improvement
- Do: Implement the change on a small scale as a test
- Check: Measure results and compare them to your hypothesis
- Act: If successful, standardize the change; if not, adjust and try again
The cycle then repeats, with each iteration building on what you learned. This approach reduces risk by testing changes before full implementation and ensures you're learning from both successes and failures.
When to use PDCA: This methodology works well when you want a lightweight framework for experimentation, when you're dealing with problems that don't have obvious solutions, and when you want to build a habit of testing assumptions rather than implementing hunches.
An operations team might use PDCA to improve their incident response process. They plan a new escalation procedure, test it during a few incidents, check whether it reduced resolution time, and either adopt it permanently or adjust based on results.
Miro's documentation features help teams track each PDCA cycle, capturing plans, test results, and learnings in one place so knowledge builds over time.
Business Process Reengineering (BPR): Radical redesign
While most methodologies focus on incremental improvement, Business Process Reengineering takes a dramatic approach: completely rethinking processes from scratch.
BPR asks "If we were starting fresh today, how would we design this process?" rather than "How can we optimize what we have?" This often leads to fundamental changes in how work gets done.
BPR principles:
- Start with desired outcomes, not existing processes
- Challenge all assumptions about how work should flow
- Leverage technology to enable new ways of working
- Organize around results, not tasks or departments
- Accept significant change rather than incremental tweaks
When to use BPR: This methodology makes sense when existing processes are fundamentally broken, when incremental improvements haven't worked, or when major shifts (like digital transformation or organizational restructuring) create opportunities for radical change.
A company moving from in-person to distributed work might use BPR to completely redesign their product development process rather than just adapting old workflows to video calls. This could mean rethinking meeting cadences, decision-making authority, documentation practices, and collaboration tools.
Miro serves as the ideal workspace for BPR initiatives. Teams can map current processes, envision ideal future states, identify gaps, and design entirely new workflows — all collaboratively and visually. Miro's AI capabilities can generate initial process maps and suggest alternative approaches based on your goals.
How to choose the right process improvement methodology
With so many methodologies available, how do you pick the right one? The answer depends on your goals, constraints, and organizational context.
Consider these factors:
Problem type: Are you dealing with quality issues (Six Sigma), waste and inefficiency (Lean), rigid processes that can't adapt (Agile), or fundamentally broken workflows (BPR)?
Scope of change: Do you need incremental improvements (Kaizen, PDCA) or radical transformation (BPR)?
Organizational readiness: Does your culture support data-driven decision making (Six Sigma, TQM)? Are employees empowered to suggest improvements (Kaizen)?
Resources available: Do you have time and budget for extensive training and analysis (Six Sigma), or do you need a lightweight approach (PDCA, Kanban)?
Measurement capability: Can you quantify process performance with clear metrics (Six Sigma), or are outcomes harder to measure (Agile)?
The good news: you don't have to pick just one. Many teams combine methodologies based on what they're trying to improve. You might use Kanban to manage daily workflow while running PDCA experiments to test process changes and applying Lean principles to eliminate waste.
The key is starting with a clear understanding of what problem you're solving, then selecting the methodology (or combination of methodologies) that best addresses that problem.
Process improvement with Miro's AI-powered workspace
Process improvement requires collaboration, visualization, and iteration. Miro provides an innovation workspace designed specifically for these needs, combining a flexible canvas with AI capabilities that accelerate every step of the improvement journey.
Map current processes visually
Before you can improve a process, you need to understand how it currently works. Miro makes it easy to document existing workflows through visual process mapping.
With Miro AI, you can describe your process in plain language and generate an initial process map automatically. From there, teams can refine the map collaboratively, adding detail and identifying pain points. This visual representation makes it much easier to spot inefficiencies, redundancies, and bottlenecks that are hard to see in written documentation.
Miro supports multiple process mapping formats — flowcharts, swimlane diagrams, value stream maps, and more — so you can choose the visualization that works best for your specific process.
Collaborate across distributed teams
Process improvement isn't a solo activity. You need input from everyone involved in the work — product managers, designers, engineers, operations, and more.
Miro's real-time collaboration features keep distributed teams aligned. Multiple people can work on the same board simultaneously, whether they're brainstorming improvement ideas, analyzing root causes, or designing new workflows. The platform supports both synchronous workshops and asynchronous contribution, so teams can collaborate effectively across time zones.
AI-powered sticky notes can generate additional ideas during brainstorming sessions, helping teams think beyond their initial assumptions. This is particularly useful during Kaizen sessions or when using the "Improve" phase of PDCA.
Experiment and iterate quickly
Process improvement requires testing changes before full implementation. Miro makes experimentation fast and low-risk.
Teams can create multiple versions of a process map to compare options, document test results directly on the board, and track which changes delivered the expected results. The visual format makes it easy to communicate proposed changes to stakeholders and gather feedback before committing resources.
For teams using Agile methodologies, Miro's sprint planning and retrospective templates provide structure while remaining flexible enough to adapt to your specific practices.
Standardize and scale improvements
Once you've identified successful improvements, you need to standardize them across the organization. Miro helps with this through templates and documentation features.
Teams can convert their optimized processes into reusable templates that other teams can adapt. This accelerates the spread of best practices without forcing rigid standardization that ignores context differences.
For organizations implementing TQM or other company-wide improvement initiatives, Miro provides a central workspace where progress is visible to everyone. Leadership can see improvement initiatives across departments, identify patterns, and allocate resources where they'll have the most impact.
Customer success: How Medibank compressed innovation from six months to six weeks
Medibank, Australia's largest health insurer, faced a common challenge: innovation cycles that stretched for months. Their Digital Labs team was tackling complex problems across multiple business units, but concept development could take up to six months before achieving stakeholder alignment.
The breaking point came when they needed to reimagine medibank.com.au — their primary digital sales channel — requiring input from over 80 stakeholders across the enterprise, including senior executives with packed calendars.
The traditional approach would have taken six months. Using Miro, they did it in six weeks.
Using Miro's collaborative workspace, the team captured over 140 pain points and use cases across the business in a single living board. Instead of lengthy review cycles, senior executives could see the complete picture and prioritize in real time during focused sessions.
As Ben Abbott, Product Leader at Medibank Digital Labs, explains: "When everyone's solving the same problem, in the same space, at the same time — that's when the magic happens. That's how six weeks becomes not just possible, but repeatable."
The impact extended beyond speed. With AI-powered clustering, tagging, and summarizing, tasks that previously consumed entire days became click-and-validate exercises. Teams shifted from administrative work to strategic thinking, using AI to transform brainstorming sessions into actionable product briefs.
"With AI-powered clustering, tagging and summarizing, it's now a click-and-validate process. Our teams can shift from admin to insight, and use that time for deeper thinking," Abbott notes.
Medibank's experience demonstrates how combining collaborative tools with AI capabilities amplifies process improvement results. Real-time co-creation eliminated back-and-forth cycles, while AI features helped teams explore solution possibilities they might have missed, creating richer, more comprehensive outcomes.
Learn more about Medibank's transformation
Common process improvement mistakes to avoid
Even with a solid methodology, process improvement initiatives can fail. Watch out for these common pitfalls:
Skipping the analysis phase: Jumping straight to solutions without understanding root causes leads to surface-level fixes that don't address underlying problems. Take time to map the current process and identify where breakdowns actually occur.
Ignoring the people side: Process changes affect how people work daily. If you don't involve the team in designing improvements and address their concerns, resistance will undermine even well-designed changes.
Over-complicating the process: Adding steps, approvals, and documentation in the name of "improvement" often makes things worse. The goal is simpler, more effective workflows — not more elaborate ones.
Measuring the wrong things: Optimizing for metrics that don't actually matter creates perverse incentives. Make sure your measurements align with real value delivery, not just activity or output.
Lack of follow-through: Process improvement requires ongoing attention. Teams that implement changes but never check results or iterate based on learnings rarely see lasting improvement.
Trying to fix everything at once: Starting with too broad a scope leads to analysis paralysis and delayed results. Focus on one process or bottleneck, improve it, then move to the next opportunity.
By combining a solid methodology with collaborative tools like Miro, teams can avoid these mistakes and build a sustainable practice of continuous improvement.
Flowcharts: Your visual guide to process improvement
While methodologies provide the framework, flowcharts provide the visibility. These visual diagrams map out process steps, decision points, and workflows in a way that's immediately understandable to everyone involved.
Flowcharts serve as the foundation for most process improvement work because they:
- Reveal the current state: You can't improve what you can't see. Flowcharts document how work actually flows today, not how you think it should flow.
- Identify bottlenecks and waste: Visual representation makes it obvious where work gets stuck, where handoffs are unclear, and where unnecessary steps add friction.
- Enable collaborative problem-solving: When everyone can see the same process map, conversations shift from abstract complaints to concrete improvement opportunities.
- Test proposed changes: Before implementing a new process, teams can map it out visually and walk through scenarios to spot potential issues.
Types of flowcharts for process improvement
Different flowchart formats serve different purposes in process improvement work:
Standard flowcharts show the sequence of steps in a process using shapes like rectangles (actions), diamonds (decisions), and arrows (flow). They work well for documenting linear processes or decision trees.
Swimlane diagrams organize process steps by role or department, making it clear who's responsible for each action. These are particularly useful for cross-functional processes where work moves between teams. Swimlane diagrams quickly reveal handoff delays and unclear responsibilities.
Value stream maps (used in Lean methodology) track both information flow and material flow, distinguishing between value-adding activities and waste. These diagrams help identify where time is spent vs. where value is created.
SIPOC diagrams (Suppliers, Inputs, Process, Outputs, Customers) provide a high-level process overview before diving into details. They help teams ensure they're optimizing the right scope and considering all stakeholders.
Creating effective process flowcharts
A useful flowchart balances detail with clarity. Here's how to create flowcharts that actually drive improvement:
Start with the problem scope: Don't try to map your entire operation at once. Focus on the specific process you're trying to improve — whether that's customer onboarding, feature deployment, or content approval.
Document the current state first: Resist the urge to map the "ideal" process. Instead, document how work actually flows today, including workarounds and unofficial steps. This honest assessment reveals where real problems exist.
Involve the people doing the work: The team members who execute the process daily have insights that leadership misses. Collaborative flowcharting sessions surface these frontline perspectives.
Use consistent notation: Standardize your symbols and formatting so flowcharts are easy to read. Most teams adopt BPMN (Business Process Model and Notation) standards or create their own simple conventions.
Test the map by walking through scenarios: Once you've created a flowchart, walk through real examples to verify accuracy. Do all paths make sense? Are there missing decision points?
With Miro's Create with AI, you can jumpstart this process by describing your workflow in plain language and generating an initial flowchart automatically. Teams can then refine and validate the map collaboratively.
Using flowcharts with specific methodologies
Flowcharts support different methodologies in specific ways:
For Lean: Create current-state and future-state flowcharts to identify waste elimination opportunities. Mark non-value-adding steps in a different color to visualize improvement potential.
For Six Sigma: Use flowcharts during the "Measure" and "Analyze" phases of DMAIC to document where variation and defects occur. Add data to each process step showing cycle time, defect rates, or other relevant metrics.
For Kaizen: Start each improvement session by reviewing the current process flowchart, then capture suggested changes directly on the diagram. Track which incremental changes get implemented over time.
For Agile: Map your workflow as a Kanban-style flowchart showing work stages and work-in-progress limits. Update the flowchart as the team's process evolves through retrospectives.
For BPR: Create flowcharts of the current "as-is" process and completely redesigned "to-be" process side by side. The comparison reveals how radical your changes are and helps communicate the transformation vision.
Start improving your processes today
Process improvement doesn't have to be complicated. Start with one workflow that's causing frustration, pick a methodology that fits your situation, and begin visualizing and optimizing together as a team.
Miro's AI-powered innovation workspace gives you the tools to implement any process improvement methodology — from initial process mapping through collaborative problem-solving to standardization and scaling.
Ready to build better processes? Sign up for a free Miro account and access hundreds of templates for process mapping, Lean analysis, Six Sigma projects, Agile planning, and more. With AI-assisted creation and real-time collaboration, you'll spot improvement opportunities and implement changes faster than ever.
Frequently asked questions about process improvement methodologies
What's the best process improvement methodology?
There's no single "best" methodology — it depends on your specific situation. Six Sigma works well for reducing defects and variation. Lean excels at eliminating waste. Agile and Kanban help teams adapt quickly. Many organizations combine methodologies based on what they're trying to improve.
How do I get started with process improvement if I'm new to these methodologies?
Start simple: pick one problematic process, map how it currently works using a flowchart, and involve the team in identifying the biggest pain points. Then choose a lightweight methodology like PDCA or Kaizen to test improvements. As you build competence, you can adopt more sophisticated approaches.
Do I need special certification to use these methodologies?
While certifications like Six Sigma Black Belt add credibility and deep expertise, you don't need formal certification to apply basic principles. Most teams see significant improvement by using these methodologies at a practical level without extensive training.
How long does process improvement take?
It depends on scope and methodology. PDCA cycles might take days or weeks. Kaizen produces quick wins continuously. Six Sigma projects typically run 3-6 months. BPR initiatives might take a year or more. The key is starting with manageable scope and building momentum through early wins.
Can small teams benefit from process improvement methodologies, or are they just for large organizations?
Small teams often benefit more quickly because they have fewer people to align and can implement changes faster. Methodologies like Kanban, Lean, and PDCA scale perfectly to teams of any size. Even a two-person team can map their workflow and identify improvements.
How do I measure whether process improvements are actually working?
Define clear metrics before implementing changes. Depending on your process, you might measure cycle time, defect rates, customer satisfaction, throughput, or cost per transaction. Track these metrics before and after changes to quantify impact. Qualitative feedback from team members also matters — are people finding the new process easier?
What if my team resists process changes?
Resistance usually signals that people don't understand why change is needed or don't feel involved in designing solutions. Address this by clearly communicating the problem, involving the team in mapping current issues, and co-creating improvements rather than imposing them top-down. Start with small, low-risk changes to build trust.
How does Miro specifically support process improvement compared to other tools?
Miro combines visual collaboration with AI capabilities specifically designed for process work. You can map processes visually, collaborate in real-time with distributed teams, generate initial diagrams with AI, test multiple scenarios, and create reusable templates. The platform supports every methodology covered in this guide through flexible templates and intuitive diagramming.
Author: Miro Team
Last update: December 16, 2025