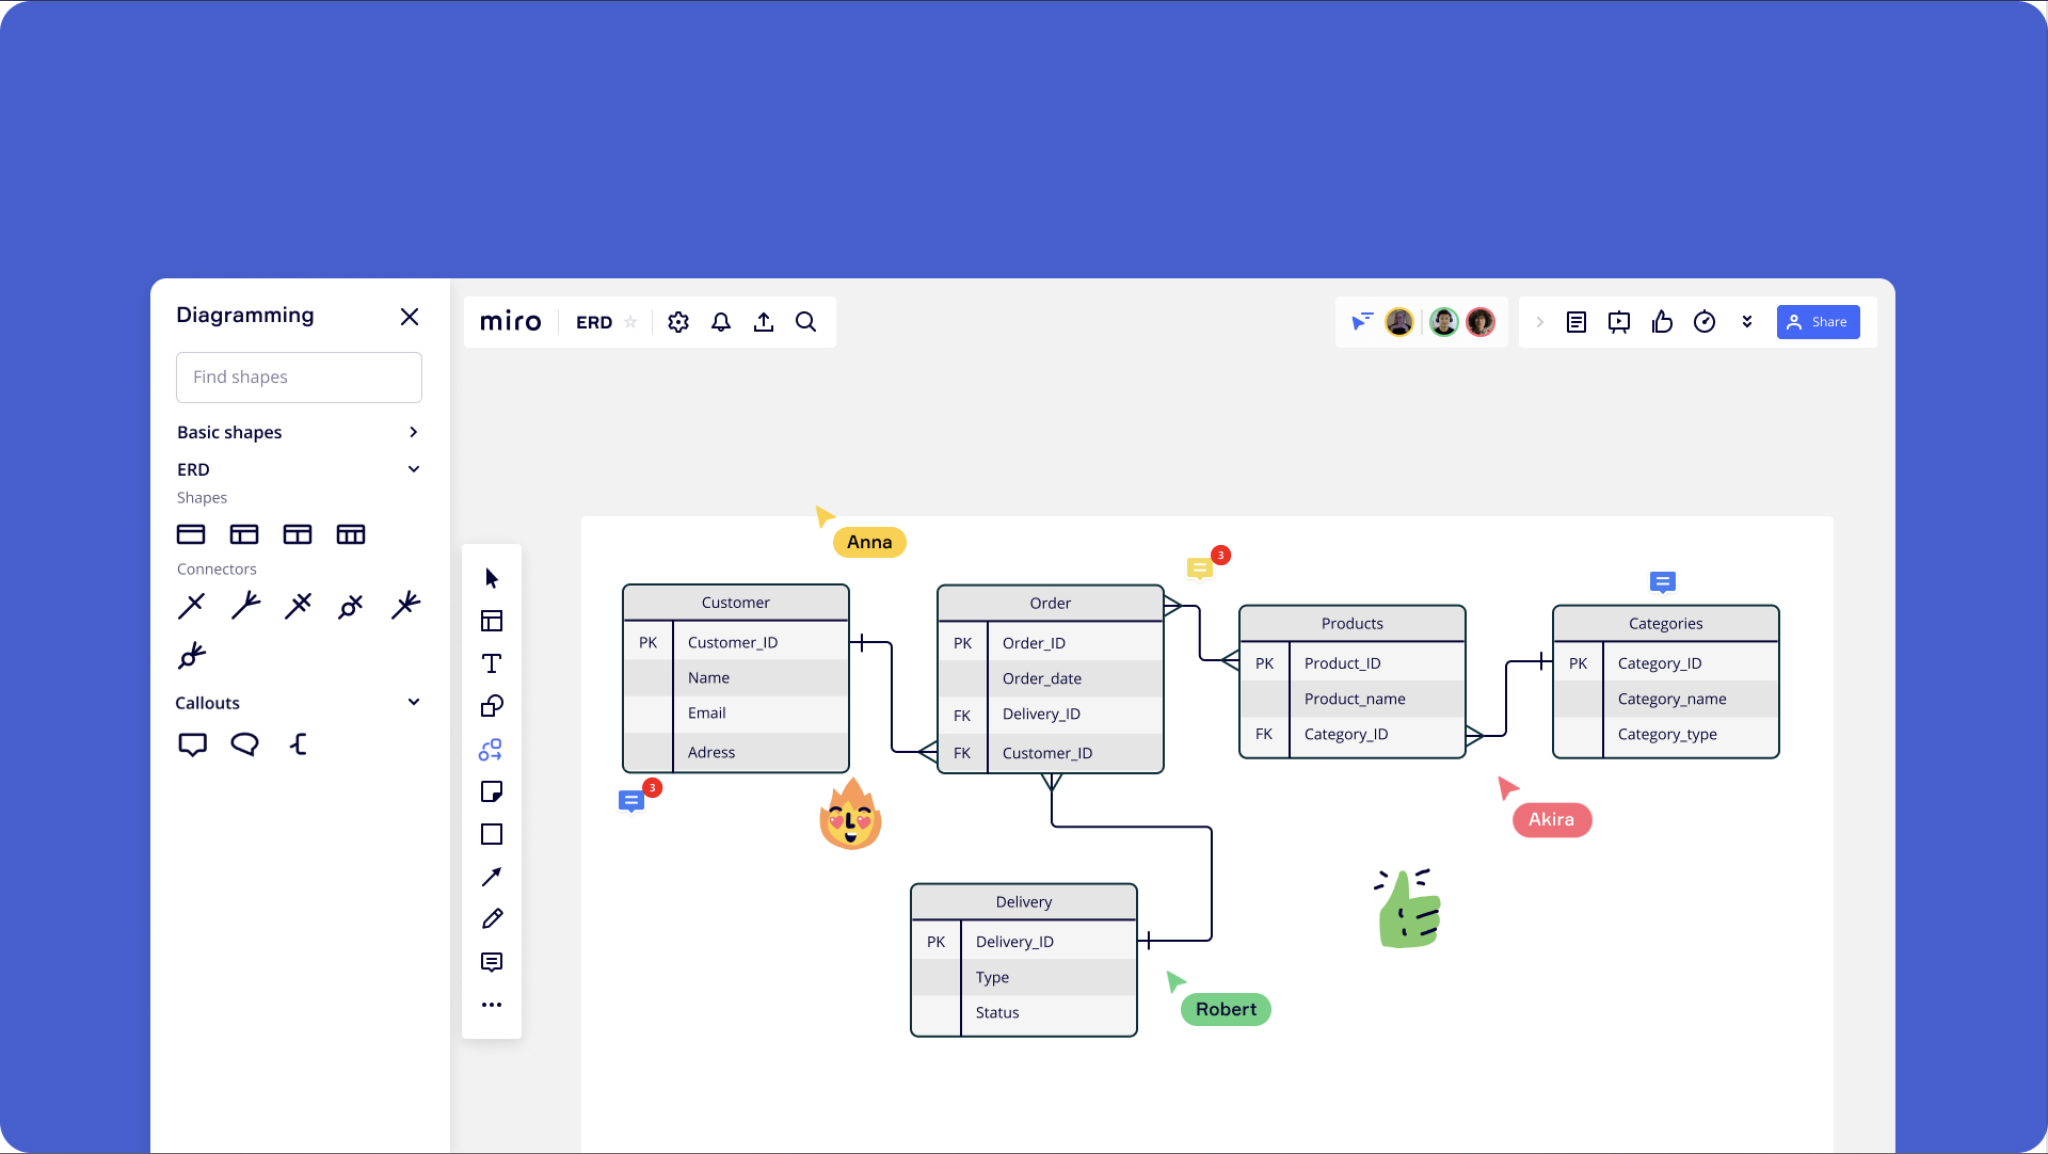
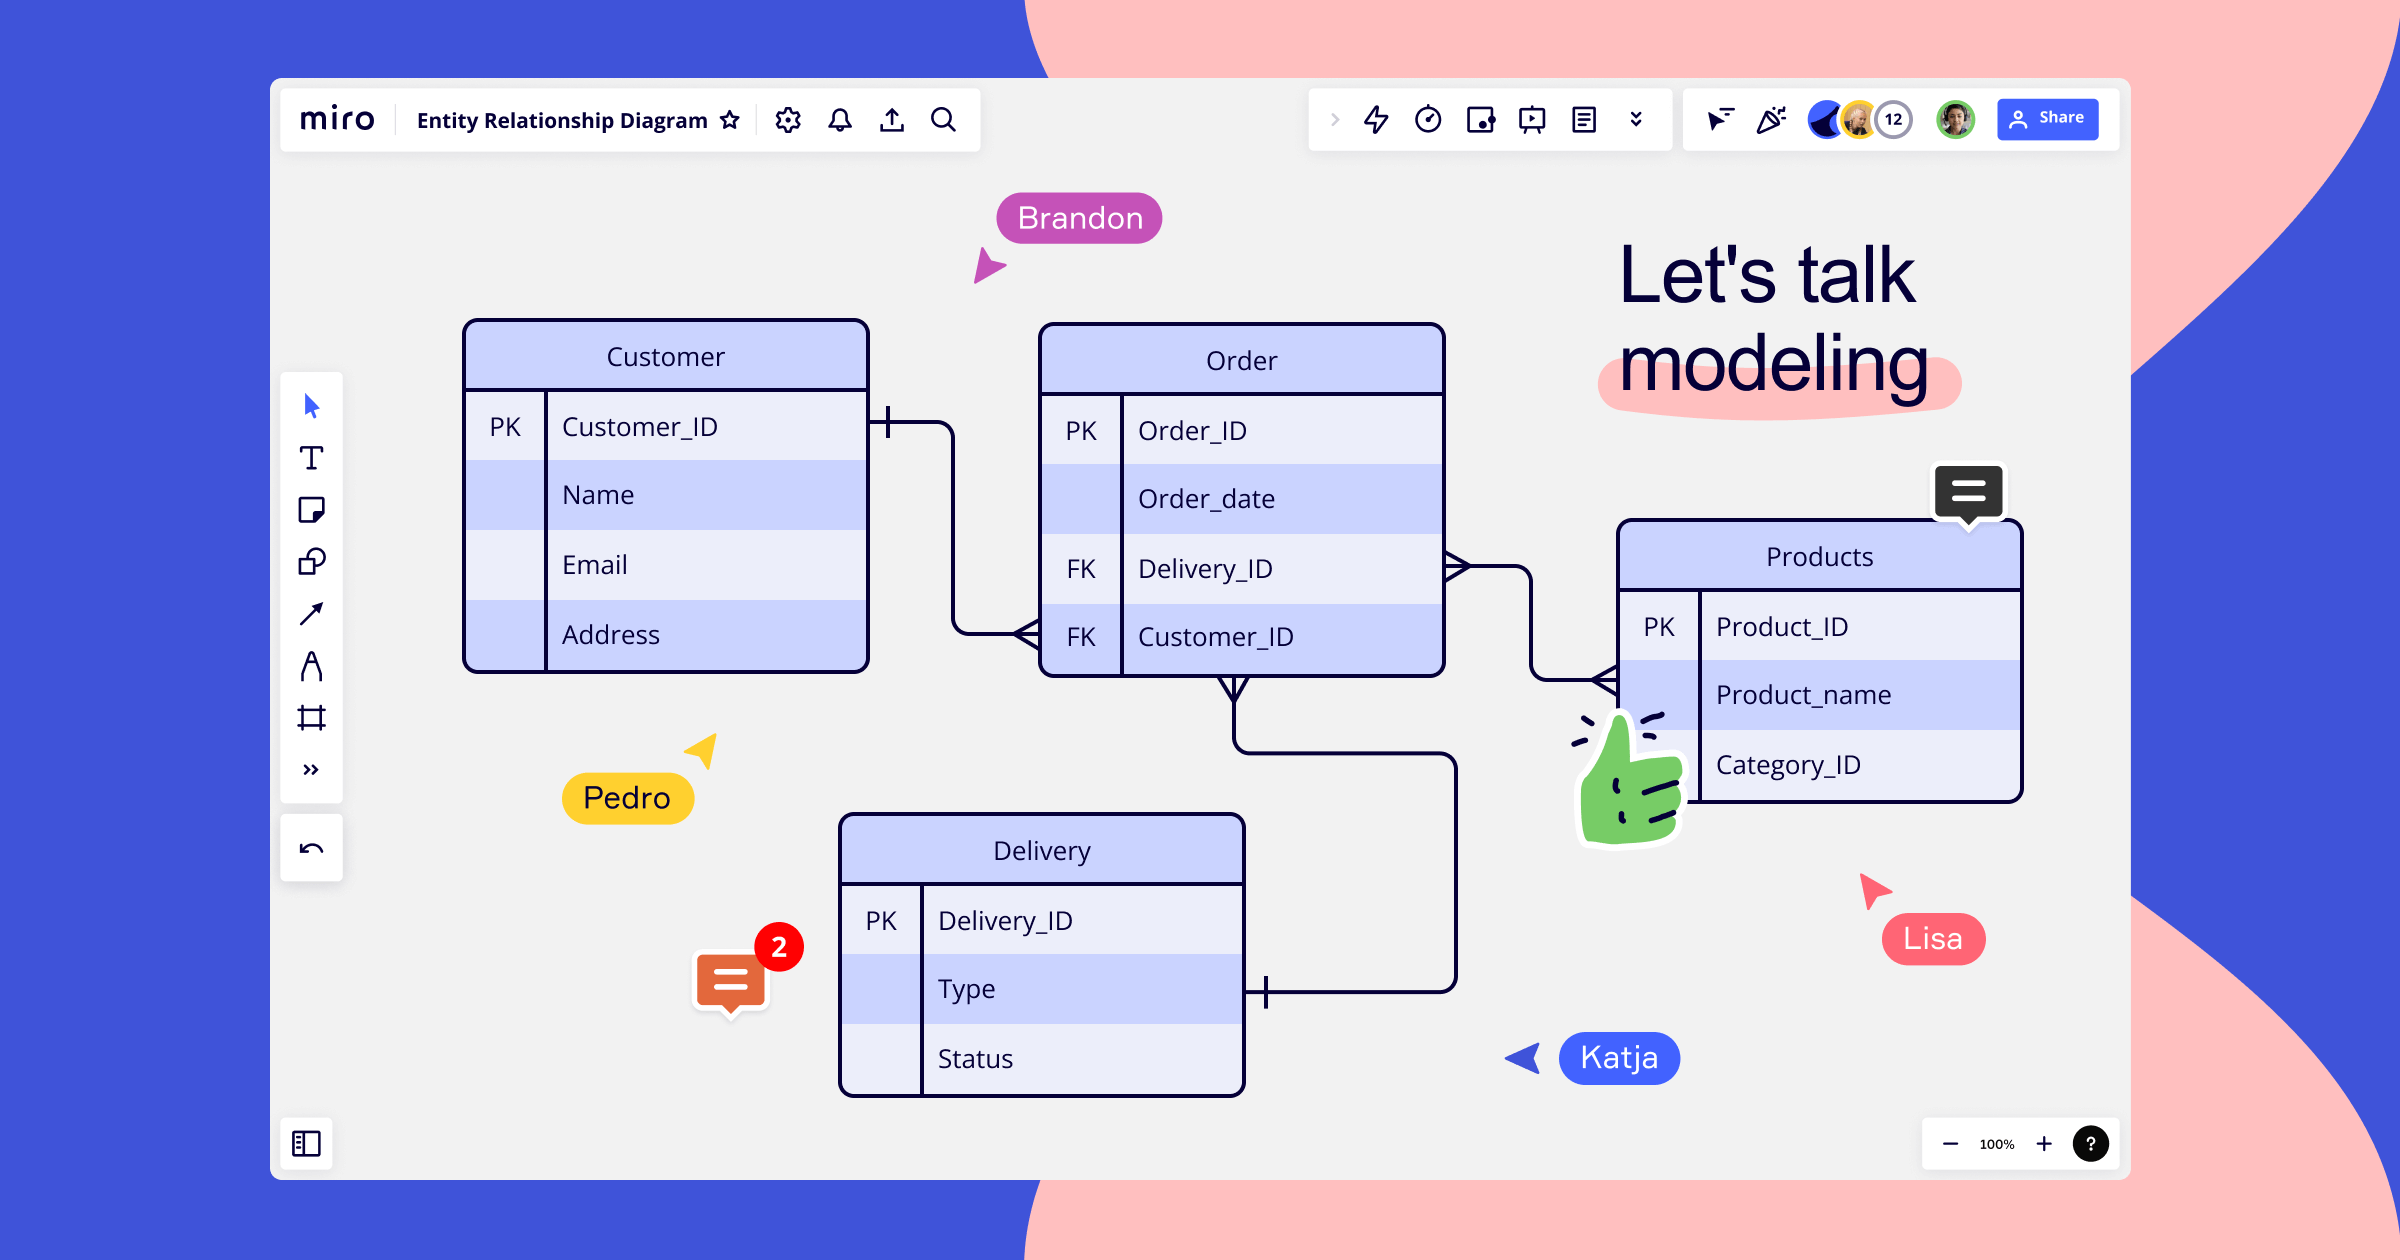
An entity relationship diagram, also known as an ERD or an ER diagram, is a visual tool for portraying relationships between actors in a system. ER diagrams are powerful tools for collaboration because they allow you to easily break down and visualize relationships between roles (like a product manager’s relationship with a developer), tangible business objects (like a product or service), and intangible business objects (like a product backlog).
Whether you’re looking to educate your teammates on the relationships between systems, onboard new hires, or create documentation, ERDs can serve a vital function. In this blog post, you’ll learn when to use an entity relationship diagram, which fields and roles benefit from ERDs, and how to draw an ER diagram.
What is an entity relationship diagram?
An entity relationship diagram is a type of flowchart that enables you to illustrate how entities (people, objects, or concepts) relate to each other inside a system. To capture an intuitive picture of a system, ER diagrams use a set of symbols such as triangles, rectangles, diamonds, ovals, and lines that display the relationships between entities. A typical entity diagram mirrors grammatical structure: entities are expressed as nouns, and relationships are portrayed as verbs.
The entity relationship diagram has been a popular data visualization tool for decades. Back in the 1970s, Peter Chen, a professor at Carnegie-Mellon University, developed ER modeling for database design. The tool quickly took off. By the late 1970s, Charles Bachman and A.P.G. Brown had extended Chen’s approach to build a refined version of the ER diagram that’s pretty close to what we use today.
When to use an entity relationship diagram
Entity relationship diagrams have a variety of applications. Here’s a snapshot of what you can do with an ERD:
- Educate your teammates: ERDs are powerful tools for educating your teammates on the relationships between systems or entities within an organizational structure.
- Design and troubleshoot a database: Many teams use ER diagrams as a database design tool to model relationship databases. Software engineers use ER diagrams to determine requirements for a project before getting started. ERDs are also a popular choice for troubleshooting existing databases, enabling teams to find and resolve logical problems.
- Analyze data: Researchers often use entity relationship diagrams to set up and analyze databases.
- Onboard new hires: ERDs are visual, so they’re an easy way to showcase information for new hires and quickly get them up to speed.
- Create documentation: Before changing a process, many teams create ER diagrams to document existing processes. That way, they can ensure all necessary measures are in place in case they need to return to the previous process.
Which fields use entity relationship diagrams the most?
Entity relationship diagrams are a popular way to visualize information across a variety of fields.
Software engineers rely on ER diagrams to design or troubleshoot information databases. Drawing an ERD is often a first step in diagnosing a database problem.
In the field of business information, ER diagram tools are often used to design, analyze, or clean up relational databases. They’re helpful for streamlining processes, understanding dependencies, and improving results.
Researchers use ERDs to deal with structured data. A lot of research begins with a high volume of raw, noisy data. Researchers can then use an entity relationship diagram to create a useful database that enables them to understand their data better.
How to draw an entity relationship diagram
Drawing an entity relationship diagram is easy. Here’s a quick way to get started:
1. Decide on the level of detail you want to include in your relationship diagram. Depending on your goals, you can draw an ERD at a high level or zoom in. Some models are conceptual, while others are logical or physical. Conceptual diagrams contain the least detail and are designed to show the overall scope of the model. Logical diagrams contain more detail, such as operational and transactional entities. Physical diagrams are the most detailed, zooming in on the technology that’s required to produce a database.
2. Identify all entities in the system. Simply put, an entity is a noun. It’s any definable thing, such as a person, object, concept, or event, with corresponding data associated with it. An entity could be a customer, student, product, dog, house, or pencil. Typically, rectangles represent entities in your ERD.
3. Create rectangles for all entities and name them. The names should be clear and intuitive.
4. Identify relationships between entities. If entities are nouns, relationships are verbs. Relationships are how entities act upon each other or are associated with each other. For example, let’s say a customer signs up for a free trial. The entities would be the customer and the free trial, and the relationship would be signing up. Typically, diamonds represent relationships in your ERD.
5. Connect all relationships with lines or arrows. The lines showcase how various entities in the relationship diagram relate to each other.
6. Customize your entity relationship diagram according to your needs. You can add shapes, change colors, make sticky notes, and draw arrows. Invite your teammates to collaborate with you and gather feedback.
Ready to make your own?
Want to get started on your own entity relationship diagram? Miro’s free Entity Relationship Diagram template makes it easy to customize and share an entity relationship diagram with your collaborators. Get started today!
Try our free ER diagram template
