Table of contents
Table of contents
10 diagram examples for any type of project

Summary
In this guide, you will learn:
- How Miro enables unlimited visual customer journey mapping on a flexible canvas, supporting workshops and real-time collaboration
- A 6-step AI-powered customer journey mapping process for goal definition, data consolidation, AI analysis, and iterative refinement within Miro
- The importance of integrating quantitative and qualitative customer data for comprehensive, unbiased journey maps
- Collaborative techniques for mapping customer actions, thoughts, and emotions using visual tools like emojis and stickers in Miro
- Benefits of Miro’s journey mapping tools: cross-functional alignment, platform integration, and AI-driven insights for actionable improvements
- Availability of AI-assisted customer journey map templates on Miroverse to enhance analysis, stakeholder collaboration, and strategic planning across CX, marketing, product, and design teams
Try Miro now
Join thousands of teams using Miro to do their best work yet.
Diagrams explained: Making your work easier
Have you ever struggled to explain a complex idea to your team? Enter: Diagrams. These visual tools simplify complicated concepts, making it easier for everyone to understand and collaborate. Let’s dive into the different types of diagrams you can use for your projects and how they can transform your workflow.
Diagram examples for data visualization
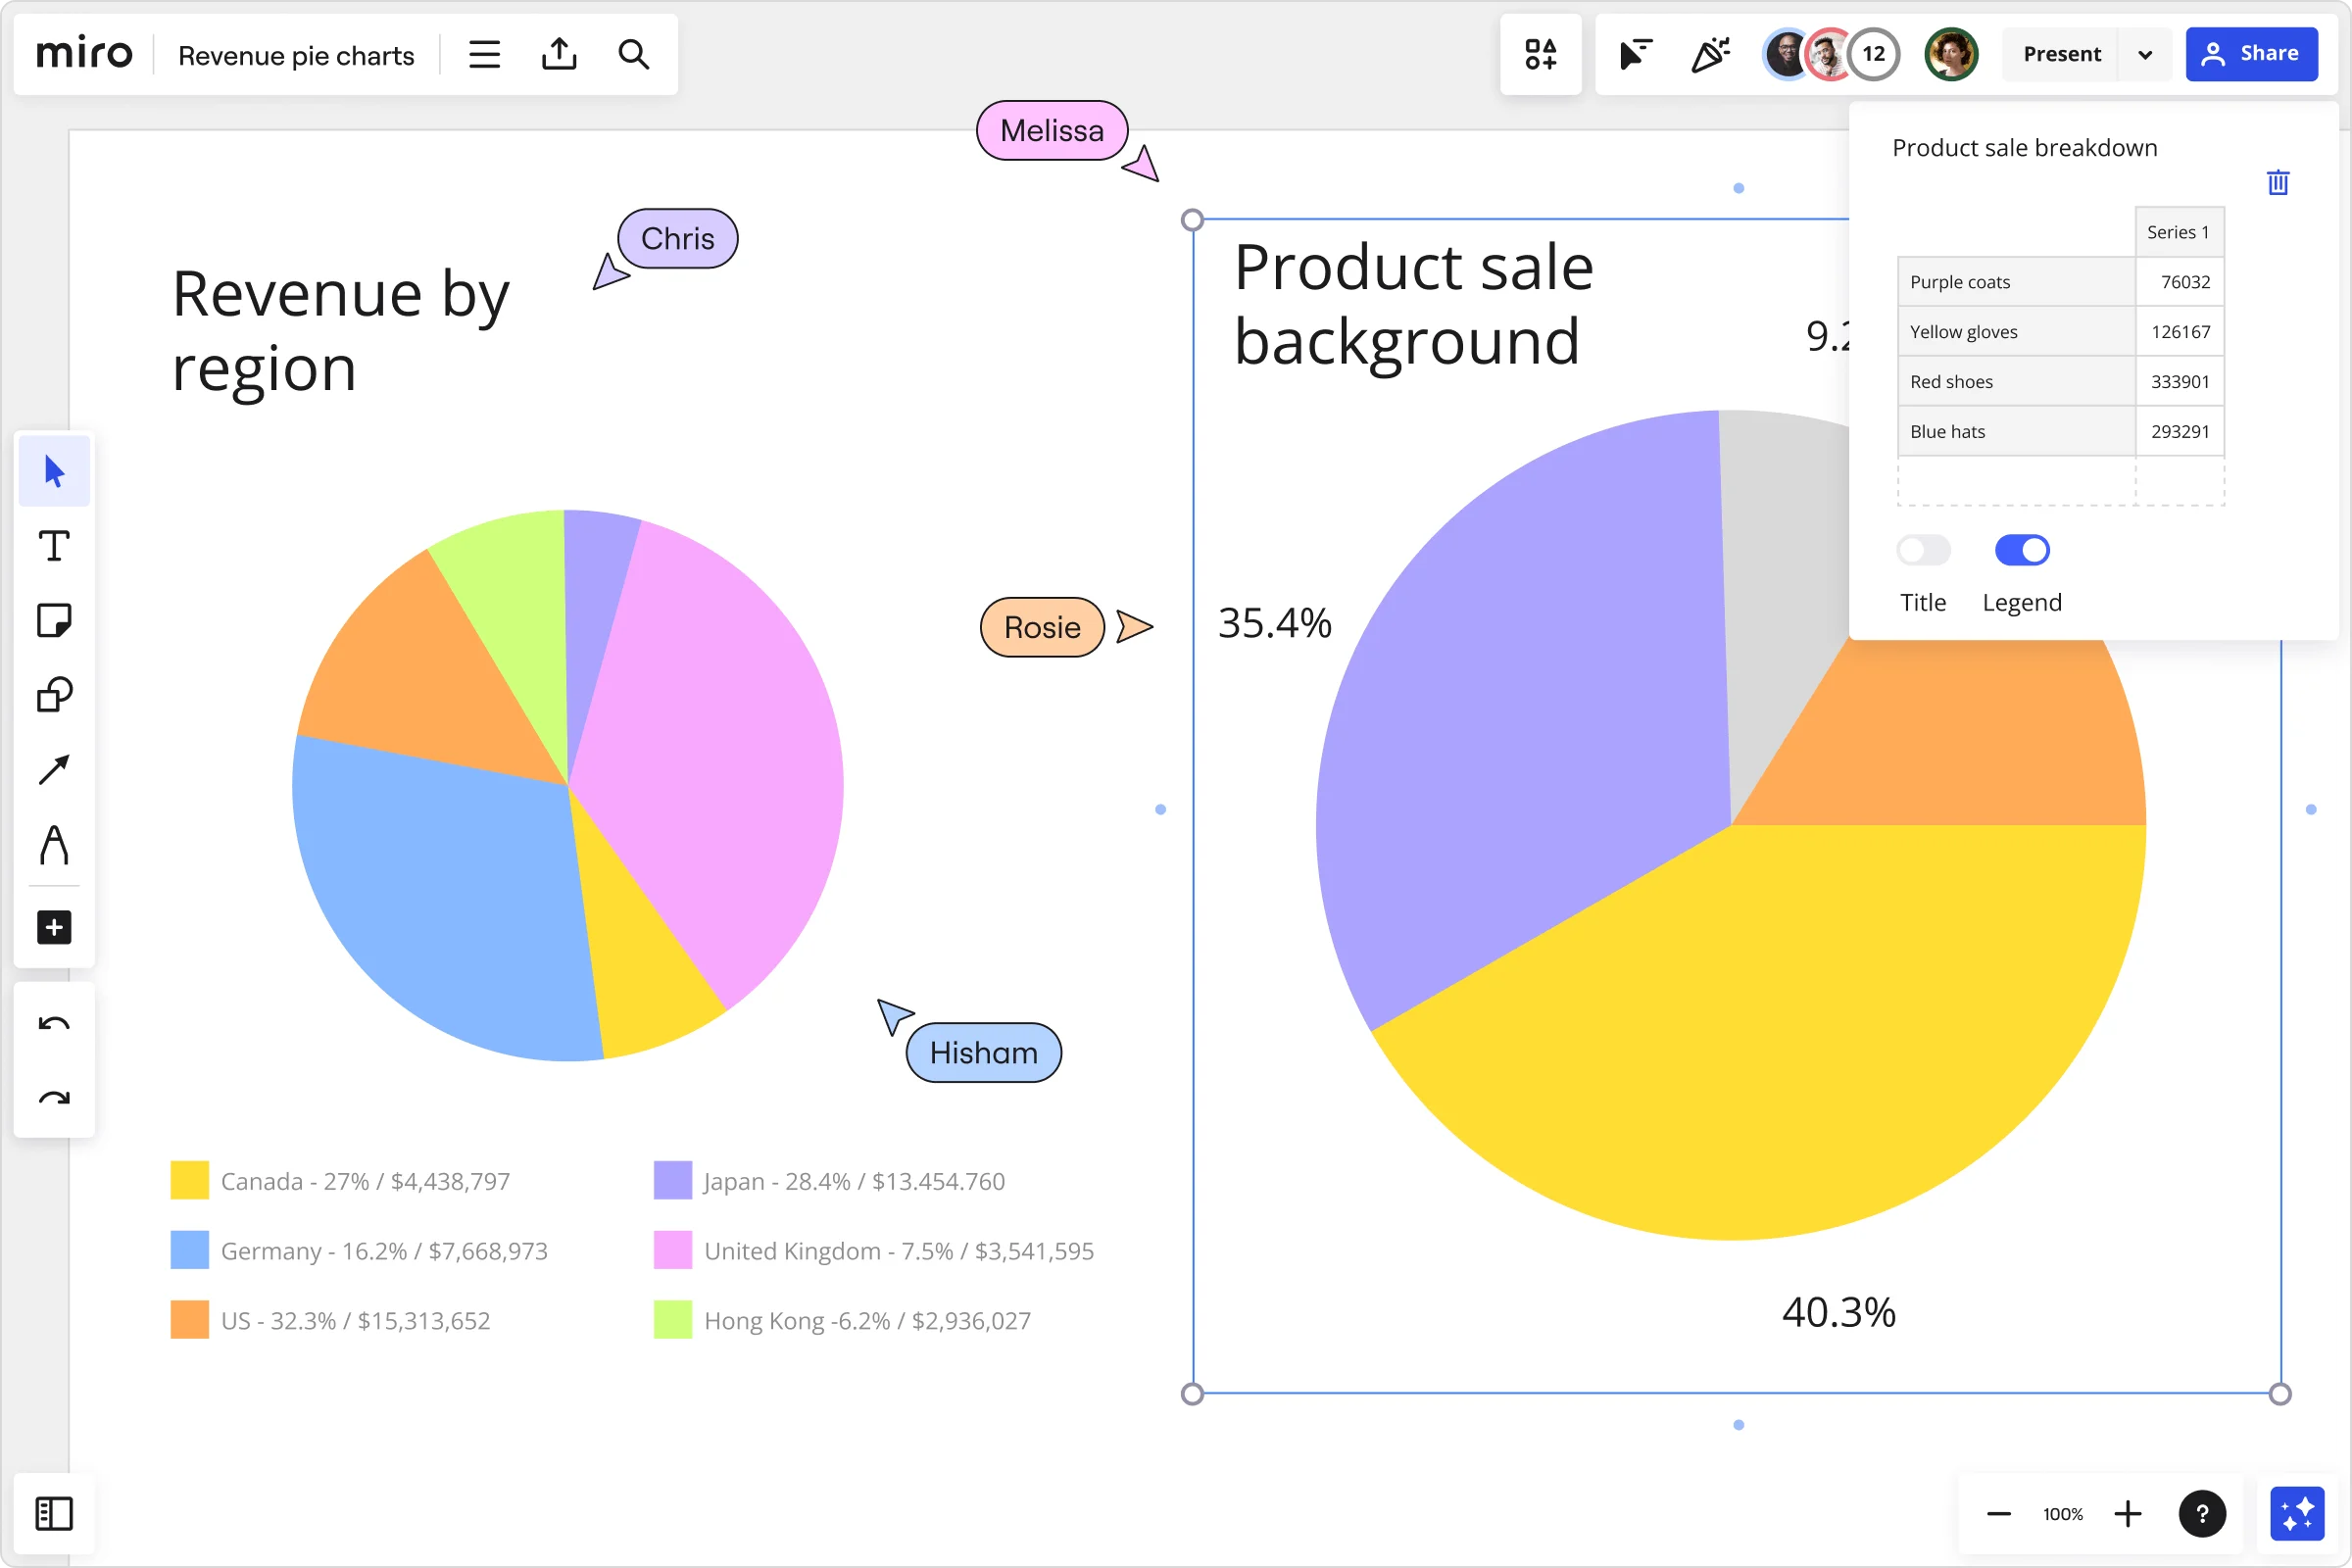
Numbers and data can be overwhelming, but a well-crafted diagram can turn them into a story. Data visualization diagrams, like bar charts, pie charts, and scatter plots, help you see trends and patterns at a glance. Imagine presenting your latest market analysis with an interactive chart that highlights key insights—your team will get the picture instantly. Miro’s visual workspace offers a variety of tools and templates to create stunning data visualizations effortlessly, so you can focus on what the data means, not how to present it.
Try our pie chart template.
Diagram examples for process mapping
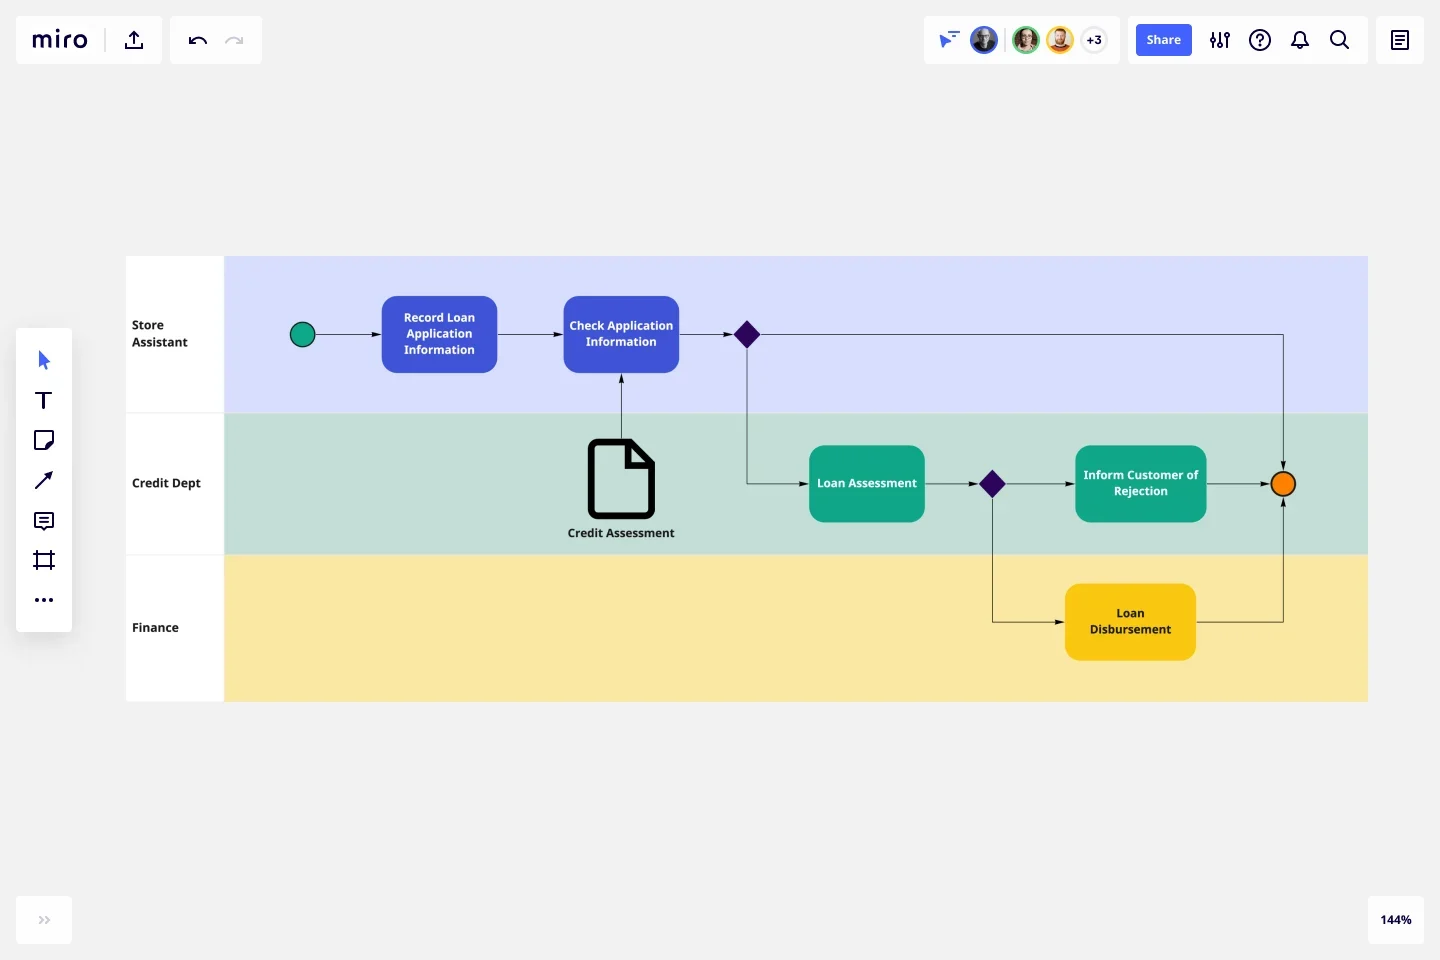
Ever felt lost in a sea of processes and workflows? Process mapping diagrams are your map and compass. Flowcharts, swimlane diagrams, and Business Process Modeling Notation (BPMN) diagrams streamline complex processes, showing each step and who’s responsible. Picture your team working on a new feature. With a clear process map, everyone knows their role and the sequence of tasks. Miro’s advanced diagramming tools and extensive shape library make it easy to create detailed process maps, ensuring everyone is on the same page.
Try our process mapping templates.
Diagram examples for user experience (UX) design
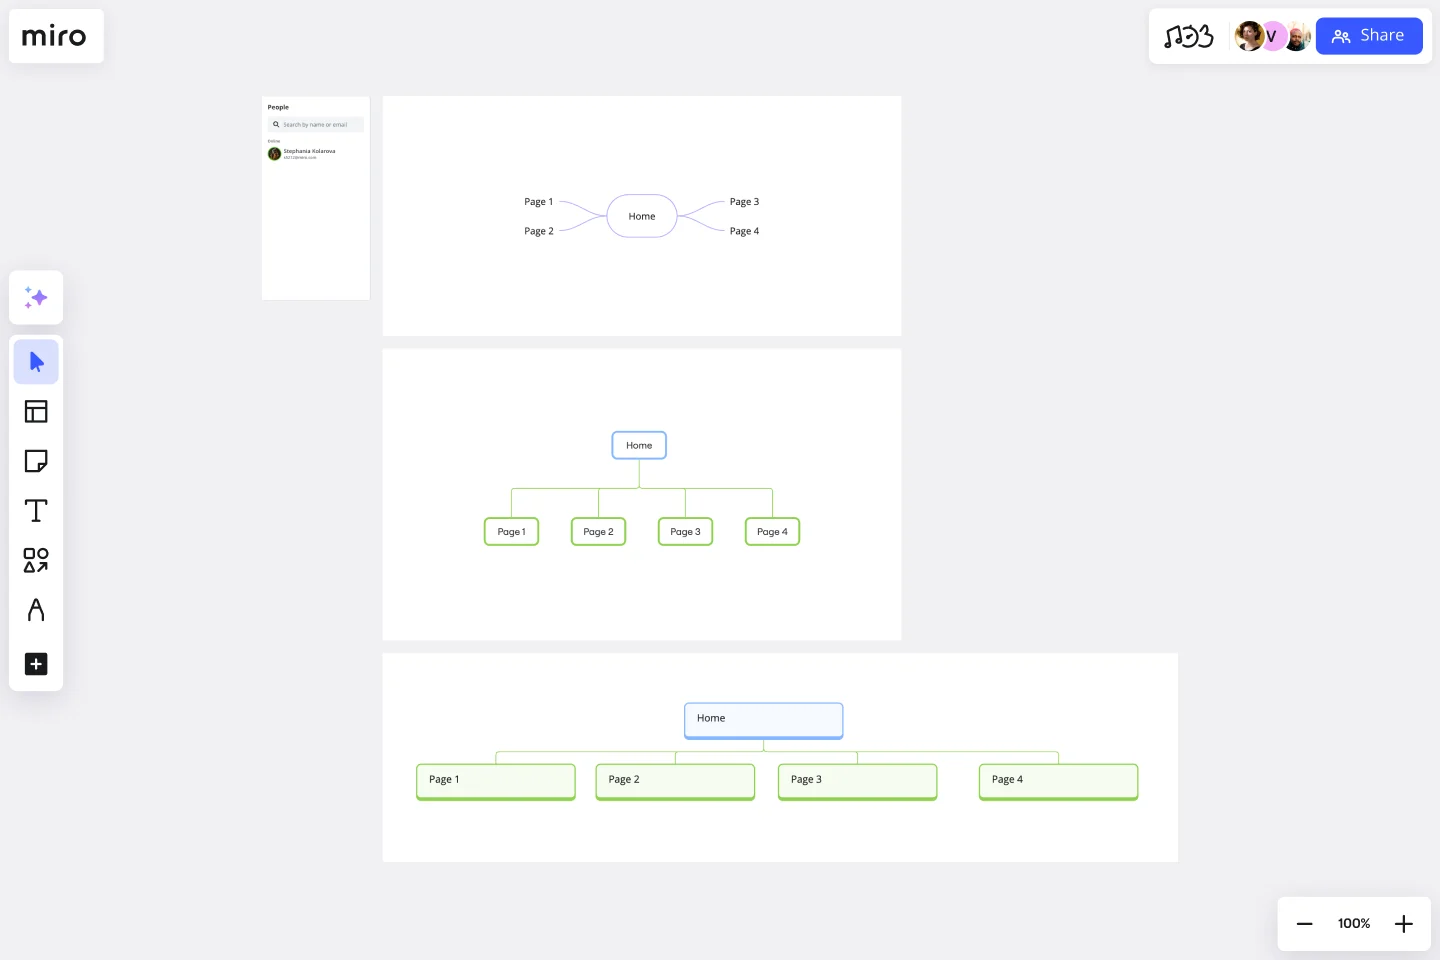
Designing an exceptional user experience requires meticulous planning and clear communication. UX diagrams, such as wireframes, user journey maps, and sitemaps, provide a visual blueprint of your design. They help you map out user interactions, identify pain points, and create a seamless experience. Imagine brainstorming with your team on Miro’s visual workspace, where you can collaboratively design wireframes and iterate in real-time or asynchronously. Miro’s integration with tools like Jira and Asana ensures your UX diagrams are part of a smooth workflow from ideation to implementation.
Try our UX templates.
Diagram examples for technical documentation

Technical documentation can be dry and difficult to digest, but diagrams can breathe life into it. Network diagrams, UML diagrams, and ER diagrams make complex systems understandable and accessible. Whether you're documenting software architecture or network configurations, a clear diagram can bridge the gap between technical and non-technical team members. With Miro, you can create detailed technical diagrams using advanced diagramming features, and export them in various formats for easy sharing and presentation.
Try our diagramming templates.
Diagram examples for mind mapping and brainstorming
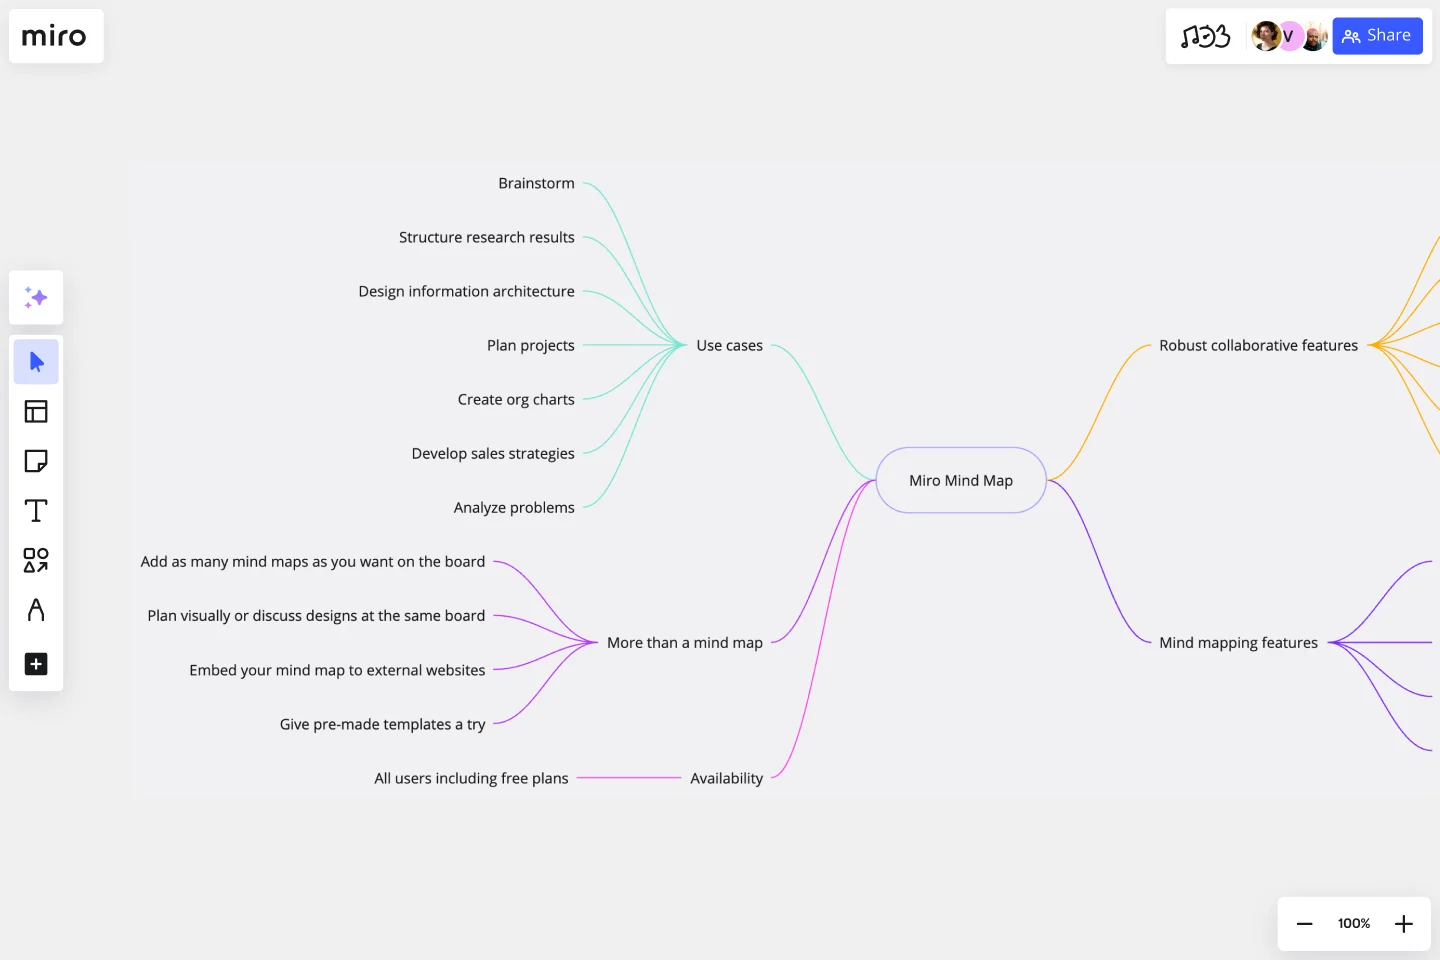
Great ideas often start with a spark, but capturing and organizing those sparks can be challenging. Mind maps and brainstorming diagrams help you visualize and structure your thoughts. They’re perfect for planning projects, generating ideas, and solving problems. Imagine a dynamic brainstorming session where everyone’s input is captured and organized visually. Miro’s template picker and custom shape packs make it easy to start mind mapping and brainstorming sessions, turning scattered thoughts into actionable plans.
Try our brainstorming templates and mind map templates.
Diagram examples for wireframing
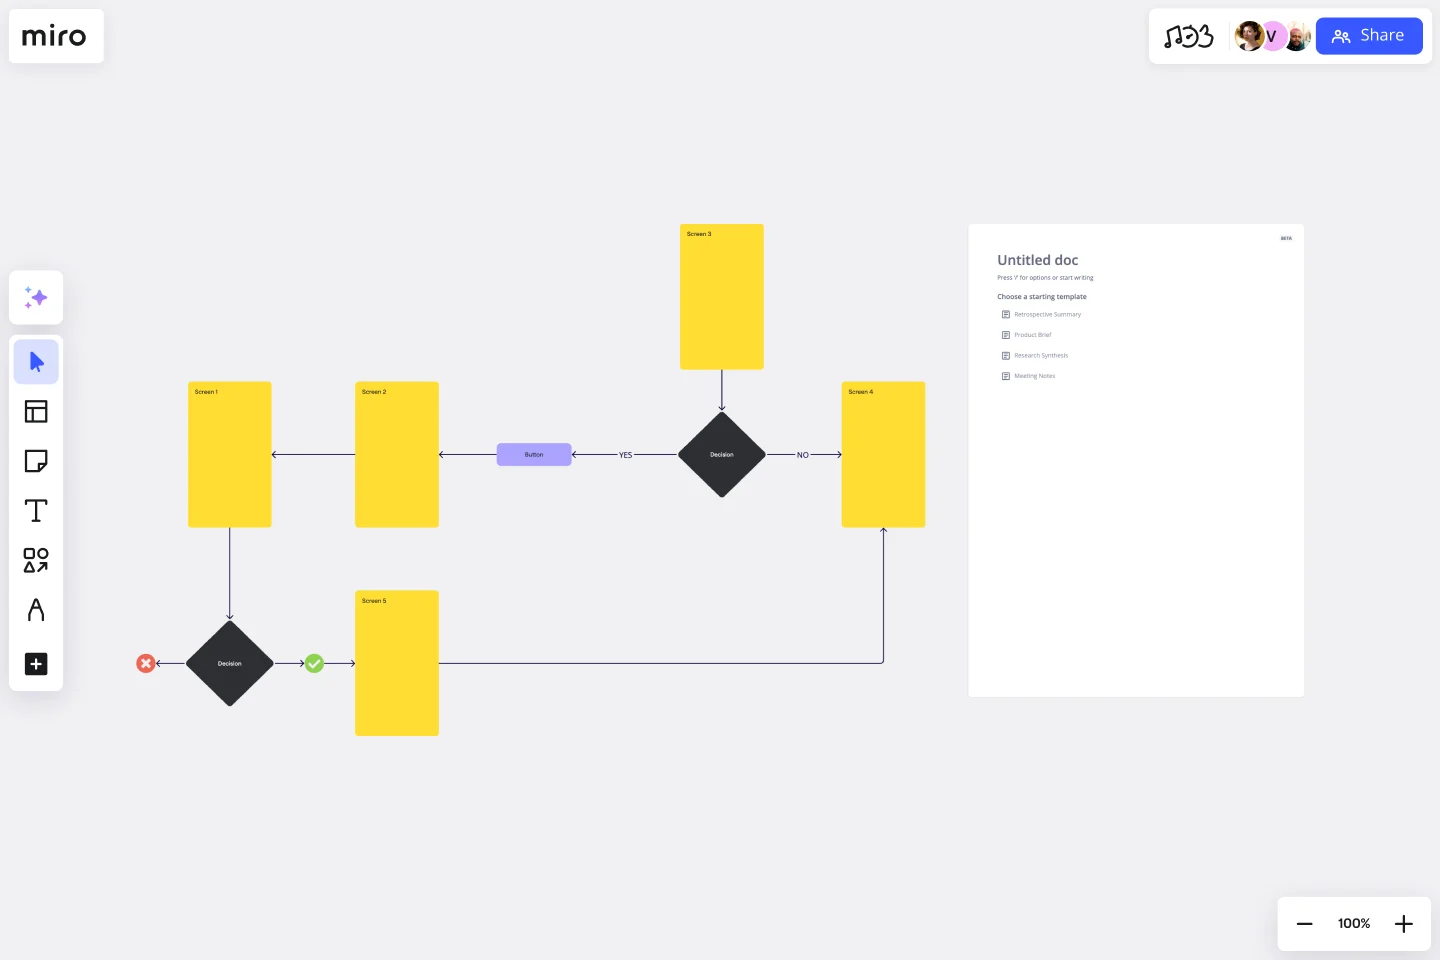
Wireframes are essential for designing intuitive and functional digital products. They act as the blueprints for your app or website, laying out key elements like navigation, content, and user interactions. A great example is the user flow template—a diagram that maps the user journey through your product. This helps ensure your team agrees on the structure and flow before diving into high-fidelity design work.
Try our wireframing templates.
Diagram examples for strategy mapping
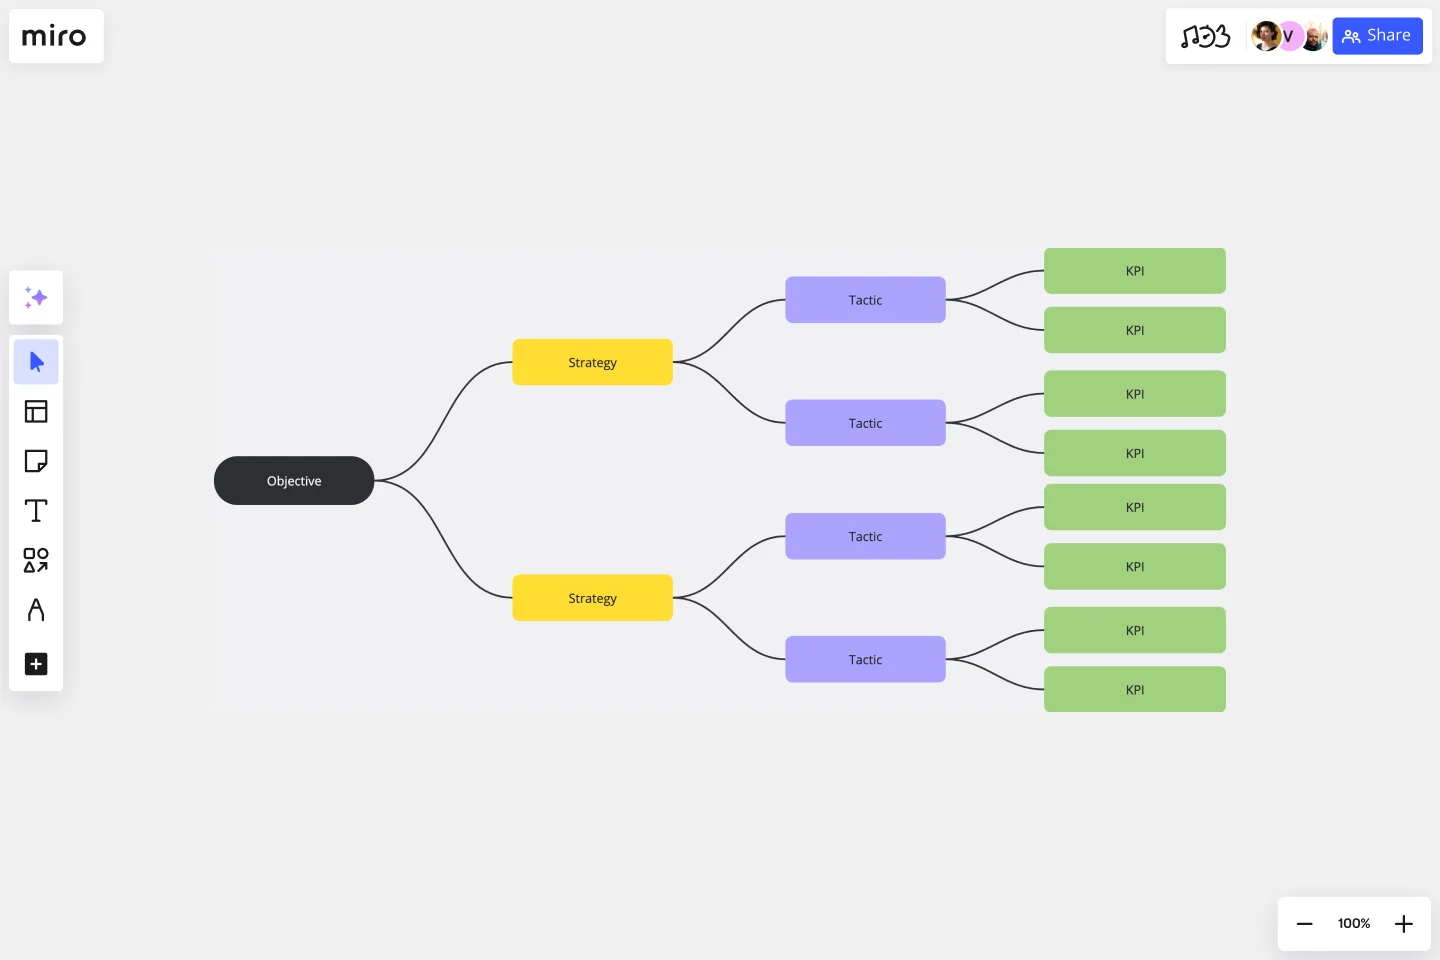
When it comes to achieving your business goals, having a clear strategy is critical—and strategy mapping diagrams can show the path forward. These diagrams help you visualize how specific actions align with your overall objectives. For example, Miro’s KPI tree template or priority matrix can be a game-changer for setting measurable goals and prioritizing tasks.
Try our strategy planning templates.
Diagram examples for organizational design
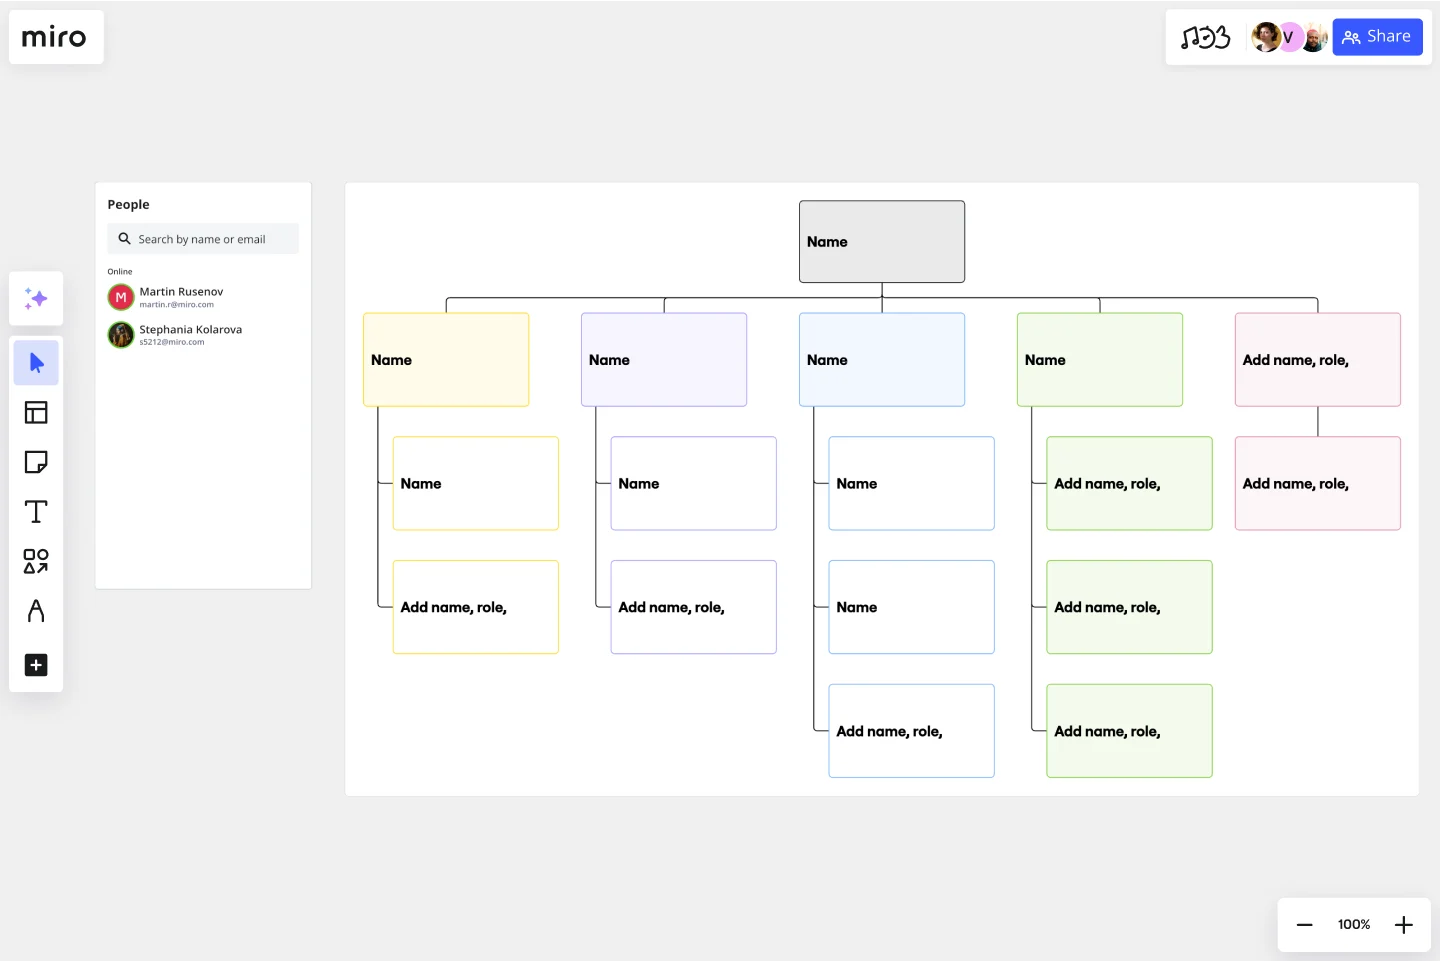
Building a well-structured team is essential for driving efficiency and clarity, and diagrams for organizational design—like organizational charts—are perfect for visualizing your company’s hierarchy. Org charts display relationships between roles and departments, helping your team understand reporting lines and areas of responsibility.
Try our organizational charts templates.
Diagram examples for problem-solving
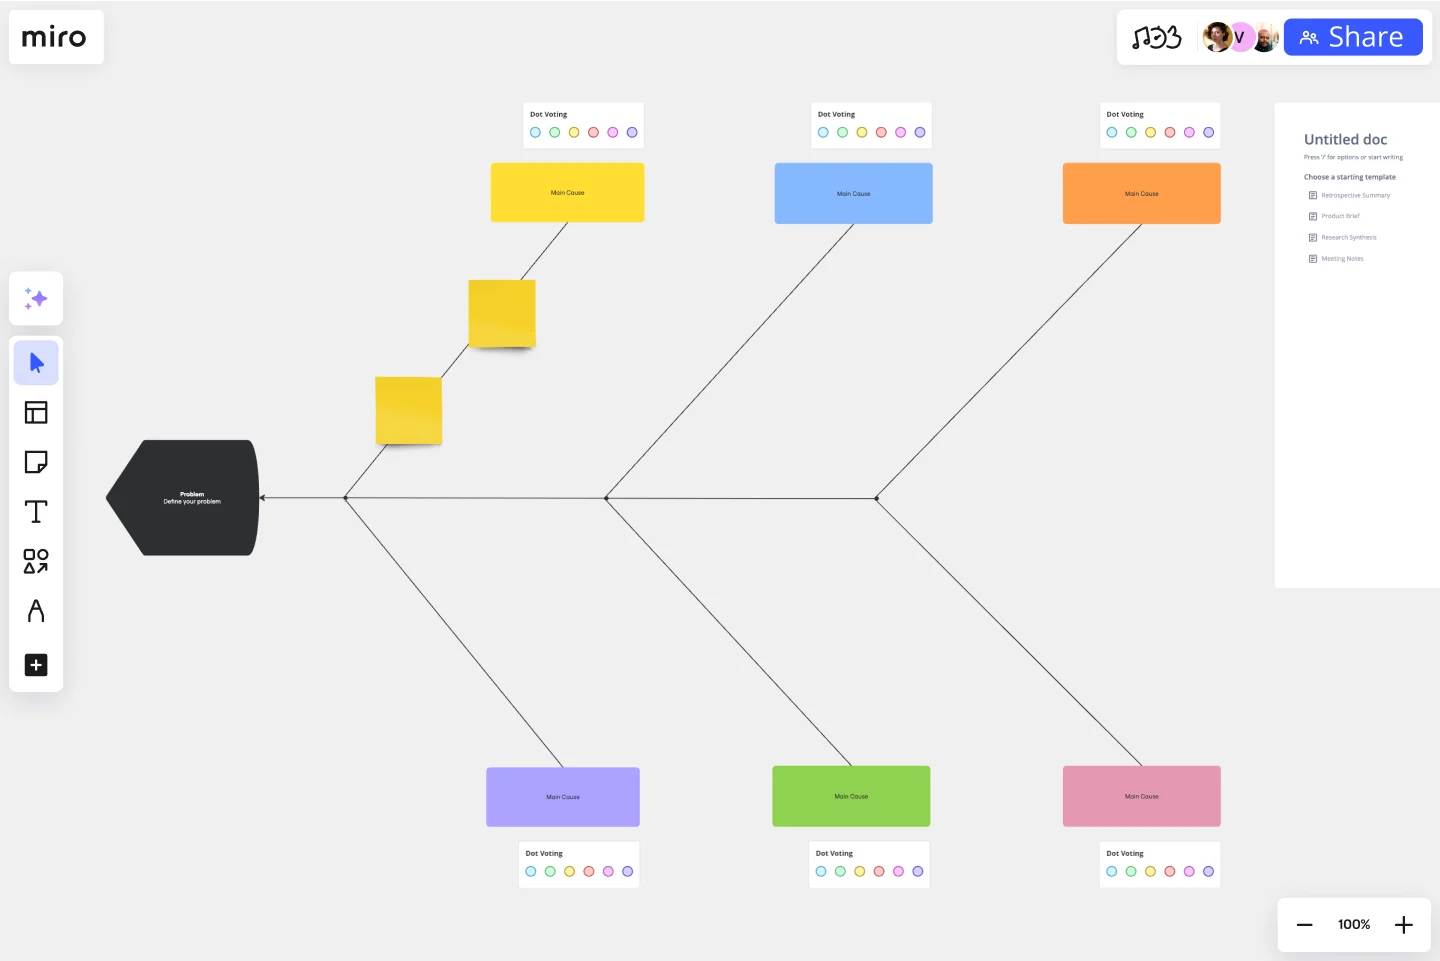
When facing complex challenges, visualizing the problem can make all the difference. Diagrams for problem-solving, such as fishbone diagrams and decision trees, help break down the root causes and analyze potential solutions. These visual tools are invaluable for organizing thoughts and finding the best path forward.
Try our fishbone diagram templates.
Diagram examples for managing projects
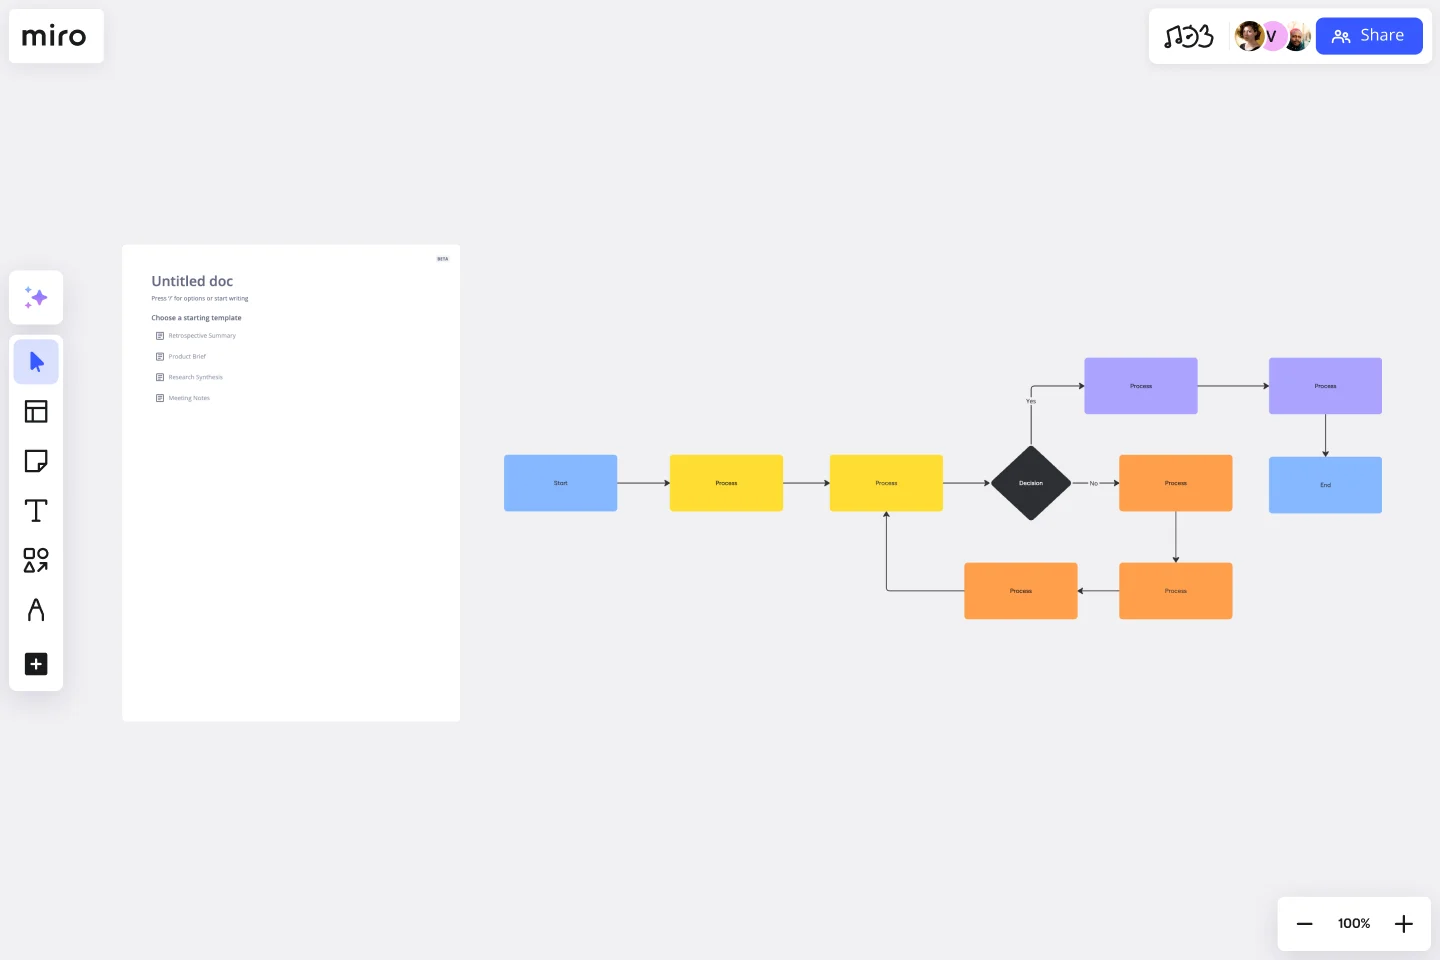
Keeping projects on track requires a clear visual roadmap. Project management diagrams, like flowcharts and calendars, offer visibility into tasks, deadlines, and milestones. Flowcharts help outline processes and workflows, while calendars provide a visual schedule that everyone can follow. Try our planning templates.
Best diagramming practices with Miro
Creating effective diagrams requires more than just the right tools; it requires best practices that maximize their impact. Here are some tips to elevate your diagramming game with Miro:
- Start with a template: Use Miro’s extensive library of templates to kickstart your diagramming project. Templates save time and provide a solid foundation to build upon.
- Collaborate in real time: Use Miro’s real time collaboration features to gather input from your team. Multiple users can work on the same diagram simultaneously, making it a truly collaborative effort.
- Use advanced diagramming tools: Miro’s advanced tools support various methodologies like BPMN, UML, and ERD. These tools simplify complex workflows and ensure consistency in your diagrams.
- Switch shapes effortlessly: The switch type feature in Miro allows you to transform one shape into another without starting from scratch, saving you time and effort.
- Integrate with your workflow: Miro integrates with popular tools like Jira, Asana, and Azure, allowing you to import tasks and issues directly into your diagrams. This ensures your diagrams are always up-to-date and relevant.
- Export and share with ease: Once your diagram is complete, export it in formats like PDF, image, or CSV, or share it directly from Miro for seamless communication.
- Explore AI and automation: Keep an eye on Miro’s evolving AI and automation features, designed to enhance your diagramming experience and increase efficiency.
With Miro’s visual workspace, you have all the tools you need to create, manage, and share diagrams that drive innovation and clarity. Whether you’re visualizing data, mapping processes, designing UX, documenting technical details, or brainstorming ideas, Miro empowers you to work smarter and collaborate better.
Author: Miro Team
Last update: October 9, 2025