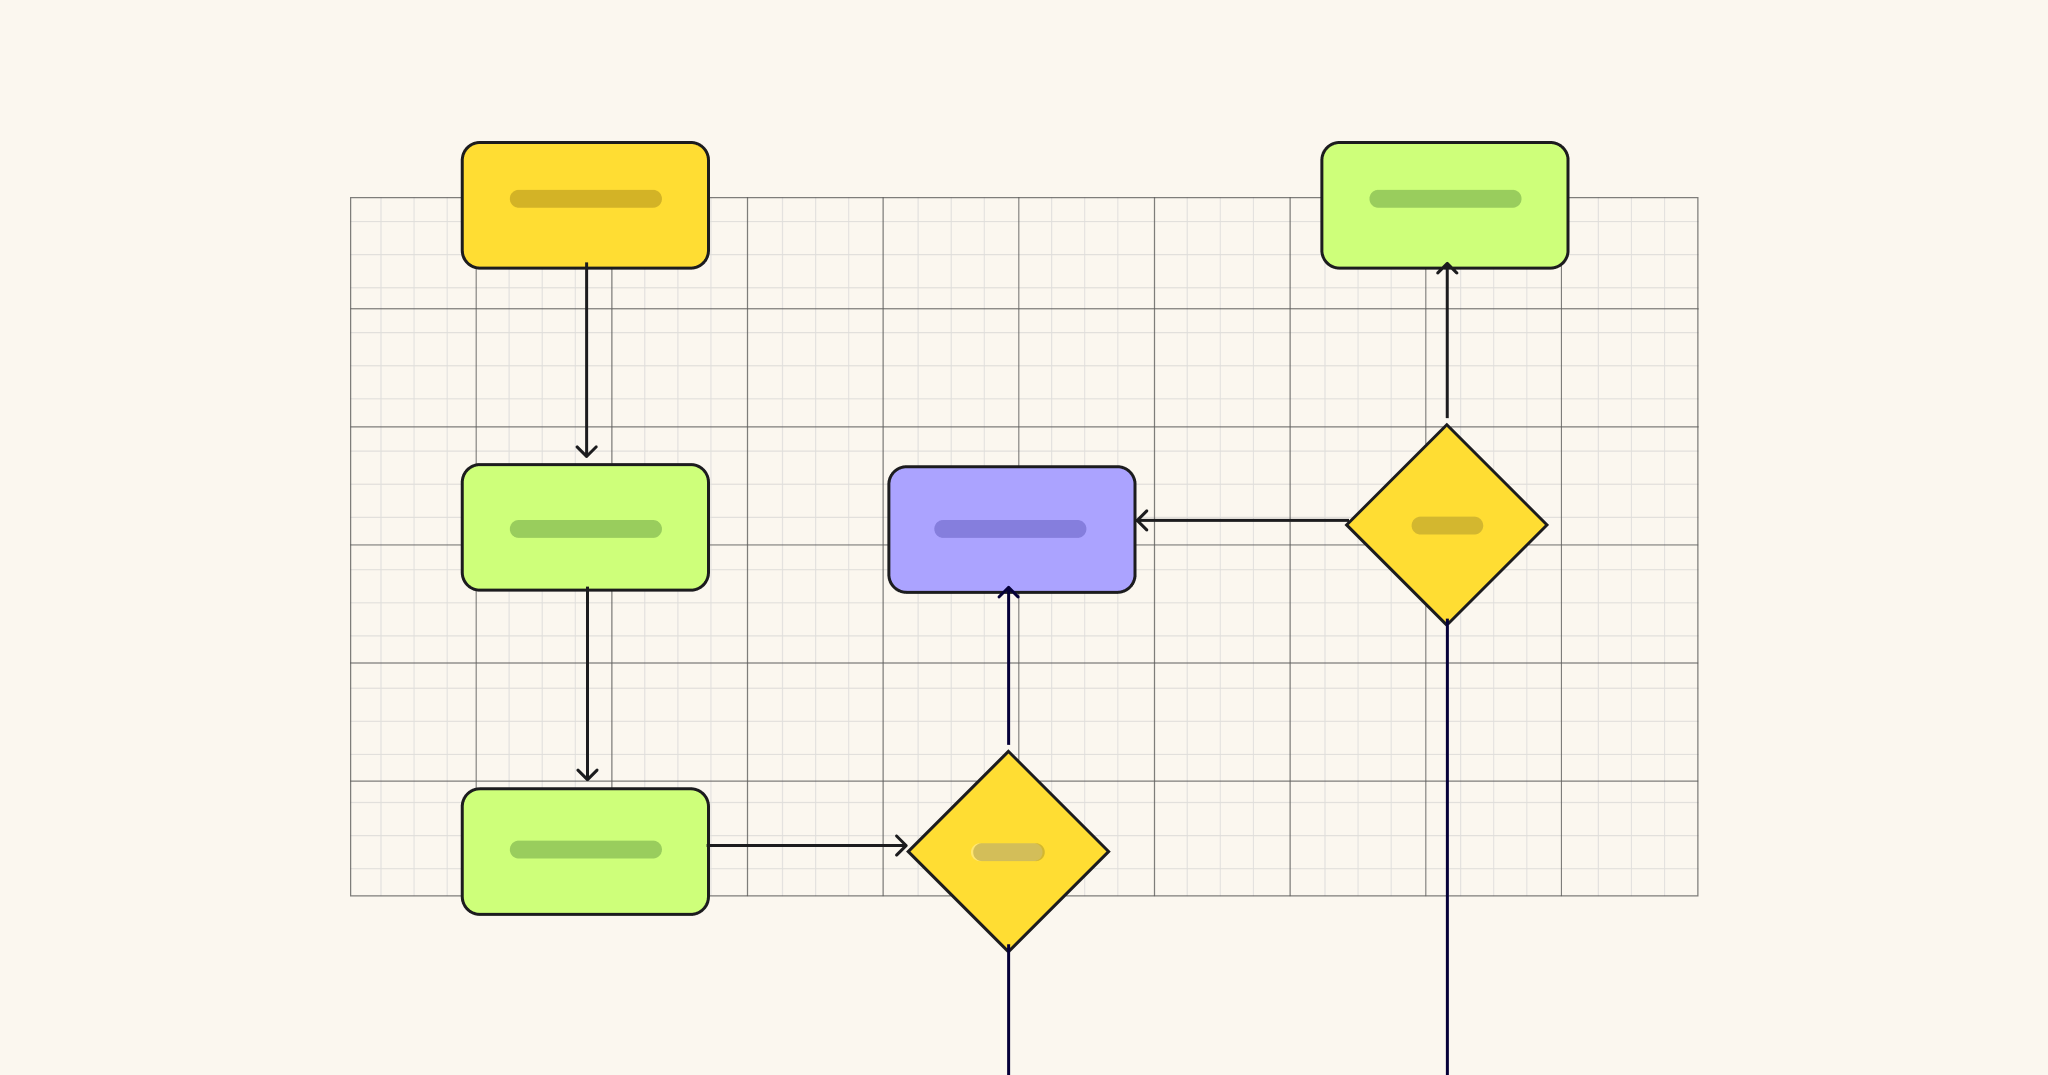
Today, software development teams are facing increasing pressure to deliver more, faster—even in the face of increasing technical complexity. In fact, two of the biggest challenges reported in a recent survey of software developers were an inability to keep pace with innovations in developer tools (27.7%) and a struggle to manage workloads (26.2%).
The software development life cycle is complex, and blends both people and product management and technical work. To manage this—-and increasing demands on time and resources—properly, developers need to maintain close collaboration between product, design, and business teams. They also need the right tools and processes.
The software development lifecycle (SDLC) is a framework that helps to encompass the full scope of this undertaking, and gives teams a roadmap toward success—provided they collaborate effectively throughout the process.
What is SDLC?
The software development life cycle (SDLC) is the systematic process of planning, developing, launching, and maintaining software applications.
Developing software requires a structured approach to turn concepts into practical applications. The SDLC framework guides this process through each stage of the software production life cycle, ensuring a high quality end product at the lowest cost and shortest timeline possible.
A typical software development life cycle includes seven stages, including:
- Requirements analysis
- Planning
- Design
- Development
- Testing
- Deployment
- Maintenance
Development teams will work through each stage sequentially, helping to ensure product quality, project efficiency, and the timely completion of projects.
Deconstructing the SDLC stages
The SDLC is a sequential workflow that starts with requirements gathering and systematically moves through the production process along a guided track. Each SDLC stage builds on the previous one, ensuring that no critical phase is missed and that project teams remain aligned throughout.
Collaborative diagramming plays a central role in each SDLC stage, allowing teams to visually detail what’s required at each phase, collaborate on to-dos and planning, and stay aligned as a team throughout the process.
Here’s a breakdown of each SDLC stage.
Planning
The planning phase seeks to answer the questions: “what do we want to do?” and “what is feasible within our time and resource constraints?”
During this stage, you define the project’s scope of work, segment and assign tasks, and create the project management plan. Planning, in this context, also includes cost estimation, resource allocation, project and task scheduling, and defining milestones and stakeholder check ins.
Having a single source of truth is essential during the planning phase. With it, everyone sees the same planning documentation, and is able to adapt their recommendations and inputs according to the same information.
Did you know?
Miro has a bi-directional integration with Jira. This allows users to sync their source of truth diagrams built during the SDLC with project and task management features in Jira, so they can move seamlessly from planning to action to execution.
Requirements gathering
The requirements-gathering phase involves gathering as much input as possible to help inform the scope of the production cycle. The goal is to identify current problems, customer demands, competitor threats, and technical considerations that need to be addressed.
Typically, this will include gathering inputs from the development team, customers, sales and marketing teams, and industry experts to get a full picture of immediate requirements. These requirements are then documented, reviewed, and prioritized to help with the planning stage.
Design
During this phase, the development team converts the requirements list into a design specification for the new product or feature. This outlines system architecture, front end UI, data models, and components integrations for the new software.
Then, stakeholders and developers collaborate to review and refine the design plan to ensure that it’s both comprehensive and feasible under the existing project plan. Once finalized, the design plan serves as the blueprint for the development phase.
Development
Now the actual development and coding starts. The development team works through the project plan to build the new product or features. It’s critical that, during this phase, developers stick closely to the agreed product design to ensure that the project remains on track and in scope.
Testing
At this stage, the QA team begins testing the new product or feature for defects or deficiencies—aka bug squashing. This includes various QA techniques that are designed to uncover issues that might compromise the quality and stability of the end product.
In addition to squashing bugs, testers also have the critical job of ensuring that the new software meets the specified requirements outlined earlier in the SDLC.
Deployment
Once the software passes all tests, it’s deployed to the product environment where end-users can access and use it.
Depending on the complexity of the software, and the company’s production processes, this might be a direct deployment from testing to production, or it might have a few extra steps through a staging environment or beta testing period.
Maintenance
Post-deployment, the software enters the maintenance phase. This is an ongoing SDLC stage that includes regular updates, bug fixes, performance testing and improvements, and adaptation
to changes in the market and user requirements.
Documentation remains critical in the ongoing stages of software maintenance, making it easier for team members to track and understand bug fixes, and decisions made around coding, architecture, and user design.
7 diagrams for software development
Coordination and collaboration are critical to success during the software development life cycle. Software architecture diagrams play a crucial role in maintaining both at all SDLC stages because they provide a visual representation of the complex concepts that exist within a development lifecycle, and allow all stakeholders—regardless of technical knowledge—to understand the plan and contribute to the process.
Here are seven diagram types that can be used at each stage of the SDLC to keep teams aligned and on track.
1. Use case diagrams
Use case diagrams illustrate interactions between users and systems, and identify functional requirements from the end-user’s perspective. These are used during the requirements gathering phase to ensure all product considerations are captured, and that stakeholders are aligned on scope.
Try Miro’s use case diagram templates.
2. Swimlane diagrams
Used during project planning, swimlane diagrams are a visual tool to assign responsibilities to teams and departments for each SDLC stage. Swimlane diagrams provide a simple visual representation of how each team member fits into the bigger SDLC picture, and where they’re involved in the production process.
Project teams may also use Gantt charts alongside swimlane diagrams during the planning phase to map out project tasks, milestones, and dependencies throughout the SDLC.
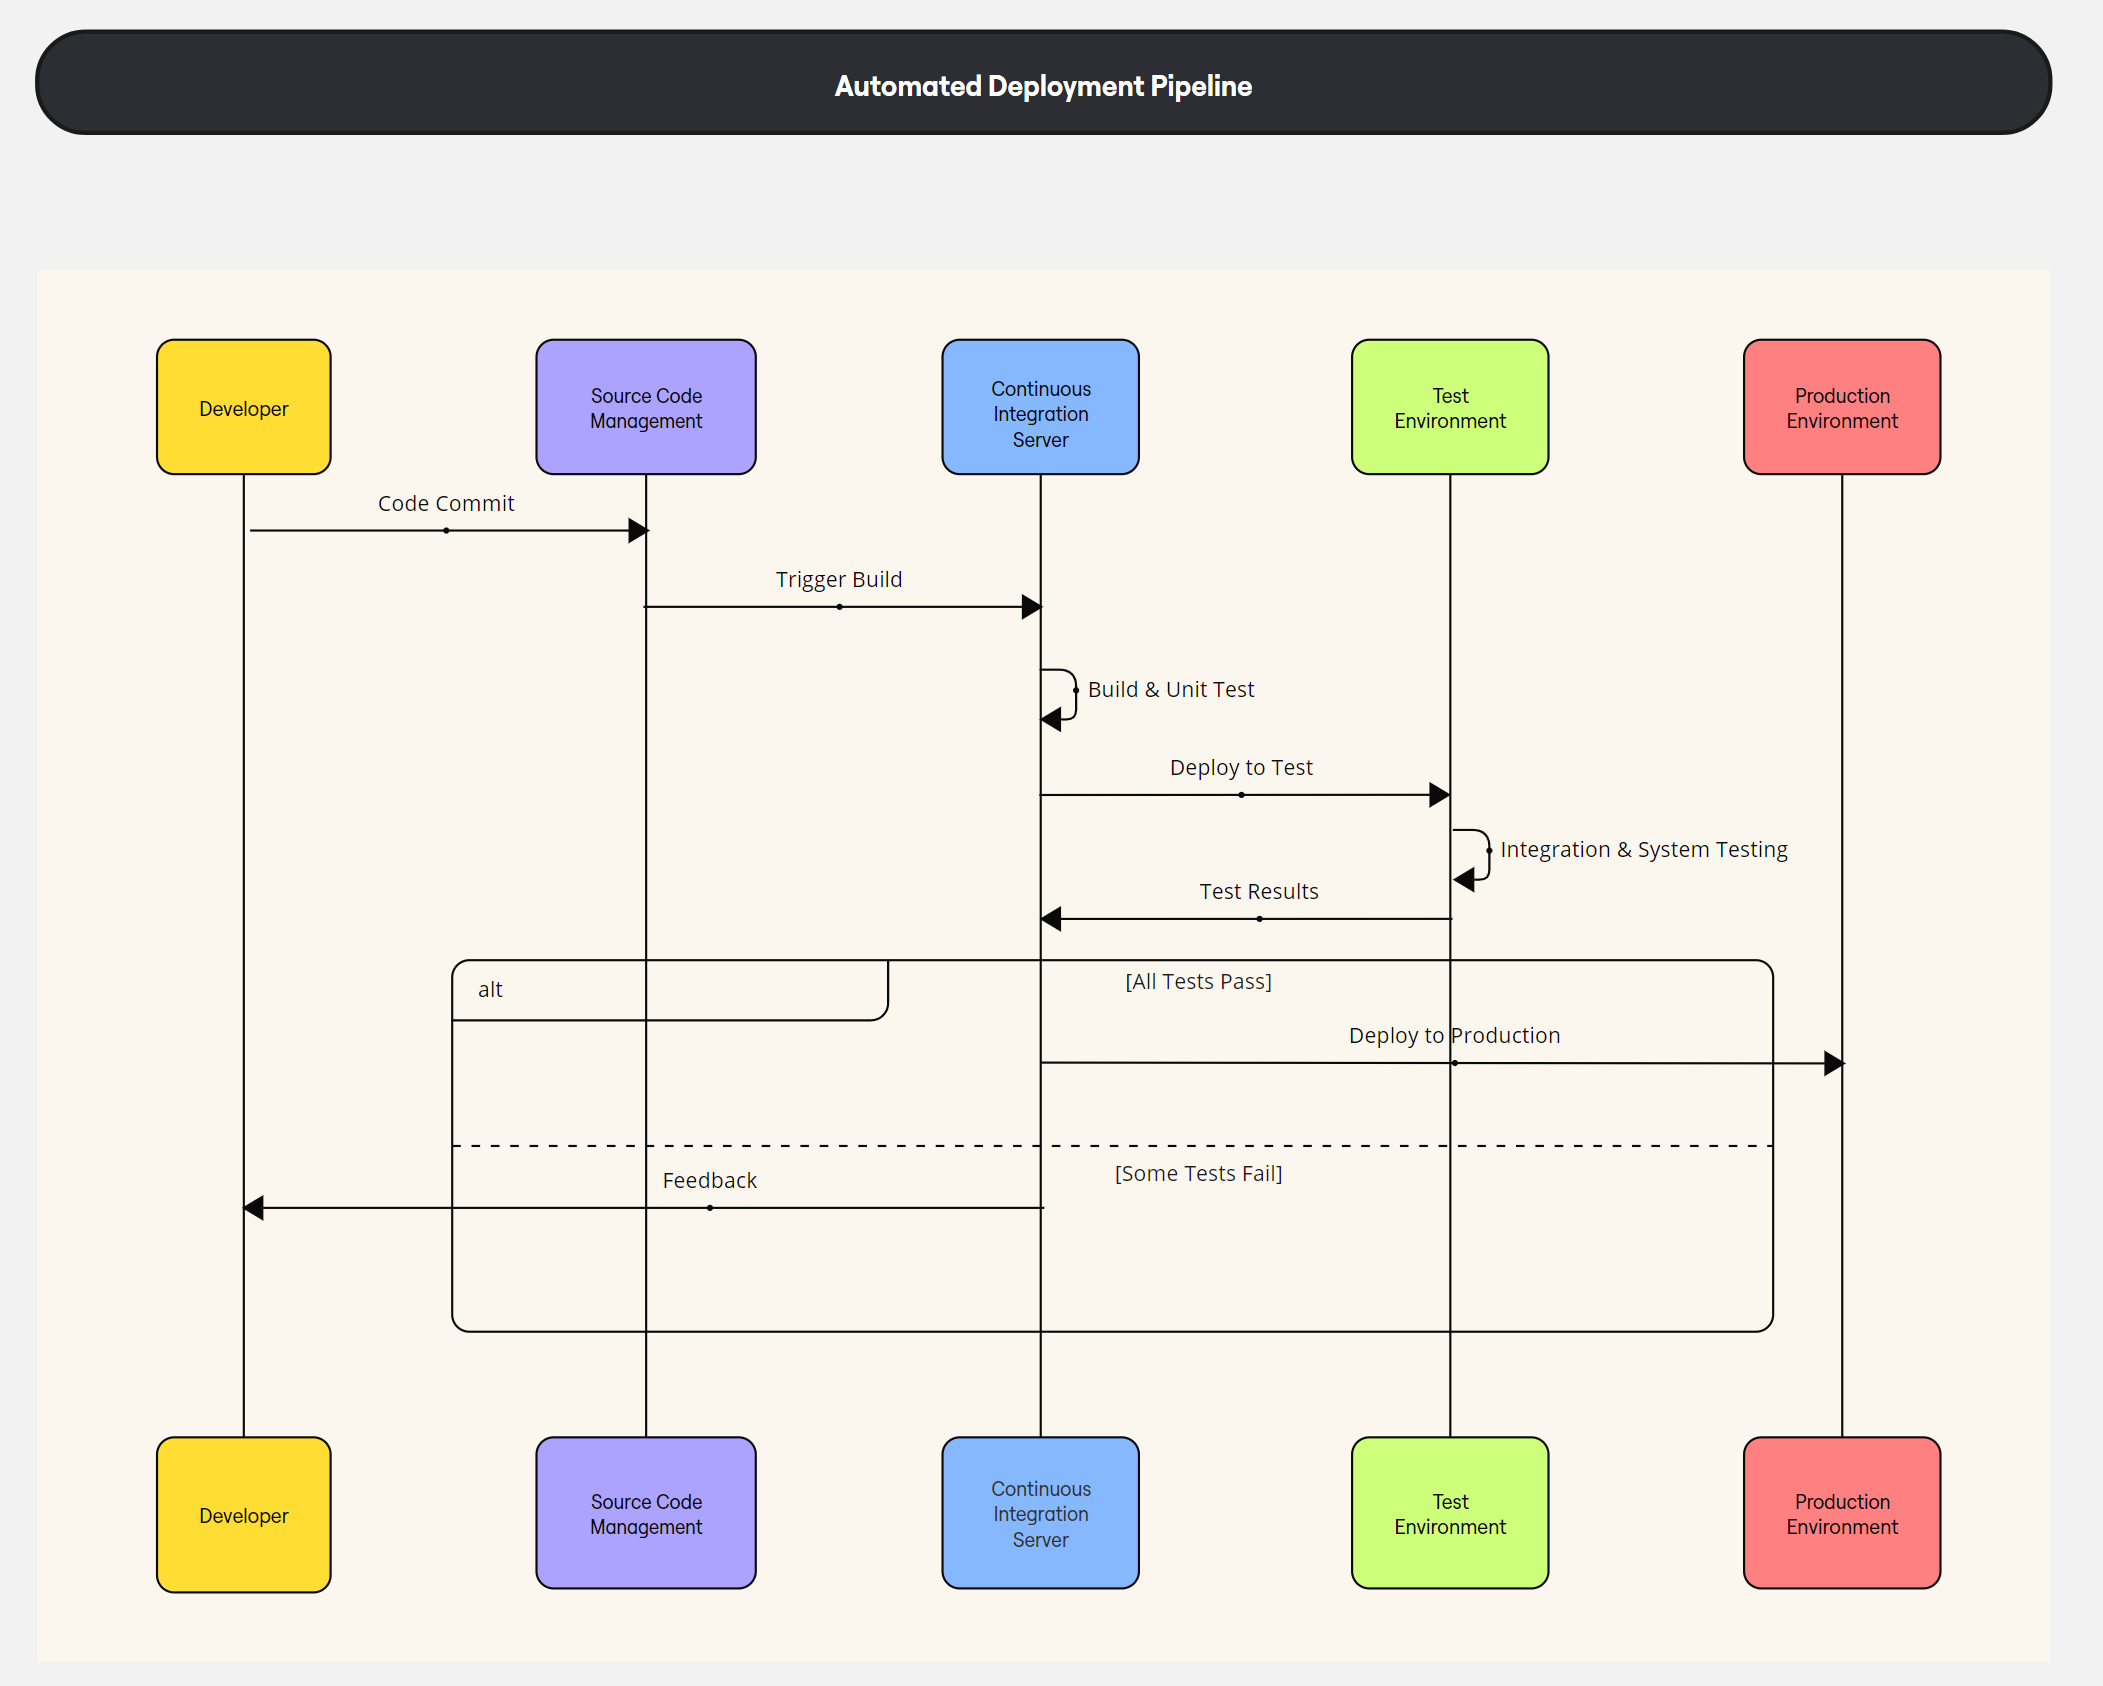
3. Sequence diagrams
Sequence diagrams are one of many visual tools that can be used during the design phase to map out software architecture. They show how software objects and features interact in a particular sequence, helping designers and developers understand the dynamic behavior of the system they’re building.
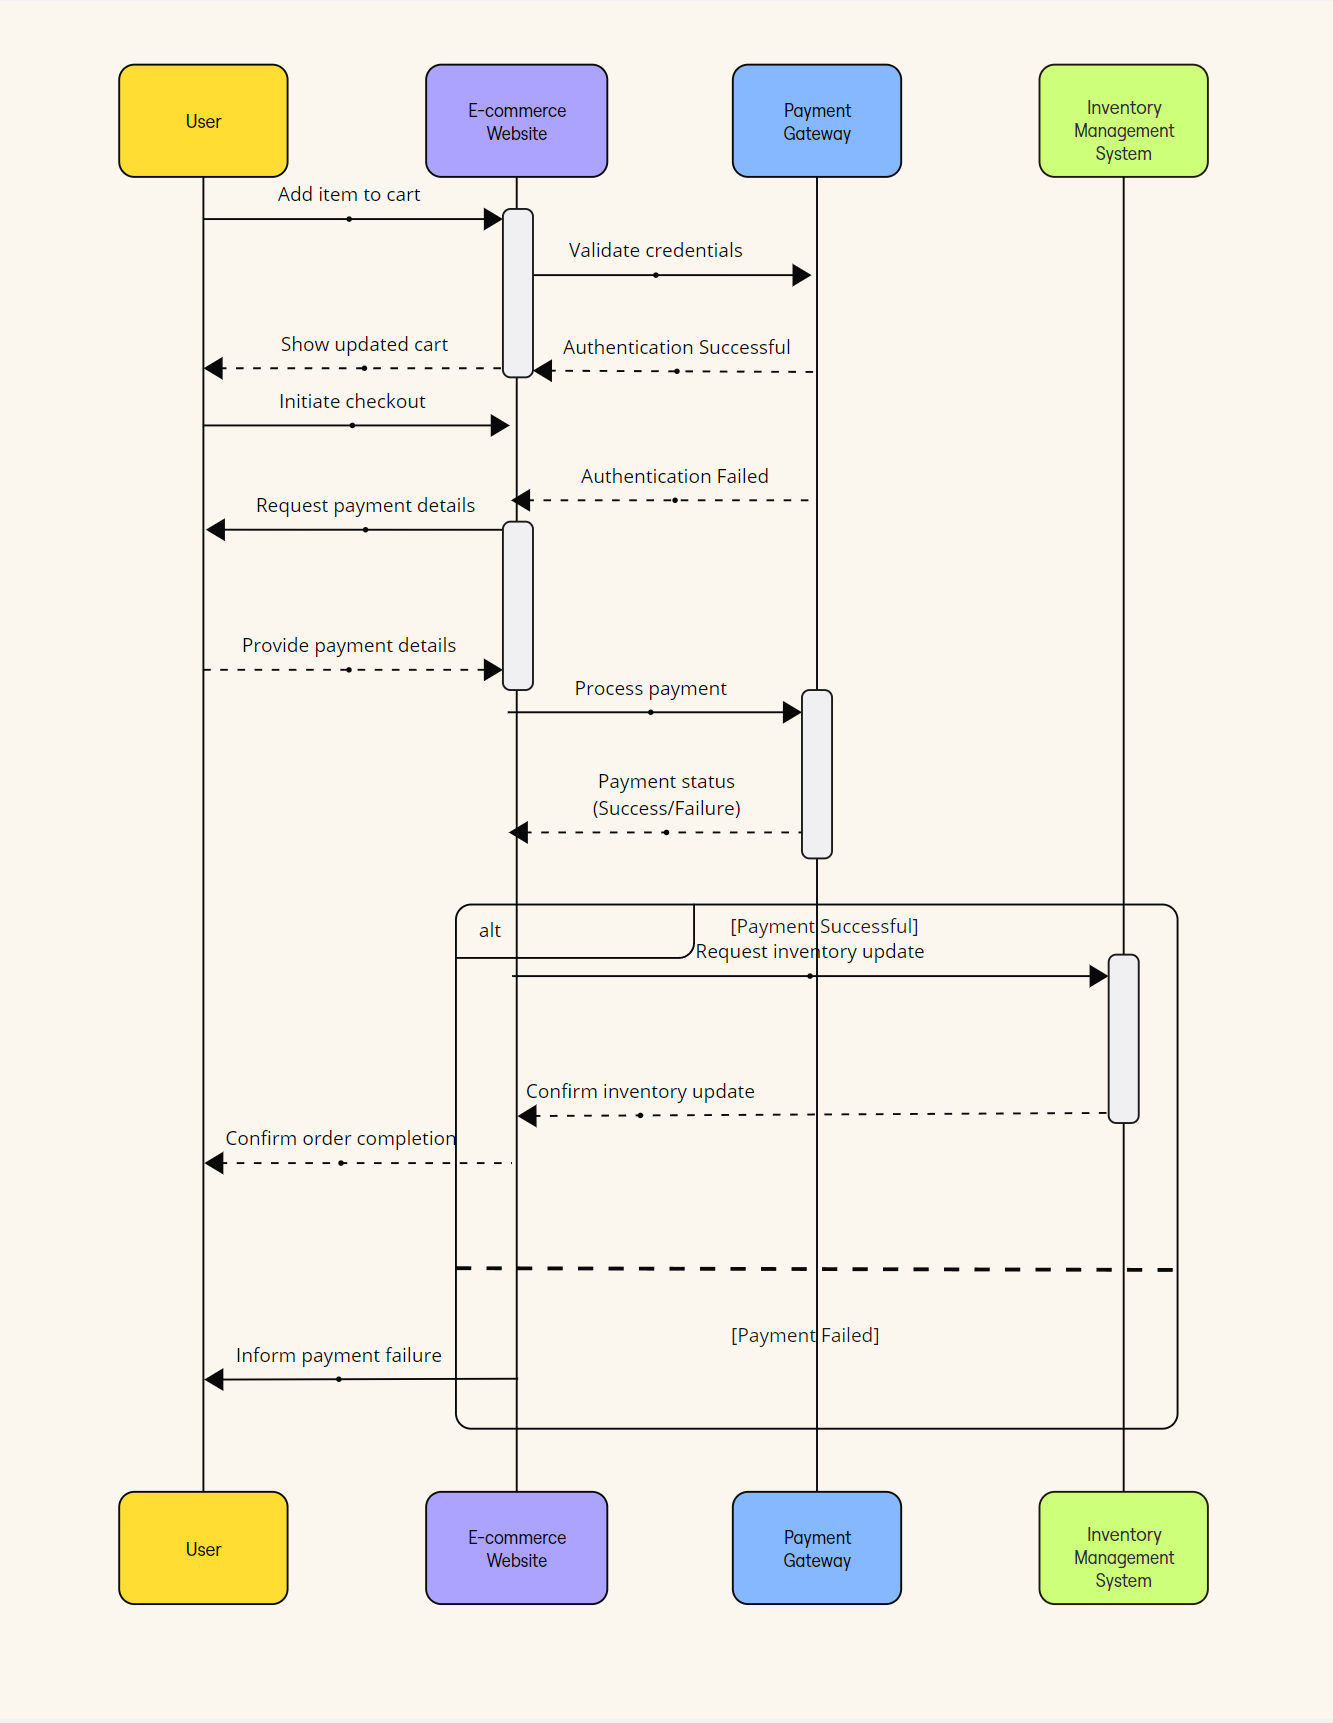
Other design phase diagrams include entity-relationship diagrams—which help users understand how elements in a database interact with each other—and UML class diagrams—which help users visualize and plan object-oriented software systems.
4. Activity diagrams
Activity diagrams are another visual tool that help developers visualize and understand the workflow, logic, and sequencing of an application’s features. Developers typically use these diagrams to gain a high-level understanding of the system they’re building, and to ensure that they write code that operates properly in that environment.
5. Flowcharts
Flowcharts are another way to illustrate intended software processes and workflows. They’re often They can be used during the QA testing phase to design comprehensive test scenarios. This ensures comprehensive test coverage — from a variety of different angles — and clear communication between QA testers and developers.
6. Deployment diagrams
Deployment diagrams visually represent how the software will be deployed across hardware or cloud servers, along with configurations between nodes and modules. This helps teams both plan and understand the distribution of their software, and the required infrastructure, before deployment begins.
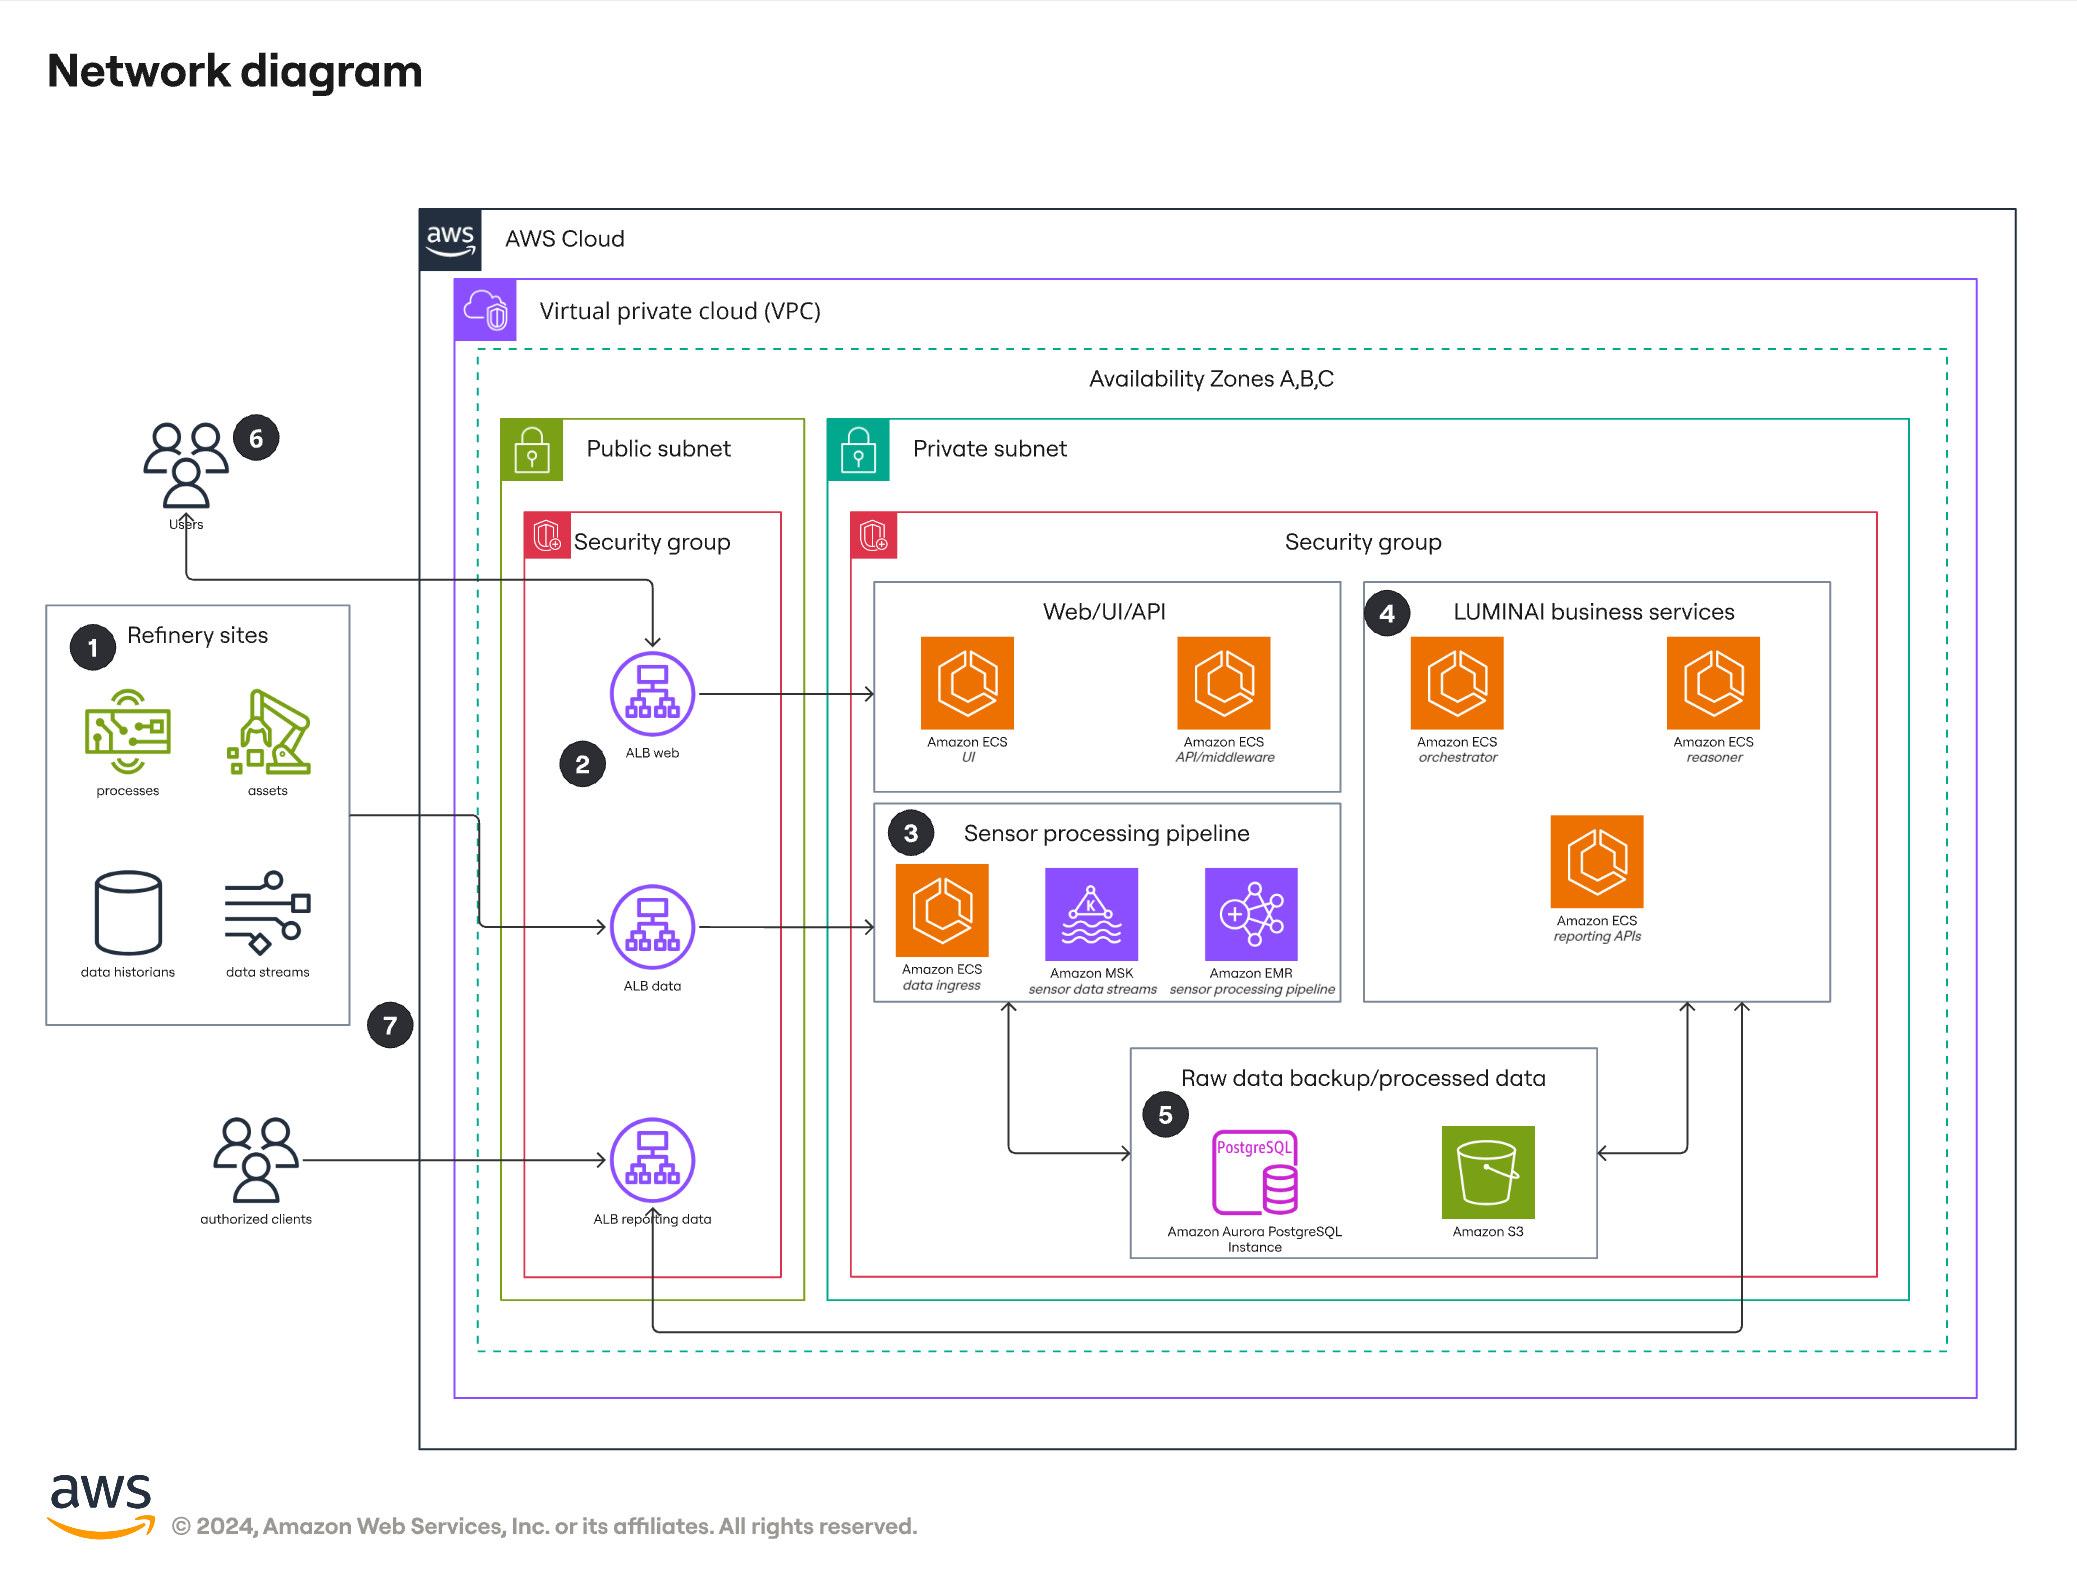
7. Network diagrams
Network diagram templates help to visualize the entire scope of a company’s network architecture, connections, and individual applications. This is critical for ongoing maintenance, allowing teams to troubleshoot issues, plan for system updates and expansions, and understand the impact of changes to their software.
Enhancing SDLC collaboration with Miro
It’s simply impossible for development teams to be successful throughout an SLDC without strong collaboration, visualization, and documentation. That’s where collaborative diagramming comes in, which can help them visually map out all requirements, dependencies, and relationships within a given workflow or project stage, and visualize the project at both a macro and micro level.
Miro’s SDLC template, for example, acts as a dashboard that tracks progress toward each stage of the SDLC. It maps the overall process through each stage, breaks down task load by department and team, and helps teams track progress toward timeline and goals.
By centralizing this information, SDLC teams ensure that all planning materials and documentation are visible throughout the process. And with Miro’s collaborative editing abilities, teams can contribute and expand on project documents in real time or asynchronously.
This alignment around centralized and collaborative documents is critical for software teams, of course, but it also allows them to reliably communicate with business teams like product, design, sales, and marketing. Ultimately, it enables faster reviews, input, and approvals across the business, making the end-to-end process more transparent and efficient.
Software projects are complex, with many stakeholders involved across the organization.. Collaborative diagramming tools like Miro help to ease this complexity and unlock greater alignment across teams and stakeholders from the early stages of the development lifecycle through to ongoing application maintenance.
By easing software complexity in favor of clarity and alignment, Miro helps teams build the right products that will delight their customers and drive their businesses toward their strategic goals.

