Since Gantt charts were first developed by Henry Gantt around 1910, they’ve become a popular choice for people who need to organize and display a project plan. A basic Gantt chart contains a horizontal bar that represents your progress on the project over time. The chart is then further divided up into tasks that you can track as you work through the project.
Gantt charts are intuitive and easy to share among team members and stakeholders. That makes them an excellent tool for collaboration.
In this blog, you’ll learn everything there is to know about Gantt charts: what they are, how to make one, and when to use them. By the end of the blog, you’ll be able to create Gantt charts for your own projects.
Evan Roxanna Ramzipoor is a writer based in California. She is the author of The Ventriloquists, and her writing has been featured in McSweeney’s, Salon, and others.
Gantt chart 101
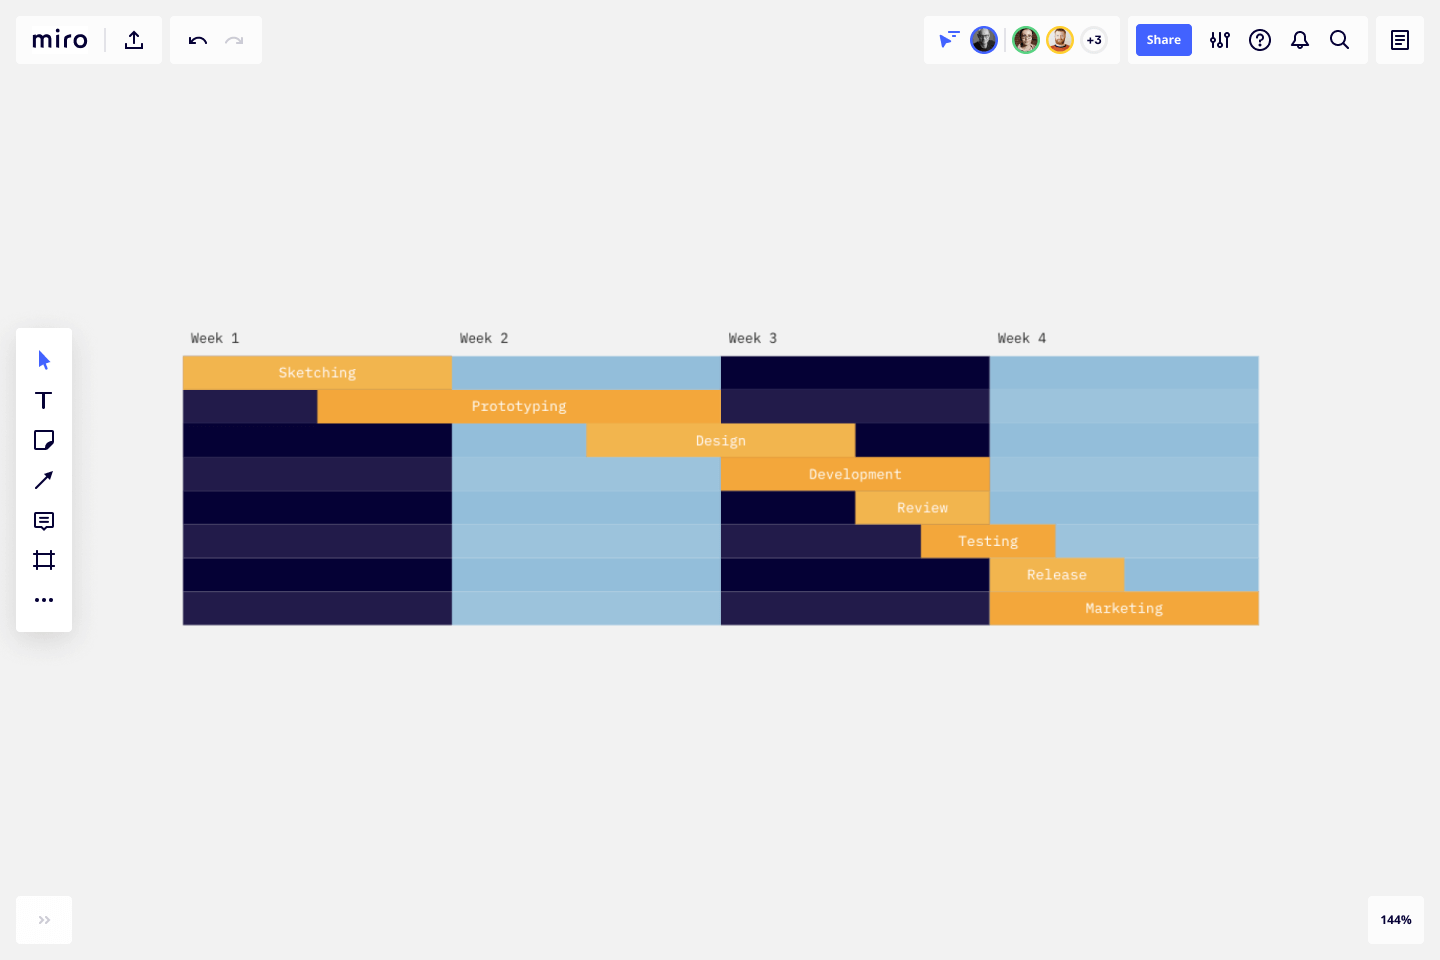
A Gantt chart is a powerful graphical tool that enables teams to track their progress on a project. Typically, a Gantt chart is a bar chart composed of two axes. On the horizontal axis, the chart depicts the timeframe in which you plan to work on the project. On the vertical axis, the chart shows the individual tasks that go into the project, as well as their status, who they’re assigned to, and how long each one will take to complete.
Gantt charts use something called an “early start time approach,” meaning each task is scheduled to start immediately after all dependencies are complete. That way, you can easily see any blockers that are preventing the project from progressing.
Henry Gantt designed the chart in the early 1900s to track employee productivity. Since then, Gannt charts have become one of the most widely used management tools in the world.
Why use a Gantt chart?
A Gantt chart is powerful because it’s a type of visual task management tool. Visual task management is a technique for managing work. Instead of relying on dozens of to-do lists or tracking due dates across spreadsheets, file folders, and your inbox, you can track your work using an intuitive visual tool. Gantt charts are intuitive precisely because they are visual; they allow you to see everything laid out clearly in one place, a single source of truth for your team.
Because they’re so intuitive, Gantt charts can help you save time. They reduce the number of hours you spend searching for information or chasing down collaborators to ask about the status of a task and whether they need anything to continue working.
A Gantt chart enables you to reduce waste by improving communication across teams. By ensuring everyone is on the same page, you can spend less time on guesswork and more time getting work done. If used correctly, a Gantt chart can simplify even the most complex project so that it’s easy to understand at a glance.
When do you use a Gantt chart?
Gantt charts have a wide variety of applications. Use a Gantt chart whenever you need to plan projects for your team, schedule your time, assign responsibilities, track dependencies, and see how your tasks are progressing over time. Importantly, Gantt chart makers are useful tools for teams and collaborators, since they’re shareable, visual, and customizable.
There are numerous benefits to using a Gantt chart. You can seamlessly track your progress, evaluate the resources you need to execute a task, and streamline team communication. That’s why they’ve become such an enduringly popular choice for teams worldwide.
How do you make a Gantt chart?
Making a Gantt chart is easy. There are six simple steps you can use to get started. After that, you and your team can iterate on the chart as you work through your project.
First, you put the tasks in the right order. Second, you decide on the types of relationships between tasks: whether you can’t start the successor task until its predecessor is finished, whether you can’t start the successor task until the predecessor has started, whether you can’t finish the successor task until the predecessor has started, or whether you can’t finish the successor task until its predecessor has finished.
- Review the scope of your project. Get your team together to agree on the scope of the project you’re working on, including the goals you are trying to accomplish and the goals you’re saving for later; how the work is going to break down among team members; any key dependencies, and the resources you’ll need to accomplish your goals.
- Break the project up into tasks. Tasks — otherwise known as activities — are the individual components that make up the project. Try to aim for a manageable number of tasks: not so many that the scope of the project balloons out of control, but not so few that the project remains intractable.
- Sequence tasks. Each task, except for the first and the last, is related to the other tasks in the sense that you must complete one before you can move onto another.
- Estimate the resources you’ll need to complete the project. Resources include labor, materials, and equipment. You can then include those estimates in your Gantt chart so you can track whether you’re overusing resources.
- Estimate how long it will take to complete the project. After going through your resources, dependencies, and tasks, estimate the duration for each task. The duration is the length of time between the start and end of a task. Then incorporate those durations into your chart.
- Once everything is recorded in your Gantt chart, review the schedule you’ve created. Double check to ensure that all contingencies have been included and that each task has a stakeholder attached to it. Share your Gantt chart with collaborators to ensure everyone is on board with the schedule, knows what role they play, and understands each task.
Gantt Chart Example
Here’s one great example of a Gantt Chart Template to help you hit the ground running. When you’re ready to make your own, go to Miro’s Template Library and find everything you need to get started!