Table of contents
Table of contents
Step-by-step process mapping examples to boost your organization productivity
Summary
In this guide, you will learn:
- Why visual collaboration transforms process mapping from static documentation into dynamic team alignment that drives measurable results
- How to identify which processes to map first and set specific, trackable goals for improvement
- The standard symbols and notation that make process maps universally readable across teams and departments
- When to use each process map type: basic flowcharts, swimlane diagrams, BPMN diagrams, value stream maps, and user flow maps
- Real-world examples of how product, operations, engineering, and healthcare leaders use process mapping to accelerate delivery, reduce costs, and improve outcomes
- How Miro AI accelerates process mapping by generating maps from text, identifying bottlenecks automatically, and suggesting optimizations
- Common mistakes that undermine process mapping effectiveness and practical solutions to avoid them
- Best practices for collaborative mapping, including remote team workflows and connecting documentation to execution
Collaborative AI Workflows
Join thousands of teams using Miro to build the right thing, faster.
Imagine you're about to embark on a new project, and you need to get everyone on the same page. What if you could visualize each step, spot inefficiencies, and streamline the entire process? Enter: process mapping. Whether you're in manufacturing, healthcare, retail, non-profit, or SaaS, process maps are your secret weapon to success.
Identify your processes: Where to begin
So, you've decided to dive into process mapping. But where do you start? The first step is identifying the processes you want to map out. It might be overwhelming, but don't worry; it's simpler than it seems. Here are the steps to begin your process mapping journey:
Step 1: Define your objectives
Start by pinpointing the critical processes that drive your business. Think about the workflows that impact your goals the most. Are you looking to improve efficiency, enhance communication, or ensure compliance? Clearly define what you hope to achieve with your process map. The best candidates for process mapping are processes with:
- Multiple departments involved (cross-functional complexity)
- Frequent bottlenecks or delays (operational inefficiency)
- High error rates or rework cycles (quality issues)
- New team members struggling to understand flow (onboarding friction)
- Unclear accountability for steps (ownership gaps)
Don’t map processes just because they’re there. Focus on mapping processes where improvements will lead to real results, like faster delivery, lower costs, better quality, or stronger team alignment.
Step 2: Define specific, measurable goals
“Improve efficiency” isn’t a goal—it’s a hope. Set objectives you can track:
- Reduce order processing time from 5 days to 2 days
- Eliminate 3 redundant approval steps in the hiring workflow
- Decrease defect rates from 8% to 3% in production
- Cut customer onboarding time from 12 days to 4 days
Clear goals help keep mapping sessions on track and give you a way to measure progress.
Step 3: Gather the right team
Process mapping works when everyone who touches the process contributes. For each process, include:
- People doing the work: Frontline team members who execute tasks daily
- Process owners: Managers who oversee the workflow
- Cross-functional stakeholders: Anyone who hands work to or receives work from this process
- End users or customers: When possible, include people affected by the process outcome
Keep teams between 5 and 12 people. Fewer than 5 means you’ll miss important viewpoints, while more than 12 makes coordination harder.
Step 4: Map current state first
Always start by documenting how the process works today before planning any changes. This “as-is” map shows hidden steps, workarounds, and bottlenecks you won’t find in org charts or job descriptions.
Use Miro’s templates to map the current state together. Teams working at the same time on a shared canvas can document processes three times faster.
Step 5: Identify inputs, outputs, and metrics
For each step in your process, determine:
- Inputs: What resources, information, or materials are required?
- Outputs: What results, products, or deliverables are produced?
- Metrics: How do you measure success at this step?
Example: In a customer onboarding process, one step might be “Send welcome email.”
- Input: Customer contact information from CRM
- Output: Automated welcome email with next steps
- Metric: Email open rate within 24 hours
Step 6: Analyze and optimize
With your current-state map complete, look for:
- Bottlenecks: Steps where work piles up or waits
- Redundancies: Duplicate activities or unnecessary handoffs
- Decision delays: Approval steps that slow progress without adding value
- Communication gaps: Places where information gets lost between teams
Create a “to-be” map that shows the improved process. Try out changes on a small scale before rolling them out fully.
Use Miro's advanced diagramming capabilities and templates to make this task easier. Ensure that all steps, inputs, outputs, and metrics are clearly represented.
Step 7: Review and refine
Review the initial process map with your team. Gather feedback and make necessary refinements. Ensure that the map accurately reflects the current state of the process and addresses any identified issues.
Step 8: Implement and monitor
Process maps aren’t just a one-time task. Put your improved process into action, track the metrics you set earlier, and review the map every quarter to keep making improvements.
Process mapping basic symbols and notation
Process maps use standard symbols to make workflows clear for everyone across teams and departments. These symbols act as a shared language. Once everyone knows them, you can map any process, simple or complex.
Ovals: Start and end points
Ovals mark where a process begins and where it concludes. Every process map needs exactly one start point and at least one endpoint.
Example: Start = “Customer places order” | End = “Product delivered”
Rectangles: Tasks and activities

Rectangles represent individual tasks or activities. Each rectangle should contain a single, clearly defined action starting with a verb.
Example: “Review application” | “Schedule interview” | “Send confirmation email”
Diamonds: Decision points

Diamonds indicate decisions requiring yes/no choices or multiple options. These are the crossroads where a process can take different paths based on conditions.
Example: “Budget approved?” → Yes path continues to “Begin project” → No path goes to “Revise proposal”
Arrows: Flow direction
Arrows show the sequence and direction of the process, guiding you from one step to the next. Arrows should always point in the direction work flows—typically left to right or top to bottom.
Additional symbols for complex processes
- Parallel lines (subprocess): Indicates a step that contains its own detailed process map
- Document icon: Represents paperwork, forms, or documentation produced
- Database cylinder: Shows data storage or retrieval points
- Circle with line (delay): Marks waiting periods or scheduled pauses
Using these standardized symbols ensures anyone in your organization can follow a process map, whether they helped create it or are seeing it for the first time. Miro’s diagram library includes all standard process mapping symbols, making it easy to maintain consistency across your team’s documentation.
When to use which process map type
Different processes need different mapping approaches. Here’s how to choose the right type for your situation:
When to Use Which Process Map Type
Dimension | Basic Flowchart | Swimlane Diagram | BPMN Diagram | Value Stream Map | User Flow Map |
Process Map Type | Basic Flowchart | Swimlane Diagram | BPMN Diagram | Value Stream Map | User Flow Map |
Best For | Sequential workflows, onboarding processes, simple documentation | Cross-functional handoffs, accountability mapping, multi-team workflows | Complex operations, compliance documentation, enterprise processes | Lean initiatives, waste reduction, manufacturing optimization | Customer journeys, UX optimization, service design |
Complexity | Low | Medium | High | High | Medium |
Team Size | 2-5 people | 5-15 people | 15+ people | Any size | 3-8 people |
Key Benefit | Quick to create, easy to understand | Clarifies who does what and when | Standardized notation for technical precision | Identifies non-value-added steps | Customer-centric view of experience |
Primary Use Case | Document simple, linear processes | Show responsibilities across departments | Technical documentation with precise notation | Eliminate waste and optimize flow | Map customer or user interactions |
Typical Symbols | Ovals, rectangles, diamonds, arrows | Lanes, ovals, rectangles, diamonds, arrows | Events, gateways, activities, flows, artifacts | Process boxes, inventory triangles, time metrics, value streams | Screens, actions, decision points, user paths |
Learning Curve | Low (intuitive for beginners) | Medium (requires understanding of roles) | High (standardized notation to learn) | High (lean methodology knowledge needed) | Medium (UX perspective helpful) |
Time to Create | 15-30 minutes | 30-60 minutes | 1-3 hours | 2-4 hours | 30-90 minutes |
Detail Level | High-level steps | Detailed with role assignments | Very detailed with technical precision | Detailed with time and value metrics | User action focused |
Common Industries | All industries, training, onboarding | Product development, operations, project management | Finance, healthcare, manufacturing, compliance-heavy industries | Manufacturing, supply chain, lean organizations | Software, SaaS, digital products, service design |
Focus Area | Process steps and sequence | Accountability and handoffs | Technical accuracy and compliance | Value delivery and waste elimination | User experience and interaction |
Metrics Tracked | Number of steps, cycle time | Handoff delays, role utilization | Process compliance, error rates | Lead time, cycle time, value-added ratio | Conversion rates, drop-off points, user satisfaction |
When to Evolve To | Swimlane when multiple teams involved | BPMN when technical precision needed | Start here for complex enterprise processes | Start here for lean transformation | Start here for customer-facing processes |
Miro Template | Process Map | Swimlane Diagram | BPMN Diagram | Supply Chain Mapping | User Flow |
Key Question Answered | What are the steps from start to finish? | Who is responsible for each step? | How does this process meet compliance requirements? | Where are we wasting time and resources? | How do users interact with our product or service? |
Decision framework:
- Need to document a simple, linear process? → Start with a basic flowchart
- Multiple departments involved with handoffs? → Use a swimlane diagram
- Trying to eliminate waste and reduce costs? → Create a value stream map
- Mapping customer experience or user interactions? → Build a user flow map
- Compliance or highly technical documentation? → Choose BPMN notation
You can start simple and evolve. Many teams begin with a basic flowchart to understand the process, then create a detailed swimlane diagram to assign accountability.
Process mapping examples by role and industry
Real process mapping addresses specific challenges leaders face. Here’s how different roles use Miro’s collaborative canvas to map processes that drive measurable results.
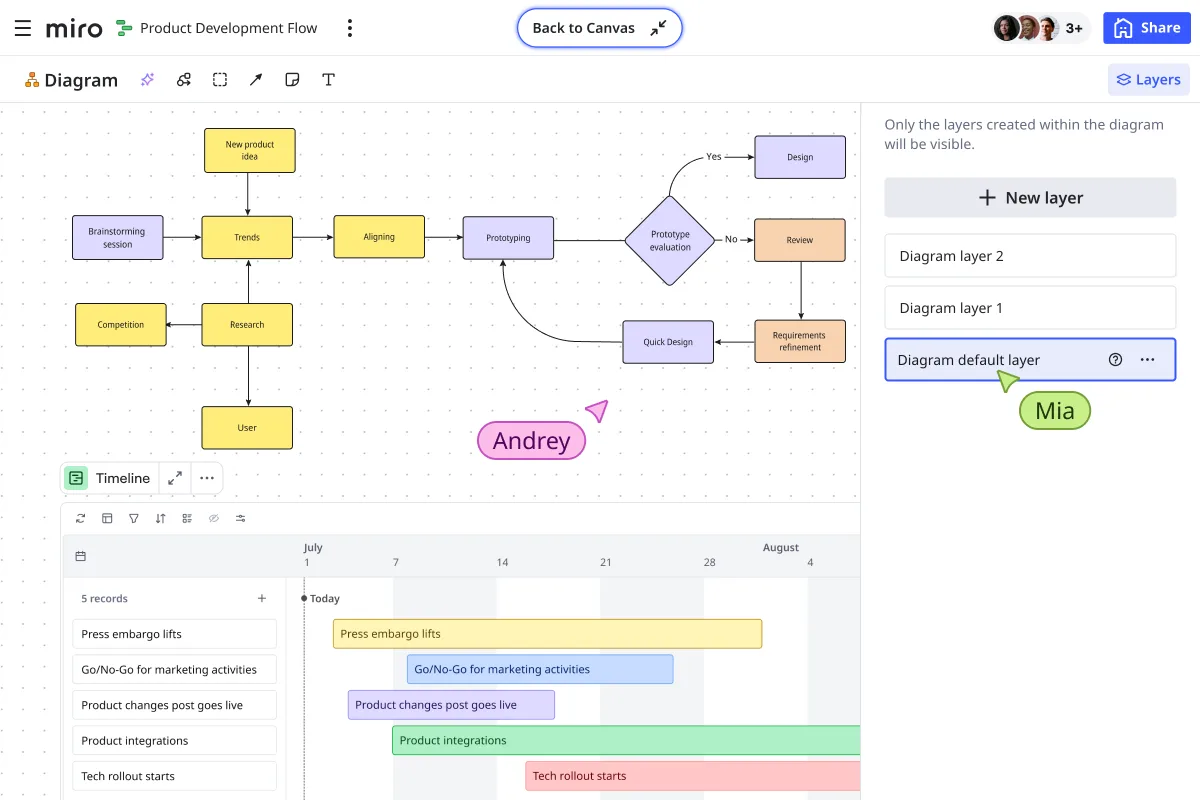
For product leaders: Accelerate product development
Challenge: Feature releases are delayed 3-4 weeks because product, design, and engineering work in separate tools. Specs don’t match prototypes. Developers build features that don’t solve the original customer problem. Every handoff creates miscommunication.
Solution: Product development process mapping with clear handoff points and connected artifacts.
Step-by-step process:
- Define objectives: Reduce time-to-market by 40% and eliminate rework caused by misalignment
- Gather team: Product managers, designers, engineers, QA, and customer success representatives
- Outline steps: Map stages from customer research → opportunity identification → prototyping → technical specification → development → testing → launch
- Identify inputs/outputs: User research insights, design prototypes, technical specs, working code, test results, launched features
- Determine metrics: Cycle time per stage, number of design-engineering iteration loops, feature adoption rates, customer satisfaction scores
- Create a map: Use Miro’s product development process template to visualize the entire lifecycle on one canvas
- Connect artifacts: Link prototypes, specs, and roadmap items directly in the map so everyone works from the same source of truth
- Review and refine: Identify where teams wait for information and where decisions get stuck
- Implement and monitor: Track actual cycle times against targets, adjust handoffs based on data
Miro advantage: Prototypes, Specs, and Roadmaps live in the same workspace as your process map. When design updates a prototype, engineering sees it immediately. When engineering flags a technical constraint, product can adjust scope before wasting time on impossible features.
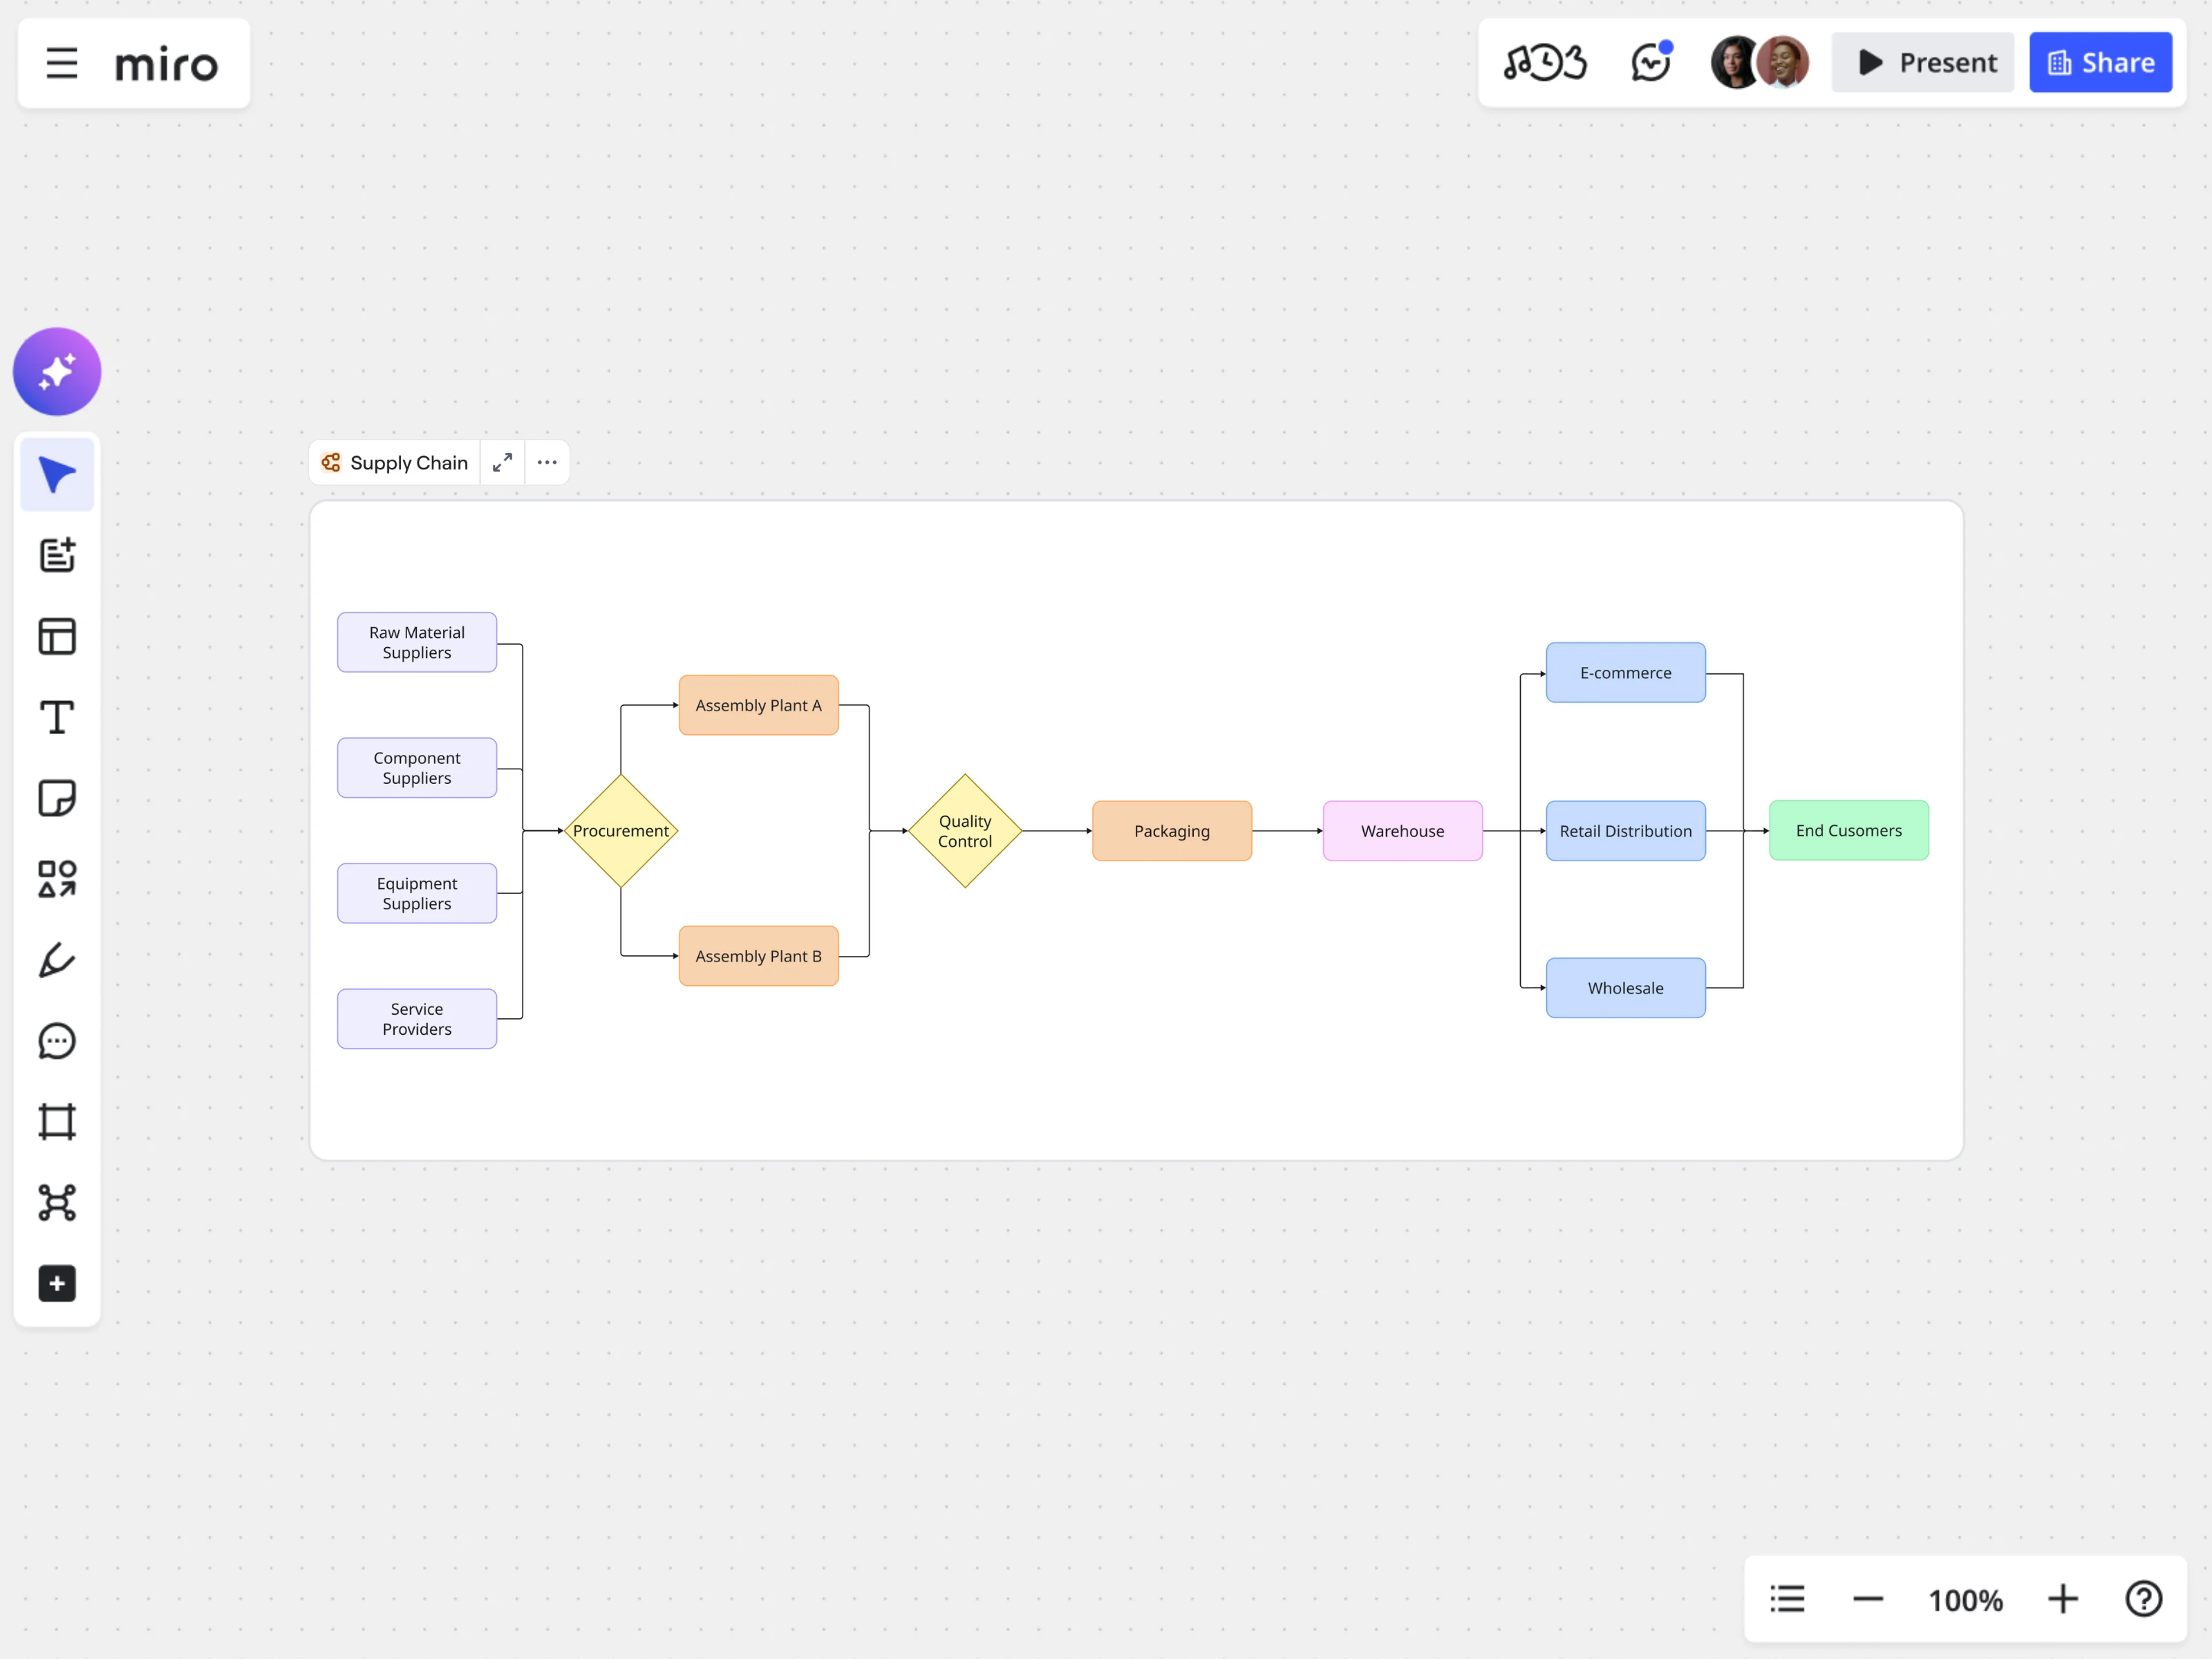
For operations leaders: Optimize supply chain and production
Challenge: Production line defect rates at 8% cause $2M annual waste. Quality inspection happens too late in the process. When defects are caught, no one knows which upstream step caused the issue. Each production shift documents problems differently.
Solution: Value stream mapping to identify waste and standardize quality checkpoints.

Step-by-step process:
- Define objectives: Reduce defects to below 3% and save $1.5M annually
- Gather team: Production managers, line workers, quality control inspectors, maintenance staff, supply chain coordinators
- Outline steps: Map the complete flow from raw material receiving → inventory storage → machining → assembly → quality inspection → packaging → shipping
- Identify inputs/outputs: Raw materials, work-in-progress inventory, finished products, inspection reports, shipped orders
- Determine metrics: Cycle time per station, defect rates by stage, inventory levels, equipment downtime
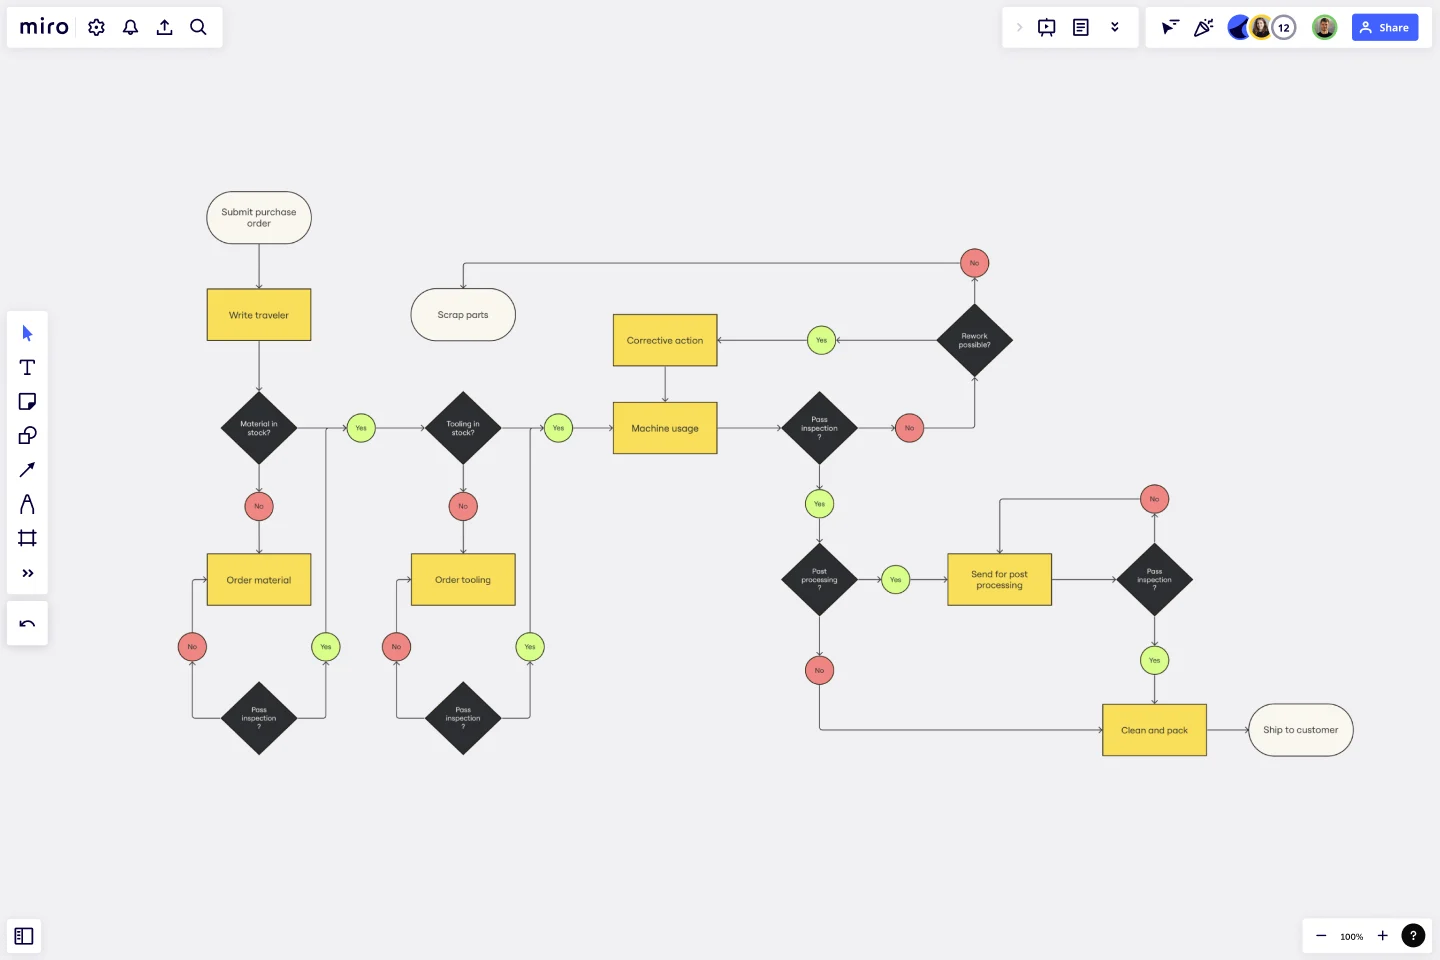
- Create map: Use Miro’s supply chain mapping template to detail each step and flow
- Mark value-added vs. non-value-added: Color-code steps that directly contribute to the final product versus waiting, inspection, or transport time
- Review and refine: Identify where inventory builds up, where quality checks can move earlier in the process, where communication breaks down between shifts
- Implement and monitor: Test changes on one production line, measure defect rate improvements, roll out to full operation
Miro advantage: Engineers and quality teams co-create improvement plans with AI-assisted root cause analysis. When one shift documents a recurring defect, the next shift sees the pattern immediately instead of rediscovering the same issue.
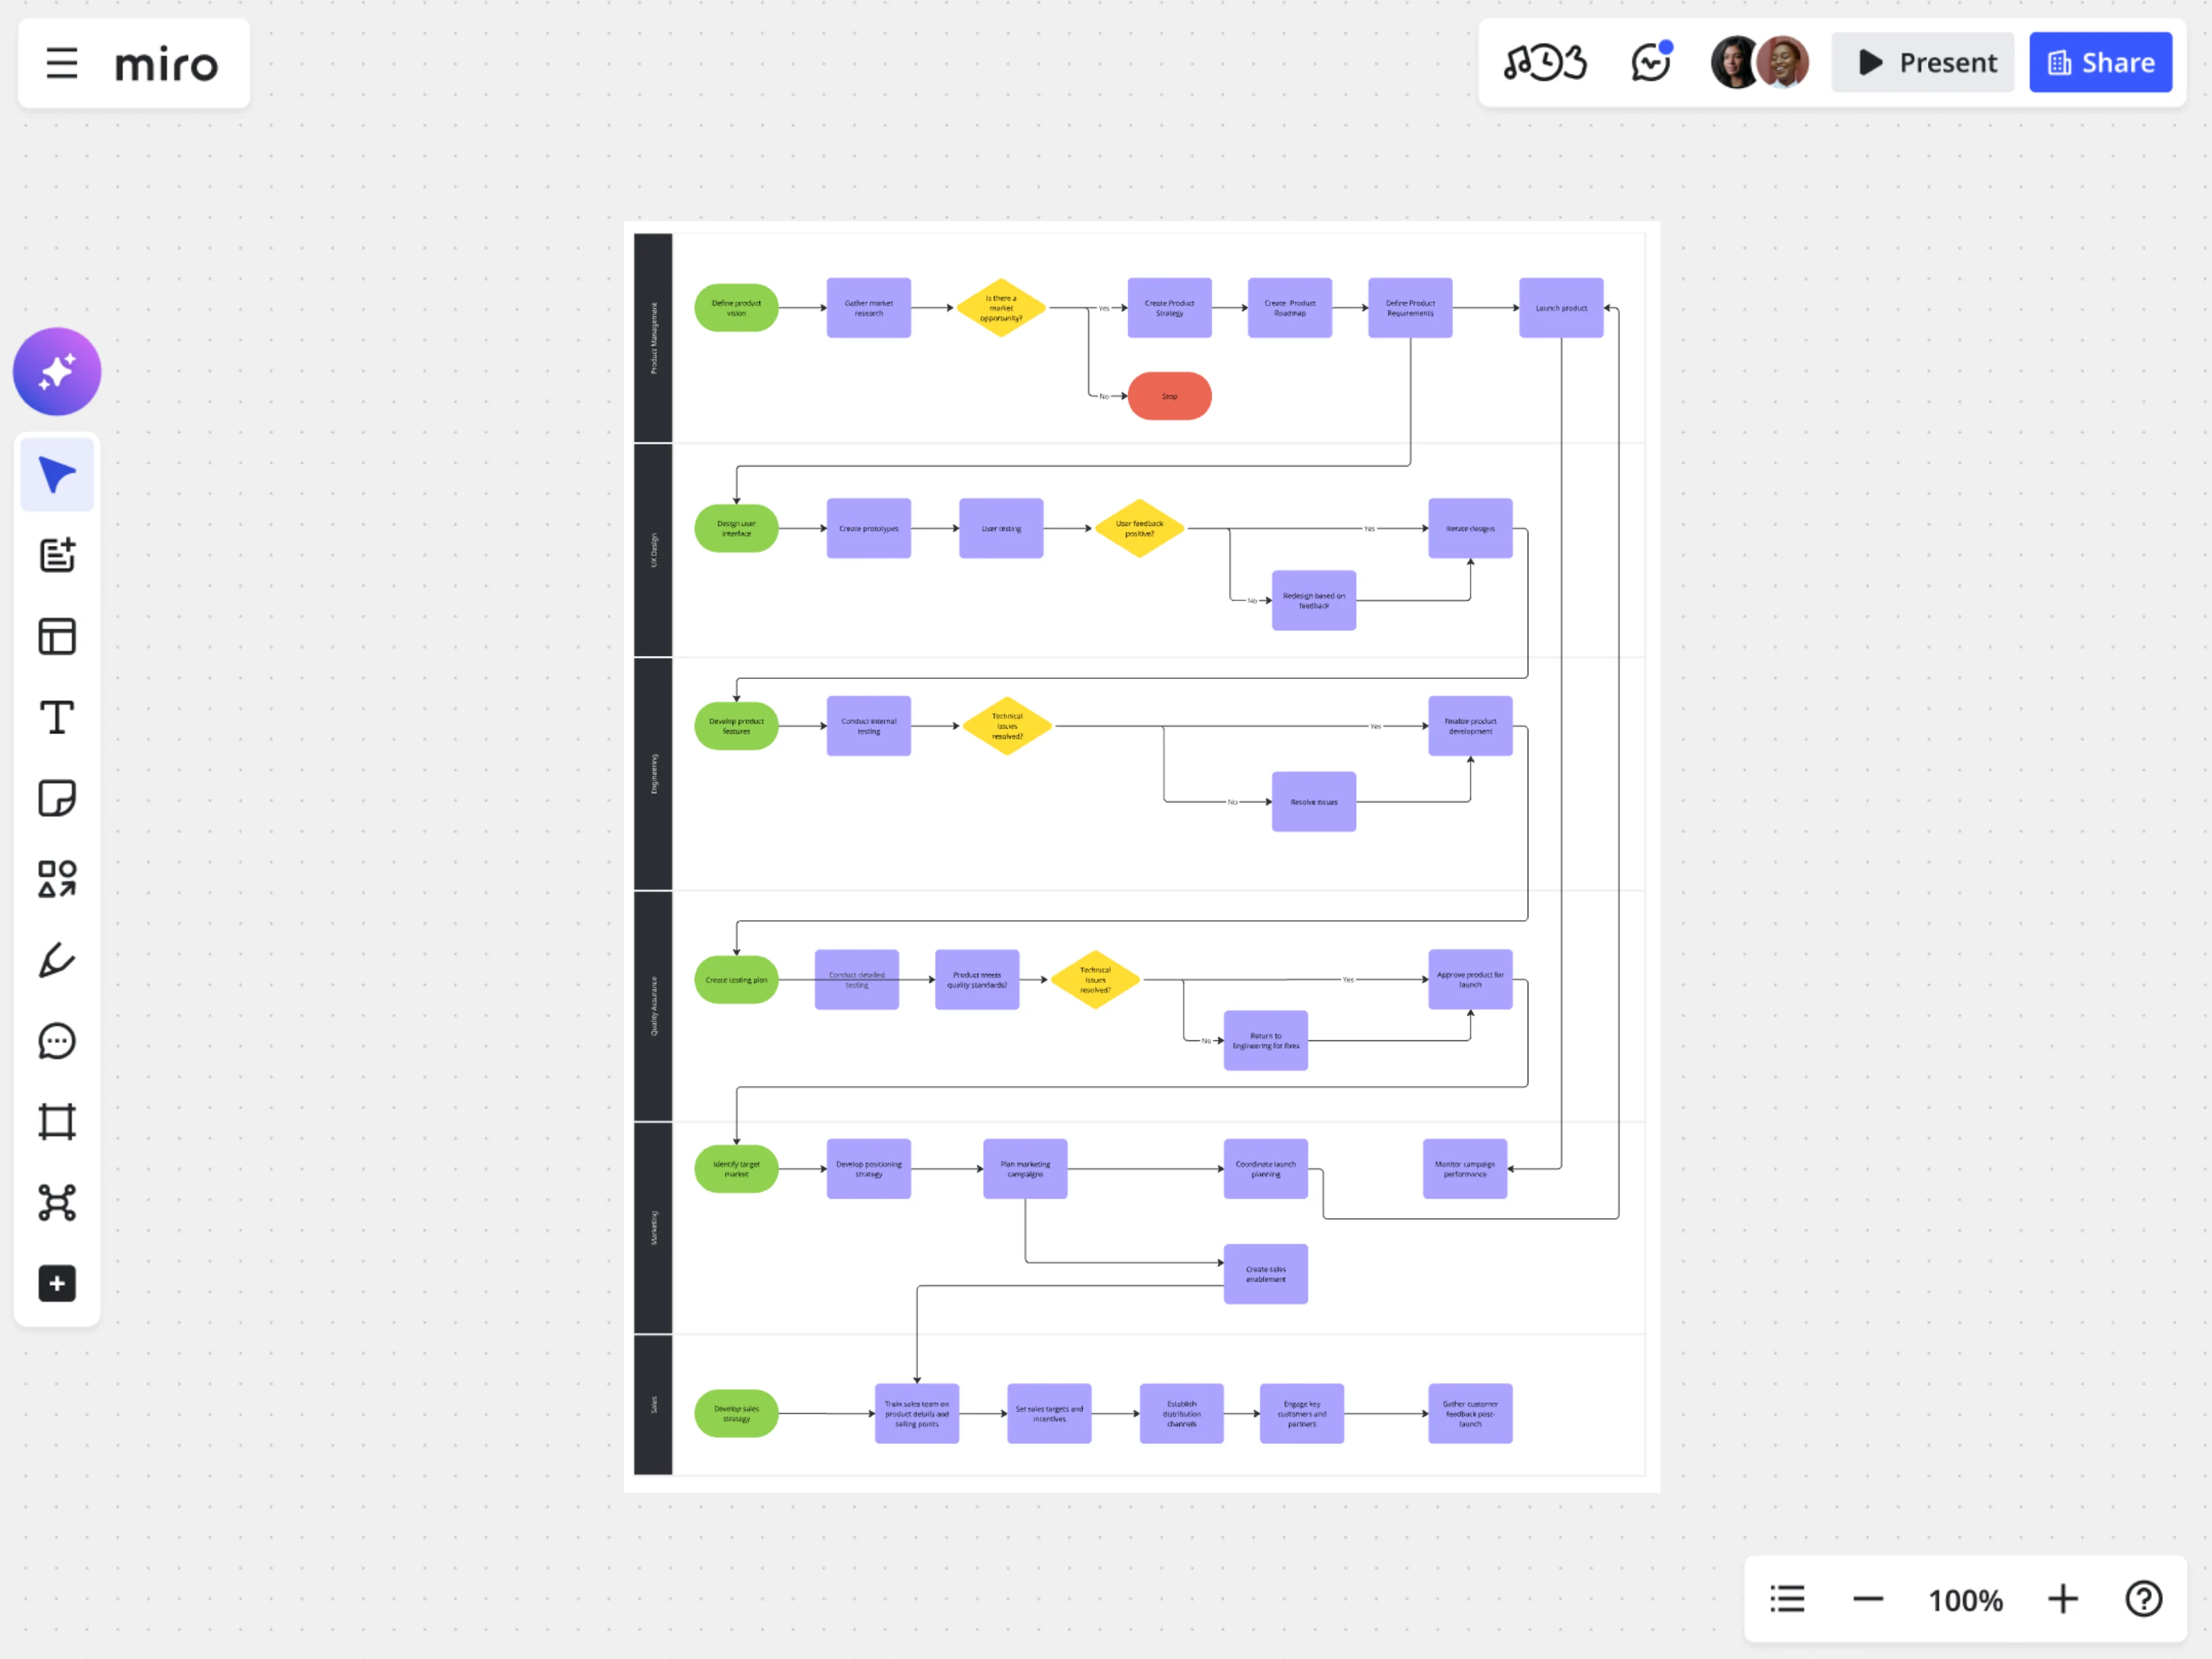
For engineering leaders: Connect strategy to execution
Challenge: Engineering teams build features that don’t align with product strategy. Technical debt accumulates because no one maps dependencies between systems. New engineers take 3 months to understand how services interact.
Solution: Swimlane diagram showing cross-functional workflows with clear technical handoffs.

Step-by-step process:
- Define objectives: Improve project coordination and ensure clear role distribution between frontend, backend, infrastructure, and QA teams
- Gather team: Engineering managers, tech leads, architects, DevOps, and product stakeholders
- Outline steps: Break down feature development into phases—planning, design review, API development, frontend implementation, testing, deployment, monitoring
- Identify inputs/outputs: Product requirements, technical specs, API contracts, code reviews, test coverage reports, deployed services
- Determine metrics: Lead time from commit to production, deployment frequency, change failure rate, time to restore service
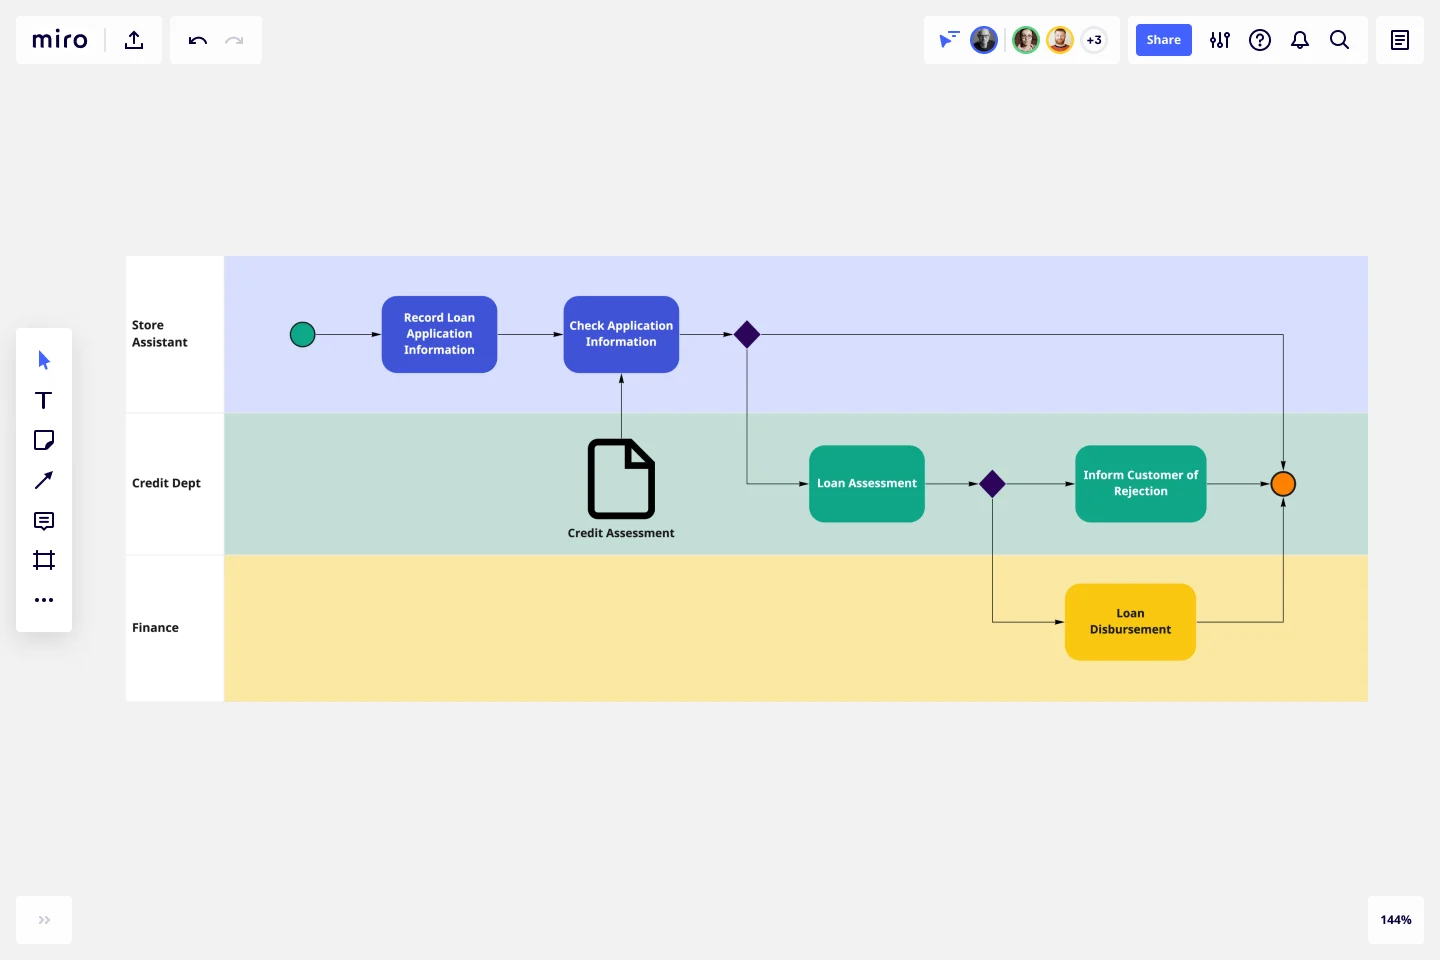
- Create map: Use Miro’s swimlane diagram template to separate responsibilities by team, showing work flow horizontally through lanes
- Review and refine: Ensure all teams understand their roles and dependencies. Identify where work waits for another team’s input
- Implement and monitor: Track DORA metrics (deployment frequency, lead time, MTTR, change failure rate) against the process map
Miro advantage: Specs and Technical Design docs connect directly to the swimlane diagram. When infrastructure changes deployment requirements, every team sees the update in the context of the full workflow.
For healthcare leaders: Improve patient outcomes
Challenge: Emergency department patients wait 45+ minutes on average. Multiple nurses enter the same patient data in different systems. Discharge process takes 2+ hours because paperwork moves sequentially between departments.
Solution: Patient journey mapping reveals redundant data entry and sequential bottlenecks that can become parallel workflows.
Step-by-step process:
- Define objectives: Reduce average wait times by 40% and improve patient satisfaction scores by 15 points
- Gather team: ED physicians, nurses, registration staff, lab technicians, imaging technicians, case managers, IT systems analysts
- Outline steps: Map patient flow from arrival → triage → registration → clinical assessment → diagnostics → treatment → discharge
- Identify inputs/outputs: Patient information, vital signs, lab orders, test results, diagnoses, prescriptions, discharge instructions
- Determine metrics: Wait time at each stage, time to see provider, length of stay, patient satisfaction scores, readmission rates
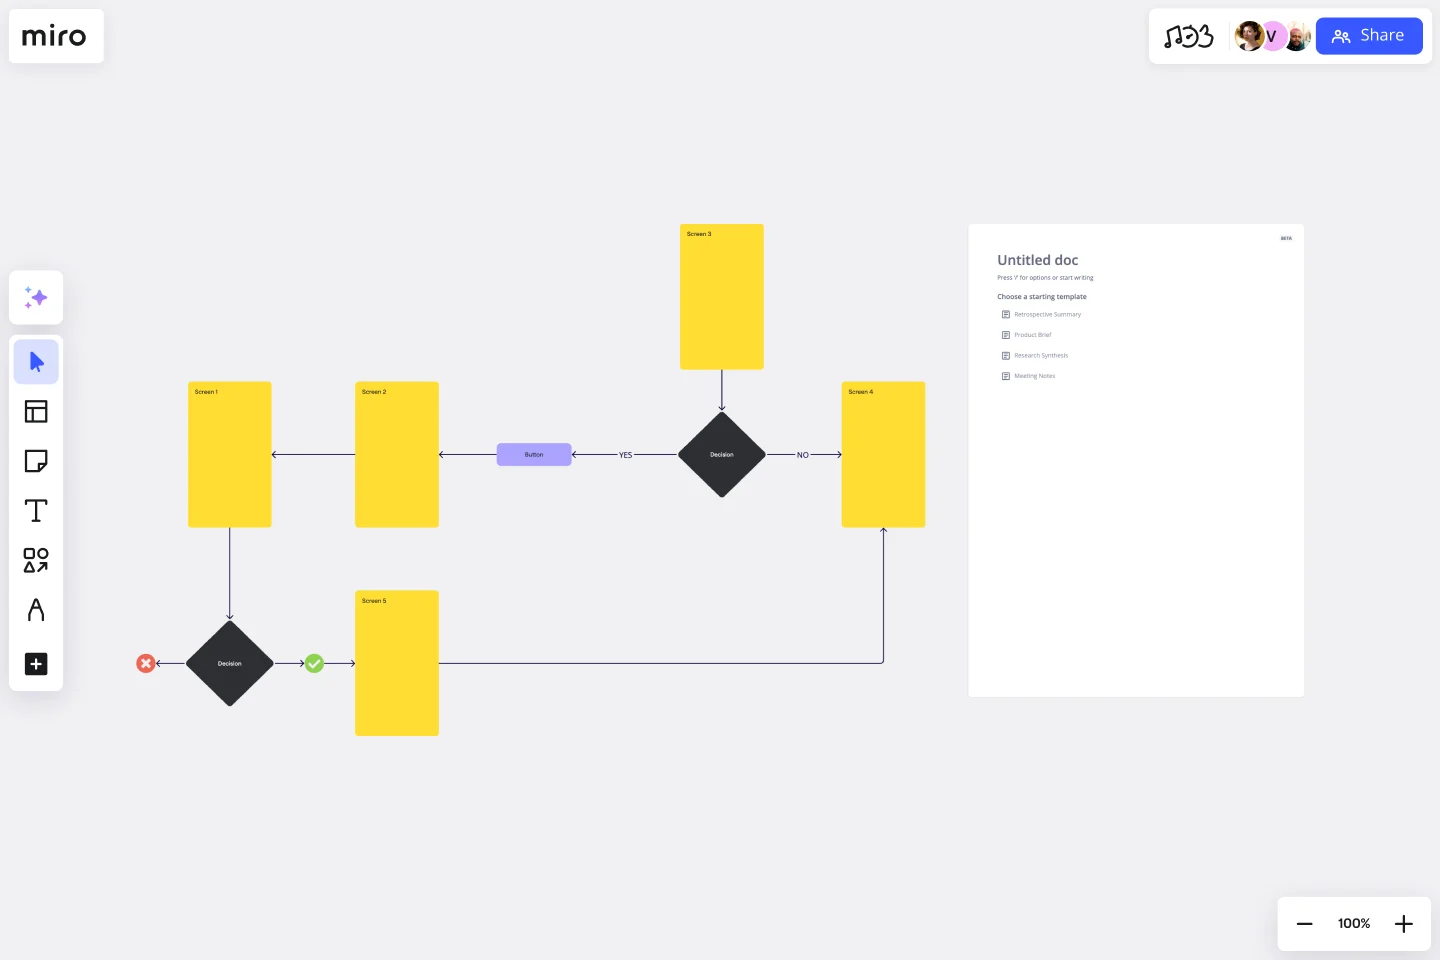
- Create map: Use Miro’s user flow template to visualize the complete patient journey
- Review and refine: Identify where patients wait unnecessarily, where data is entered multiple times, where parallel processes could replace sequential handoffs
- Implement and monitor: Pilot changes in one ED shift, measure impact on wait times and satisfaction, scale improvements
Miro advantage: Clinical staff, administrators, and IT teams collaborate on the same canvas to redesign workflows. When one department proposes a change, everyone immediately sees how it impacts upstream and downstream processes.
Process mapping examples from Miro's templates library
Miro's templates library offers many resources to help you create effective process maps. Here are some examples of how you can use these templates to streamline various aspects of your business.
Mapping your production
Production efficiency directly impacts your bottom line. Miro’s production mapping template helps you visualize and optimize your production processes, ensuring maximum efficiency and quality control.
Step-by-step process:
- Define objectives: Increase production efficiency and reduce waste.
- Gather team: Include production managers, line workers, and quality control experts.
- Outline steps: Map steps from raw material input, assembly, quality checks, to final product output.
- Identify inputs/outputs: Raw materials, intermediate products, final products.
- Determine metrics: Production time, defect rates, resource utilization.
- Create map: Use Miro’s production mapping template to detail each stage.
- Review and refine: Identify inefficiencies, implement improvements.
- Implement and monitor: Apply changes, monitor production metrics.
Mapping your team's project

Analyzing and documenting your team’s processes and outcomes is crucial for any project to succeed. The process map templates from Miro is the perfect example of a project process map, helping you visualize how people collaborate at different project stages.
Step-by-step process:
- Define objectives: Map your project's objectives at every stage of the process.
- Outline activities: Identify what each team will do at each stage.
- Determine deliverables: What's the main output for everyone involved?
- Create a project process map: Use Miro’s process map template to visualize your entire project.
- Review it with your team: Share your process map with your team and iterate according to feedback.
Mapping your business operations
Business Process Model and Notation (BPMN) is a standardized method for modeling complex business processes. Miro’s BPMN diagram template helps you map, analyze, and improve your business operations with a detailed and comprehensive overview, ensuring operational efficiency and clarity.
Step-by-step process:
- Define objectives: Gain a clear understanding of complex business processes, reduce inefficiencies, and standardize workflows.
- Gather team: Involve operations managers, process owners, and key stakeholders from across the business.
- Outline steps: Break down the entire business operation into specific processes, such as procurement, customer onboarding, or service delivery.
- Identify inputs/outputs: Define the data, materials, or actions entering and exiting each process. Include decision points and conditions that affect process flow.
- Determine metrics: Time-to-completion for each step, error rates, cost per process, and overall process efficiency.
- Create map: Use Miro’s BPMN diagram template to represent tasks, events, decisions, and flows in a clear, standardized format, ensuring consistency across your business operations.
- Review and refine: Work with the team to ensure the diagram reflects real-world operations. Identify areas for improvement, such as automation opportunities or process consolidation.
- Implement and monitor: Roll out process improvements and monitor key metrics to track operational performance.
AI-powered process mapping with Miro
Traditional process mapping takes hours of manual work: listing steps, drawing boxes, connecting arrows, and deciding which shapes to use. Miro AI speeds up every stage, so teams can focus on improving processes instead of just drawing them.
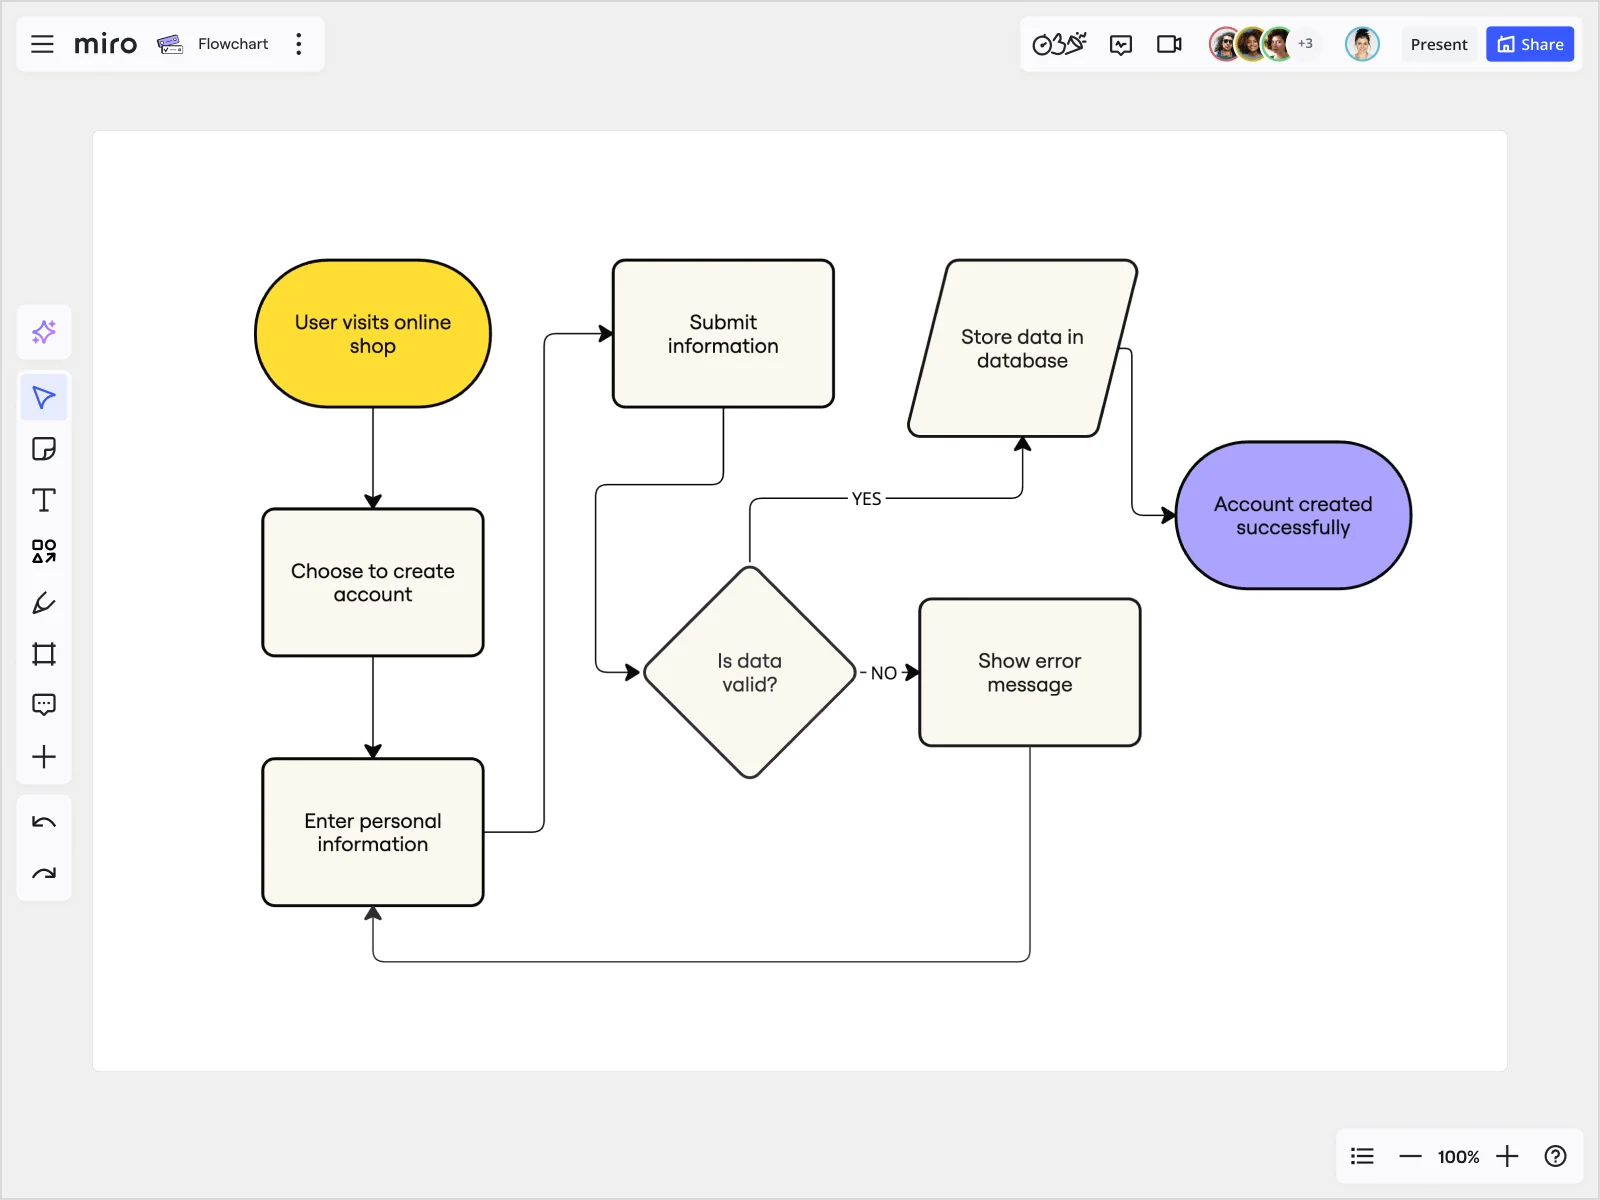
Generate process maps from text descriptions
Paste meeting notes or describe your workflow in plain language. Miro AI creates a structured process map in seconds using proper notation and logical flow.
Example: Instead of manually diagramming your customer onboarding process, paste this: “Customer signs up → sends confirmation email → customer verifies email → account activated → welcome survey sent → if survey completed go to onboarding tutorial, if not completed send reminder after 3 days”
Miro AI generates a complete flowchart with decision points, properly formatted symbols, and clear flow arrows.
Identify bottlenecks automatically
Upload your current-state process map. Miro AI analyzes cycle times, handoff patterns, and decision loops to highlight where work gets stuck.
The AI flags:
- Steps with abnormally long cycle times
- Handoffs between teams that consistently cause delays
- Decision points where one path receives 90%+ of traffic (suggesting the other paths are unnecessary)
- Parallel processes that could run simultaneously but currently run sequentially
Suggest optimization opportunities
Miro AI compares your process against best practices and similar workflows from other teams, recommending specific improvements with estimated impact.
Example optimizations:
- “Combine approval steps 3 and 4—they involve the same stakeholder”
- “Move quality inspection earlier in the process to catch defects before assembly”
- “This handoff between design and engineering causes 60% of your delays. Consider co-locating these teams in the same workspace”
Convert conversations into workflows
Record workshop discussions or upload meeting transcripts. Miro AI extracts action items, identifies process steps, and generates initial process maps with assigned owners and timelines.
This turns 90-minute mapping sessions into 20-minute review sessions. Teams spend less time documenting and more time improving.
Miro transforms process mapping from documentation into dynamic collaboration, accelerating results.
Common process-mapping mistakes to avoid
Even with great tools, teams make predictable mistakes that undermine the effectiveness of process mapping. Here’s what to watch for:
Overcomplicating the map
The mistake: Trying to capture every possible scenario, exception case, and edge condition in one process map. You end up with a tangled diagram that no one can follow.
What to do instead: Keep your main process map focused on the 80% case—the standard workflow that happens most frequently. Create separate maps for exception handling or complex sub-processes, then link them.
If your process map has more than 20 steps, you’re likely including too much detail at once.
Mapping the process alone
The mistake: One person creates the process map based on their understanding, then shares it with the team for feedback. By then, people have already mentally checked out or invested in different interpretations.
What to do instead: Map processes collaboratively from the start. Use Miro’s real-time collaboration so everyone contributes simultaneously. When team members build the map together, they catch gaps and misunderstandings immediately instead of after three revision rounds.
Forgetting to update maps
The mistake: You create a beautiful process map, optimize the workflow, and…never touch it again. Six months later, the process has evolved but the map still shows the old way. No one trusts it anymore.
What to do instead: Set up quarterly process reviews. When you change a workflow, update the map right away. Treat process maps as living documents that show how things work now, not just how they worked in the past.
Miro’s version history helps you track how processes evolve over time.
Ignoring the people doing the work
The mistake: Managers map processes based on how they think work happens, without involving frontline team members who actually execute the tasks. The resulting map shows the ideal process, not the real one.
What to do instead: Always involve the people who do the work every day. They know the shortcuts, informal handoffs, and hidden steps that keep things running. Their input helps you find real ways to improve.
Using process maps as blame tools
The mistake: When something goes wrong, leaders pull out the process map to find who didn’t follow it. Teams learn to avoid process mapping because it becomes a weapon instead of an improvement tool.
What to do instead: Use process maps to improve systems, not to blame people. If someone uses a shortcut or workaround, that’s useful information about where your process needs work. Update the map to show better workflows, not just to enforce old ones.
Avoiding these mistakes ensures your process maps remain clear, accurate, and useful. Miro's collaborative features make it easy to gather input from all stakeholders and keep your maps up to date.
Process mapping best practices
To get maximum value from process mapping, follow these principles:
Start with clear goals
Know what you want to achieve before you start mapping. “Document the process” isn’t a goal—it’s an activity. Goals look like:
- Reduce customer onboarding time by 50%
- Eliminate 3 redundant approval steps
- Decrease error rates from 8% to 3%
Clear goals keep mapping sessions focused and give you metrics to track improvement against.
Use consistent symbols
Standard notation makes sure everyone reads process maps the same way. Use rectangles for tasks, diamonds for decisions, and ovals for start and end points. Don’t make up your own symbols, as it defeats the purpose of clear visuals.
Miro’s templates follow industry-standard notation automatically.
Collaborate in real-time
Process mapping is a team sport. Use Miro’s shared canvas so multiple people contribute simultaneously instead of taking turns at a whiteboard or waiting for email feedback cycles.
Remote teams actually have an advantage here. Miro’s infinite canvas removes physical space limits, so you can map bigger and more complex processes than you could on a traditional whiteboard.
Map “as-is” before “to-be”
Always document how the process works today before designing how it should work tomorrow. The current-state map reveals hidden steps, workarounds, and bottlenecks that aren’t visible until you walk through the actual workflow.
If you skip this step, you might end up designing an ideal process that doesn’t fit real-world constraints.
Link maps to execution
Process maps are most valuable when they connect to actual work. In Miro, link your process map to:
- Project boards showing who’s responsible for improvement tasks
- Product specs detailing requirements for process changes
- Roadmaps showing when optimizations will be implemented
- Customer journey maps illustrating impact on user experience
When documentation connects to execution, teams actually use it.
Review and iterate
Process mapping isn’t one-and-done. Schedule regular reviews—quarterly for stable processes, monthly for rapidly evolving ones. As your organization grows and changes, your processes should evolve too.
Miro’s version history shows how processes change over time, making it easy to track improvements and learn from past iterations.
Create process maps with confidence
Process mapping transforms from documentation into action when teams collaborate on a shared canvas. You’ll spot bottlenecks in your first session, implement improvements within one week, and track measurable results within 30 days.
Miro’s Innovation Workspace gives you everything you need: templates for every process type, real-time collaboration that eliminates silos, AI assistance that accelerates mapping, and connections from documentation directly to execution.
Ready to map processes that drive real change?
Your first process map takes 30 minutes. Your third takes 10. The improvements you’ll identify start delivering results immediately.
Join thousands of teams using Miro to get great done.
Sign up for free and start mapping processes with your team today.
Process mapping FAQs
Can I integrate my process maps with other tools my team uses?
Yes. Miro integrates with 100+ tools so your process maps connect directly to where work happens. Link process maps to Jira tickets to track implementation progress, embed maps in Confluence or Notion documentation, sync with Microsoft Teams or Slack for team updates, or connect to project management tools like Asana or Monday. When your process map lives in the same ecosystem as your execution tools, teams stay aligned from planning through delivery. Explore Miro's integrations.
Can I find pre-built process mapping templates from other teams?
Absolutely. Miroverse is Miro's community library with thousands of templates created by teams across industries. Find process mapping templates specifically designed for healthcare workflows, software development cycles, manufacturing operations, customer service processes, and more. You can use templates as-is or customize them for your specific needs. The Miro Community also offers best practices, video tutorials, and live workshops where you can learn from process mapping experts and share your own approaches.
Do I need a paid plan to create process maps in Miro?
You can start mapping processes with Miro's Free plan, which includes unlimited team members and 3 editable boards. This is perfect for mapping a few key processes or testing Miro with your team. For teams mapping multiple processes or needing advanced features like private boards, guest access controls, and integration with enterprise tools, the Starter, Business, or Enterprise plans offer expanded capabilities. Most product, engineering, and operations teams find the Business plan provides the right balance of collaboration features and process documentation tools. Compare Miro pricing plans to find what works for your team size and needs.
Is Miro accessible for team members with disabilities?
Yes. Miro is committed to accessibility and follows WCAG 2.1 AA standards. The platform supports screen readers, keyboard navigation, high-contrast modes, and alternative text for visual elements. This means team members with visual, motor, or cognitive differences can participate fully in collaborative process mapping sessions. When creating process maps, follow accessibility best practices: use high-contrast colors for different process stages, add descriptive text to shapes (not just icons), and structure your maps with clear hierarchies. Accessible process maps ensure everyone on your team can contribute to improving workflows. Learn more about Miro's accessibility features.
How can I learn process mapping best practices and get help when stuck?
Miro offers multiple learning paths. Miro Academy provides free courses covering process mapping fundamentals, advanced diagramming techniques, and industry-specific workflows. The Help Center includes step-by-step guides for every process map type. Join Miro Community events for live workshops where process improvement experts demonstrate real-world mapping techniques. If you're on a Business or Enterprise plan, you can also access Miro's Customer Success team for personalized guidance on mapping complex cross-functional processes. Most teams complete their first process map in under 30 minutes using Miro's templates and guided walkthroughs.
Author: Miro Team
Last update: February 10, 2026