The ultimate guide to block diagrams
Summary
In this guide, you will learn:
- What a block diagram is: a graphical representation for system overview
- How to create a block diagram step-by-step
- How to use Miro’s tools for easy diagram creation and collaboration
- The difference between block diagrams and flowcharts
- Tips for customizing block diagrams for clarity
- How Miro supports sharing, exporting, and real-time collaboration
Block diagrams are simple tools for visualizing complex systems and processes, making them easier to understand. In this guide, we’ll cover exactly what they are, including why they’re useful and how to draw one. We’ll also share some tips on how to use Miro to simplify your block diagramming experience.
Let’s get into it.
Collaborative AI Workflows
Create system block diagrams easily with Miro's free tool. Start now!
What is a block diagram?
A block diagram is a graphical representation of a system, project, or scenario. It provides a functional view of a system and illustrates how the different elements of that system interlink. Engineers, in particular, use block diagrams to model the elements of a system and understand how they are all connected. But these tools are also helpful in many other use cases.
The blocks that give the block diagram its name represent the different elements within a system. The lines and arrows show the relationships between those blocks. These visual elements provide a high-level, functional overview of the system that is easy to digest and understand.
Why are block diagrams useful?
Creating block diagrams helps everyone involved in a project understand and visualize what’s needed for the whole system to work. By providing a clear understanding of the elements, how they’re linked, and how they work together, block diagrams make it easier to keep your team on the same page and achieve the best possible system design.
But we’ll cover the benefits of using block diagrams in more detail later.
Block diagrams vs flowcharts
It’s easy to get confused between block diagrams and flowcharts because they have a few things in common. Both use blocks and symbols to represent the elements or components within a system or process. Both also use arrows and lines to represent the relationships between those elements.
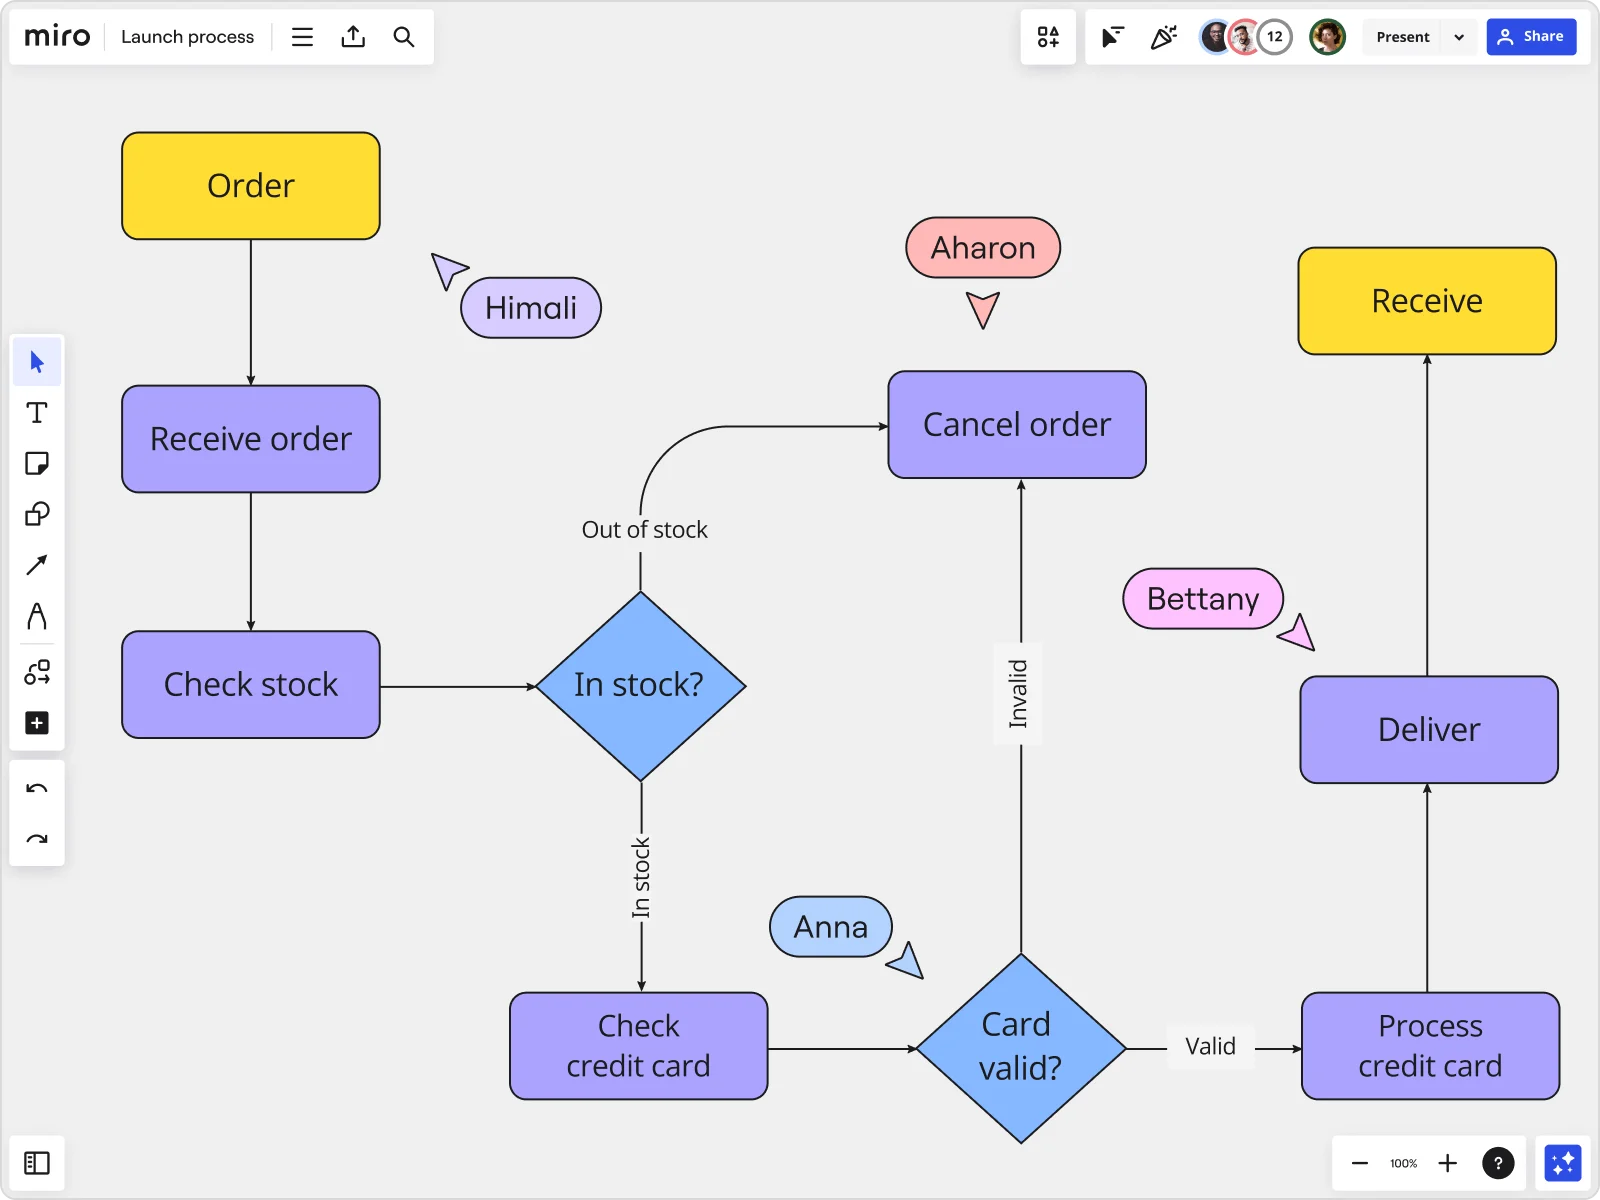
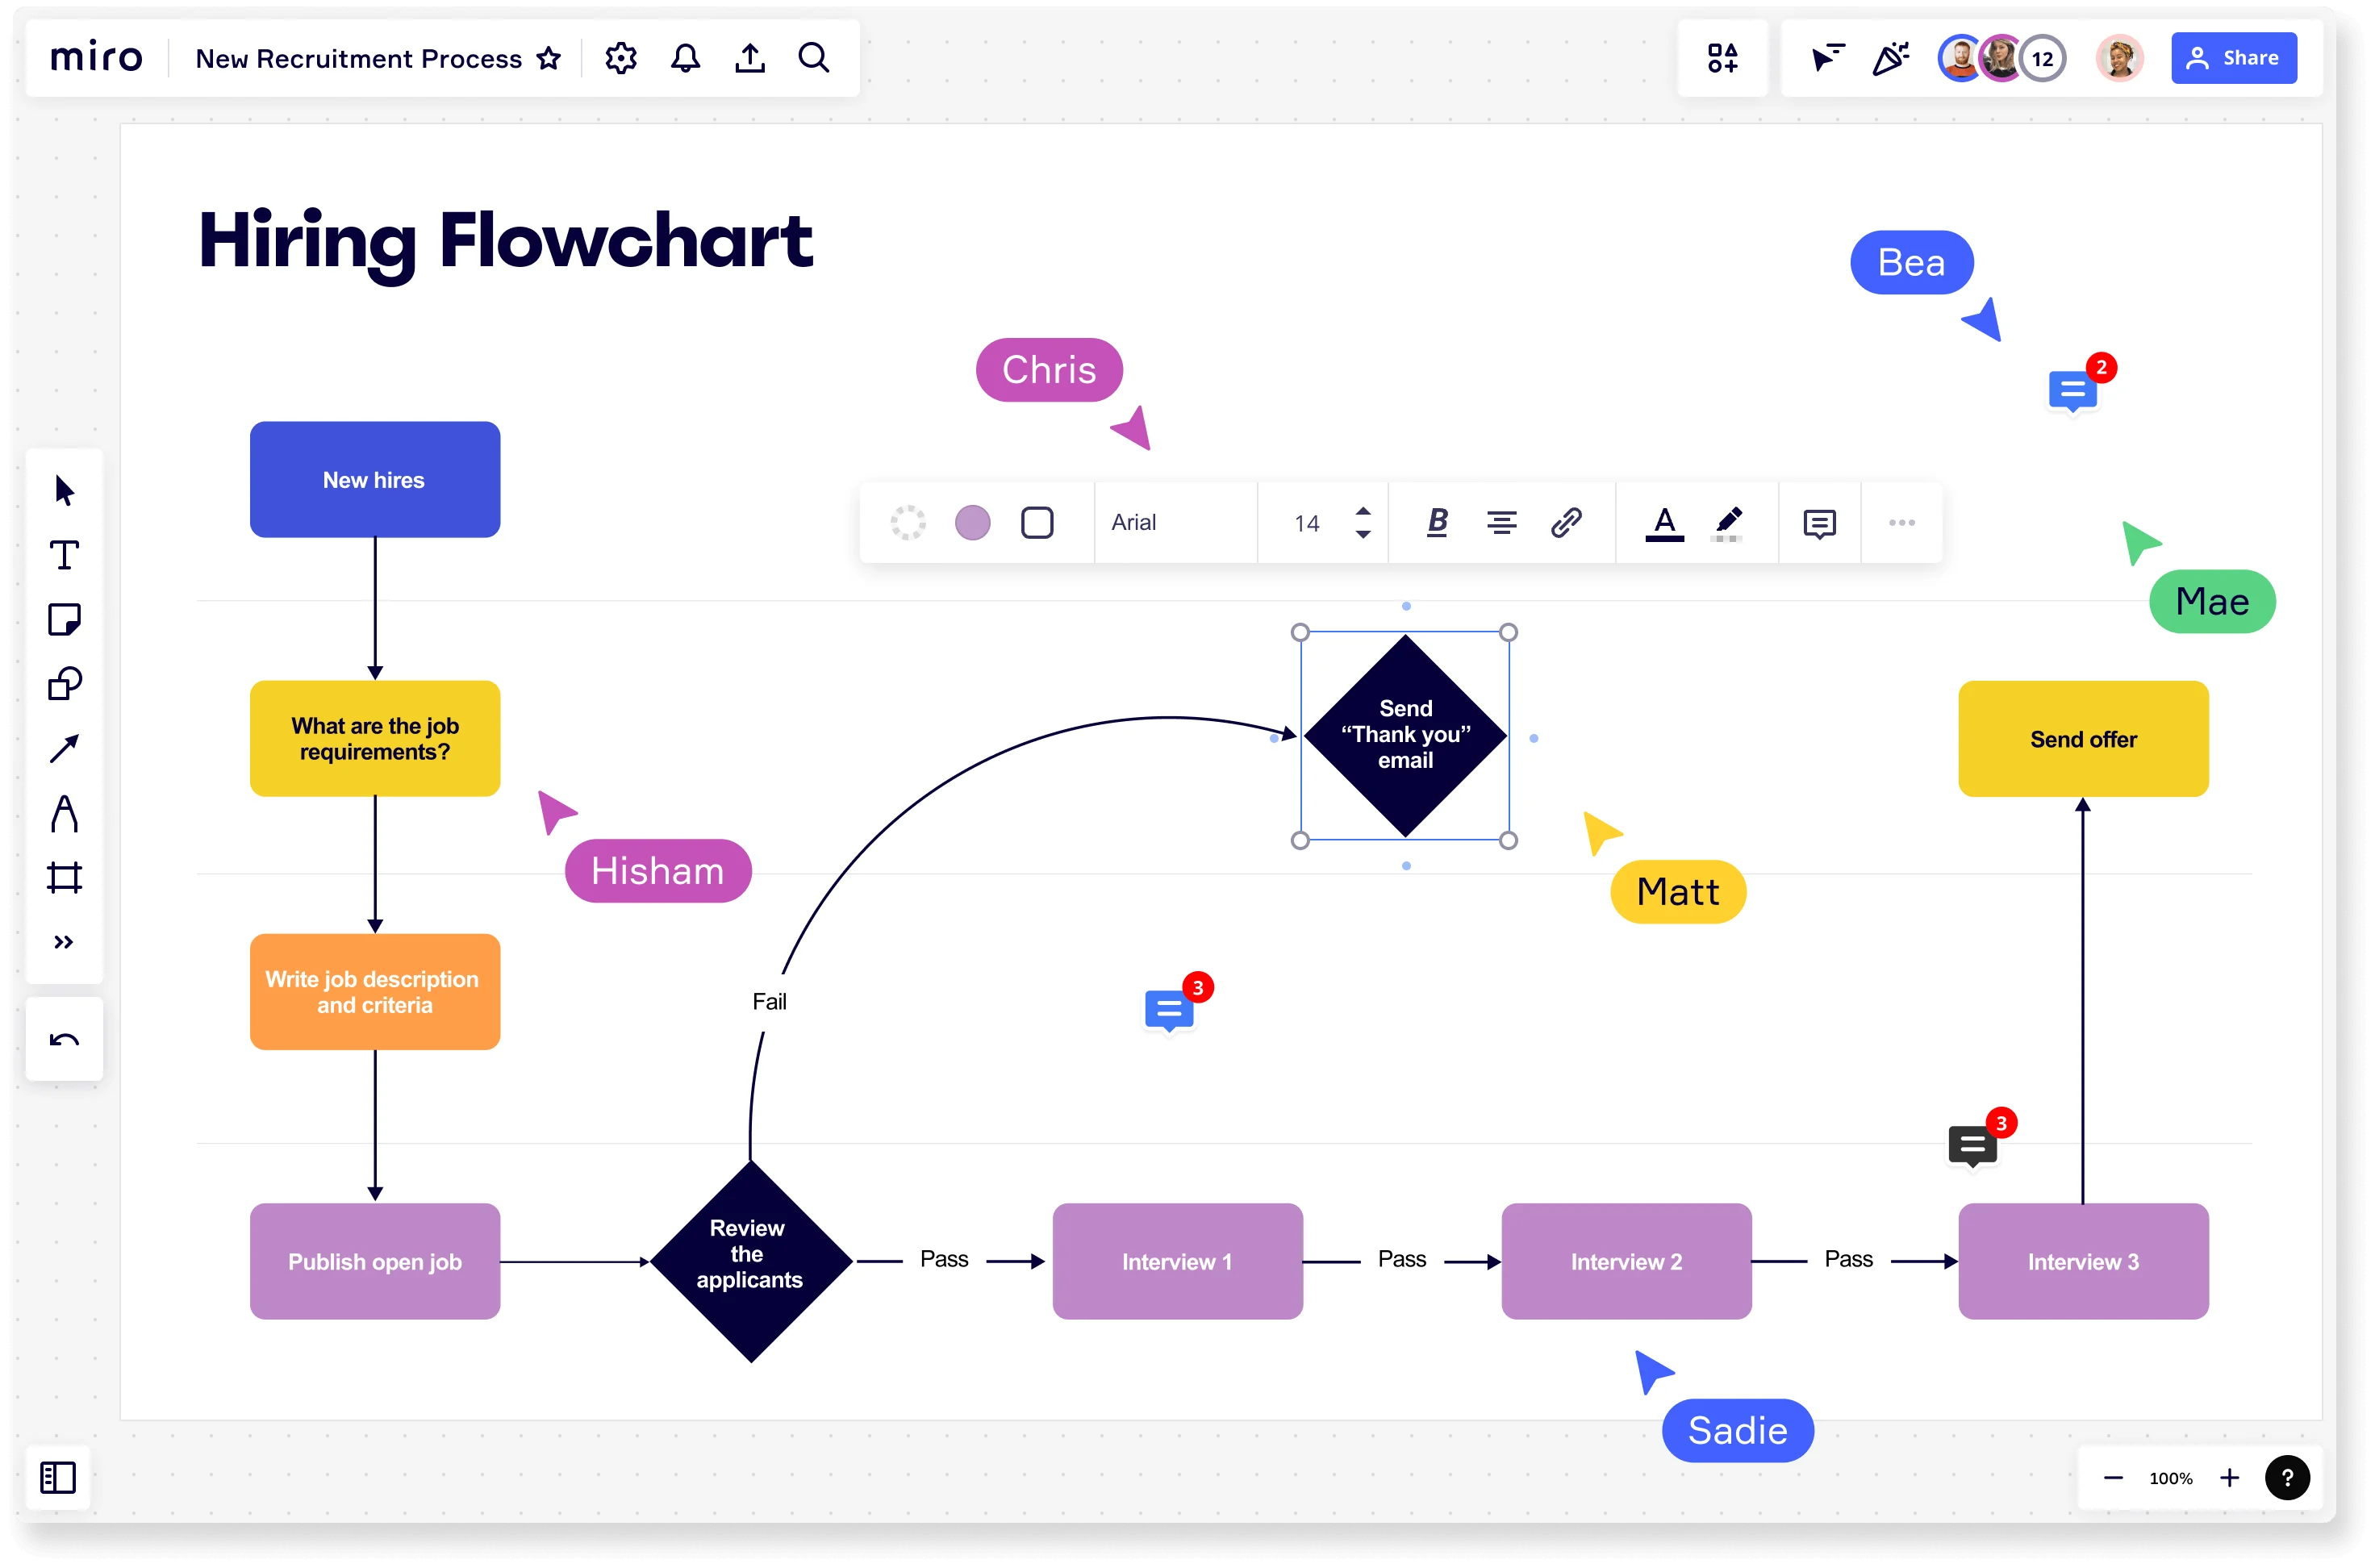
That said, block diagrams and flowcharts serve different purposes. As seen in the example below, a flowchart presents the flow of information or data in a process. It portrays the sequence of movement between the actors and actions that lead to an eventual end.
Block diagrams, on the other hand, depict the relationships and interactions between components in a functional system, like an electronic circuit or piece of hardware. They focus on the components and their relationships rather than the specific sequence or steps involved.
When to use a block diagram?
Block diagrams are particularly popular in the engineering world because of the complex, interlinked systems involved in designing and building structures and machines. But that’s not to say you can’t apply block diagrams elsewhere. In fact, you can use them to represent both hardware and software systems.
Here are a few key use cases for block diagrams:
1. Engineering
As we’ve briefly mentioned, block diagrams are especially useful for engineering teams because they depict and describe the principal components and processes that take place within a system. Engineers need to understand how systems work before actually building them — and a block diagram provides the perfect reference to get the job done.
2. Designing electronics
Designing electronic equipment requires fulfilling certain processes and steps. A block diagram breaks down the necessary elements for this design.
For example, a block diagram could visually break down the elements of an audio system. It could show how the power supply unit interacts with the audio mixer and the audio power amplifier to project sound through a loudspeaker.
3. Hardware and software
Software developers often work in tandem with hardware developers, especially in the realm of engineering and electronics. These systems often have many interlinking elements that are difficult to understand if they aren’t properly mapped out. And that’s where a block diagram comes in handy.
4. Mapping processes
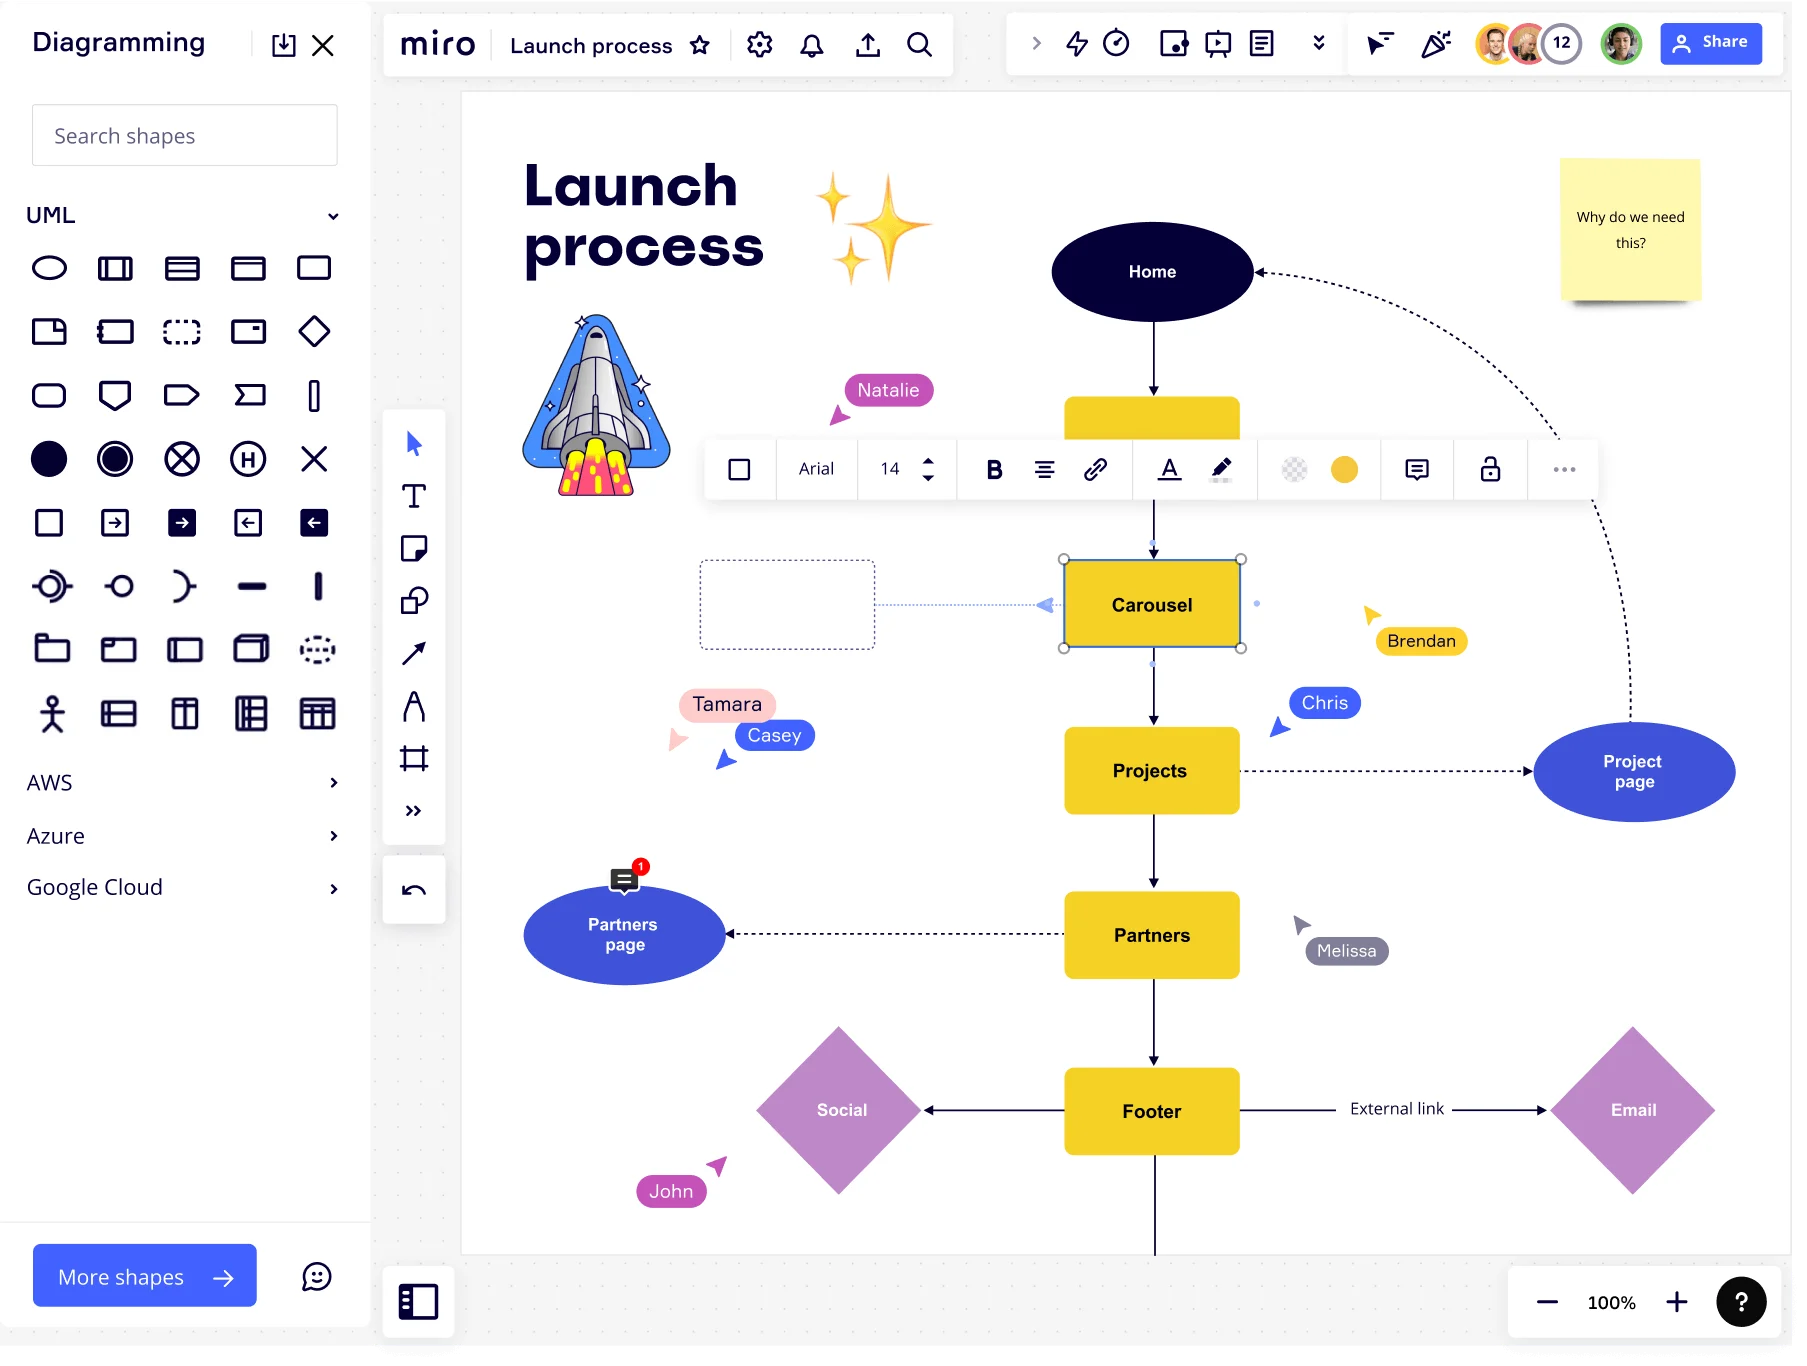
A block diagram is a versatile tool that can map out and provide a useful overview of any process or system. The above example of a block diagram shows a team using this diagram to visually represent the components of a website launch process, from the home page to the social and email footers.
Types of block diagrams
Block diagrams can look different based on what you're trying to show. Here are some common types of block diagrams:
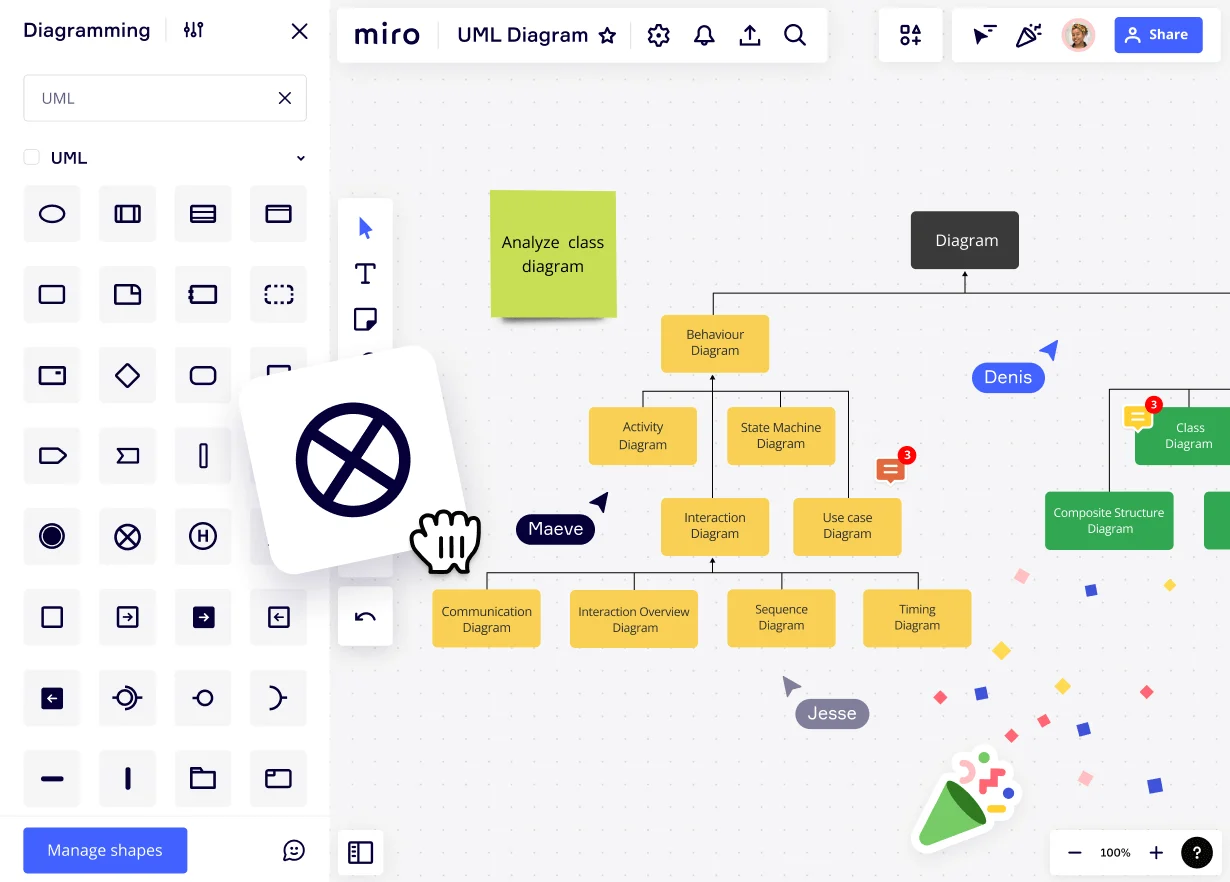
1. Block definition diagram
The block definition diagram stems from the UML Class Diagram. It’s become a popular tool in machine designing, systems creation, and coding.
Essentially, a block definition diagram is a static diagram depicting a system’s structural elements — in other words, the actual system components and their contents, interfaces, and relationships.
2. Functional block diagram
A functional block diagram shows what different parts do and how they connect to each other. You’ll often see these diagrams in engineering and software development. They’re an awesome way to visually show a system's functions with blocks, arrows, and outputs.
3. System block diagram
A system block diagram is great for visualizing big, complicated systems with parts that work together — also called sub-systems. It's usually used to lay out what a system needs and how it should function.
4. Block flow diagram
Earlier, we talked about how flowcharts and block diagrams kinda look the same but represent different things. But what if you combined the two? That's basically what a block flow diagram is.
A block flow diagram helps you get a clear picture of the basic structure and process of a system. Usually, it shows the step-by-step order of how different elements and components interact with each other. This organized interaction eventually leads to the system's final output.
5. Internal block diagram
So far, we've discussed block diagrams that provide the big picture — the main processes in a system. An internal block diagram, however, focuses on the details inside individual parts of a block. It breaks down the properties, parts, and connections of a single element to show how that piece fits into the larger system.
Benefits of using block diagrams
Block diagrams are useful for people with a technical background, like engineers or software developers. But they’re also beneficial for team members who may not completely understand the ins and outs of a given system, including clients or stockholders.
Here are four specific benefits of using block diagrams:
1. Visualize complex systems
Block diagrams help break down complex systems like those found in electrical circuits or other hardware pieces. They help identify the main components and relationships between them, making it easier to understand these systems at a glance.
2. Great communication tool
On a similar note, block diagrams are great communication tools for those without technical backgrounds, including clients, stakeholders, and investors — making it easier to understand how each element works and how they all interact with each other.
3. Identify bottlenecks and problems
Mapping out the relationships, interlinks, and general system sequences can help identify potential issues. Defining the relationships between each block, rather than examining the system as a whole, makes it easier to pinpoint problems.
4. Applicable to different use cases
Block diagrams aren’t limited to the technical space. They’re versatile diagramming tools you can use in many different industries and scenarios. This makes them useful for a wide range of team members — from project managers to engineers.
How to create a block diagram
Creating a block diagram is simple — especially if you’ve got the right tool. For starters, you can easily create one from scratch using Miro’s block diagram maker and applying the steps below, or you can save time using our fully customizable Block Diagram Template.
Either way, we’ve got you covered with a simple step-by-step guide:
1. Understand the system
Before you start drafting your block diagram, make sure you have a clear idea of the system or process you’re trying to depict. This helps make sure you’ve got a good plan to base your design on, and helps reduce the chances of major edits down the line.
2. List the system’s components
Think about what elements will form the system. At this stage, it’s absolutely worth gathering input from the rest of your team so you don’t miss out on any crucial components and or find yourself having to re-draft at a later stage.
In fact, it’s best to start by brainstorming all the components with your team before ultimately creating a comprehensive mind map.
3. Visualize components and label them
Once you know which components to include in your system, it’s time to visually represent each one using UML shapes, like blocks, rectangles, ovals, and diamonds. Then move them around to arrange them in the order they should appear in your system.
4. Connect the components
Once you’ve got your components in order, it’s time to connect the related ones using arrows and lines. Don’t forget to label these arrows to make the relationships between the components clear.
5. Get your team’s input
If you’re working on your block diagram with your team, share your draft for feedback. Miro makes this step extra easy with multiple ways to share your diagram — whether you’re looking to invite others to view and comment on your Miro board, share it with a URL, or export it as an image or PDF.
Best practices for creating a block diagram
Here are some best practices to keep in mind for creating an effective block diagram:
1. Have a clear input and output
While block diagrams are mostly used to create a visual representation of a system and its internal components, remember to include an input and output.
Unlike a flowchart, block diagrams aren’t always drafted with a start and end in mind — but having a start and end makes for a more digestible and comprehensive summary diagram.
2. Keep things simple
Block diagrams are meant to break down a complex system or process into something simple and easy to understand. So try not to get carried away during the diagram drafting stage. Keeping it as simple as possible makes things easily digestible for teammates, clients, and stakeholders.
3. Use standard labels
Using standard UML diagramming symbols and labels will make your block diagram easy to read and understand by everyone, even those who aren’t of a technical background.
4. Add color
Don’t be afraid to spruce up your diagram to make it more attractive to look at. Not only is it a great way to keep people engaged, but you can also color-code different components to make the diagram easier to read overall.
Create your block diagram in Miro
Ready to create a block diagram? Miro is the perfect place to get started. With powerful yet easy-to-use block diagramming tools – including a customizable Block Diagram Template to save you time – you’ll have everything you need to easily visualize your ideas.
Plus, Miro is built for collaboration, allowing you to work on your block diagram with your team, even if you aren’t in the same room, regardless of whether you’re working in real time or async.
Sign up for Miro to start creating and collaborating on your block diagram.
Author: Miro Team
Last update: October 9, 2025