Current state vs. future state diagrams explained
Summary
In this guide, you will learn:
- What a current state vs. future state diagram is and how it helps visualize and compare existing workflows with optimized future processes
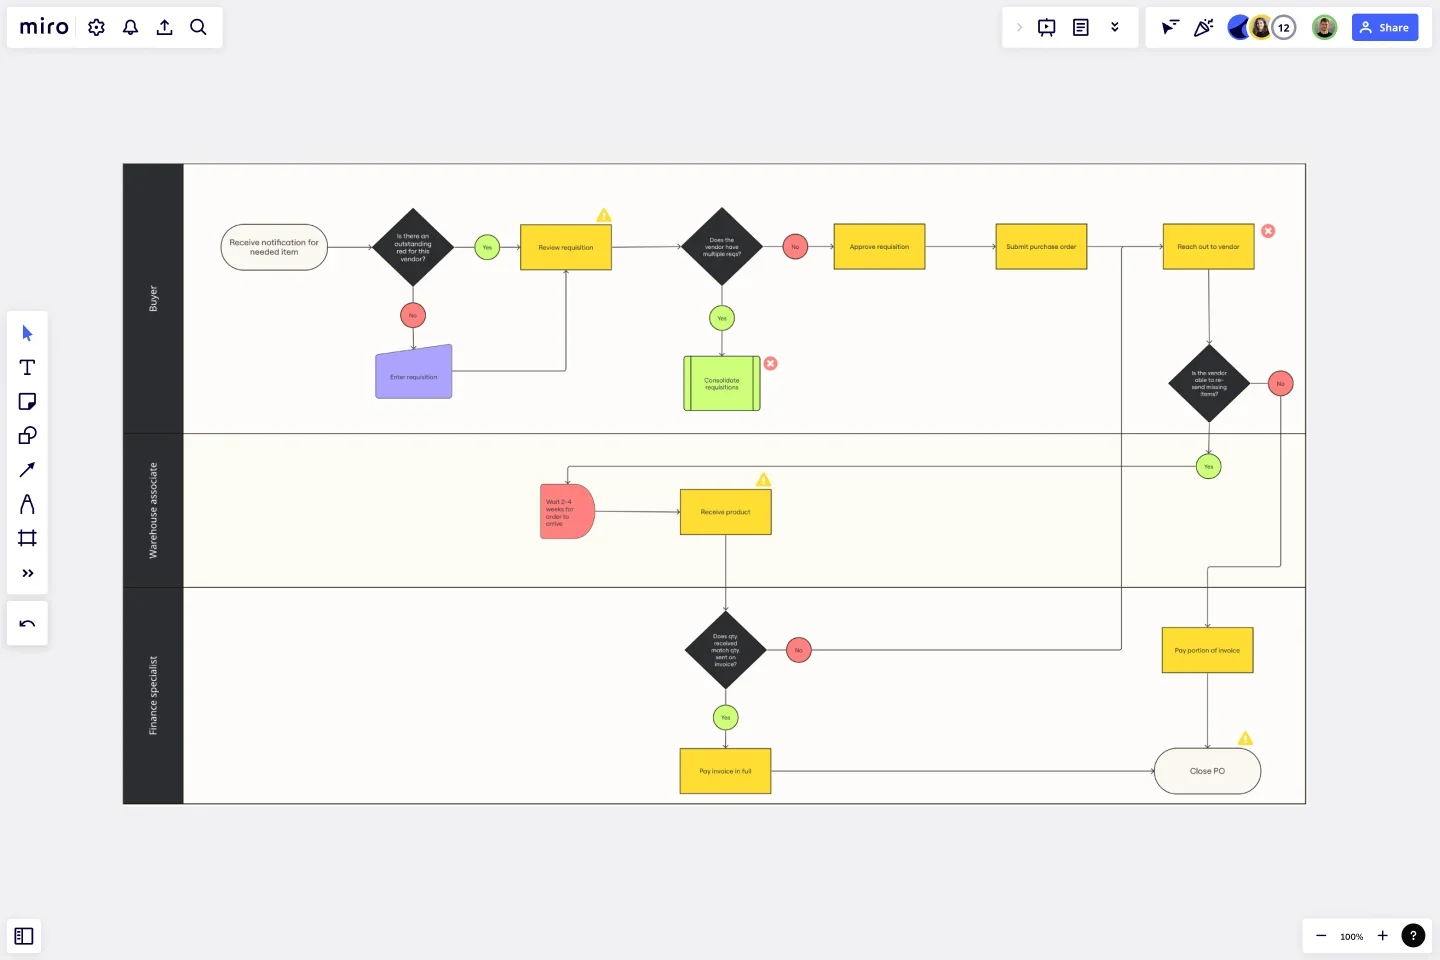
- How swimlanes are used to clearly allocate tasks and responsibilities across departments in the flowchart
- The role of layers in dynamically representing changes between current and future states for a nuanced view of process transformation
- How the diagram aids in identifying bottlenecks and inefficiencies to target improvements effectively
- Practical steps to use Miro’s template for creating these diagrams, including task allocation, visualization, and analysis
- The benefits of using this tool to streamline workflows, enhance communication, and confidently manage process changes within teams
Whether you're new to the concept of current state vs. future state diagrams, or an experienced professional, we've got you covered with everything you need to know.
In this guide, we’ll show how a current state vs future state diagram can help set your business up for success by comparing where you are now with where you want to be. You’ll learn what these diagrams are, why they matter, and how to create one.
Let's dive in.
Collaborative AI Workflows
Join thousands of teams using Miro to build the right thing, faster.
What is a current state vs future state diagram?
A current state vs. future state diagram is a visual tool that shows an organization’s current operations and its envisioned future scenario — using standardized symbols and notations. They’re especially helpful for business analysts, project managers, and organizational leaders who need to plan major changes or improvements.
Key elements for current vs future state diagrams
To make the most out of these diagrams, it's important to understand the key elements that define your current and future states. These elements help you clearly identify gaps and plan strategically for future success. The current state diagram captures your organization’s existing processes, roles, and resources, including:
• Detailed workflows: The step-by-step processes currently in place within your organization.
• Responsibilities: The specific roles and duties assigned to individuals or teams.
• Allocation of resources: How resources, both human and technological, are distributed across the organization.
The future state diagram outlines your goals and the changes needed to achieve them, including:
• Process improvements: Streamlining workflows and removing inefficiencies.
• Resource reallocations: Optimizing the use of tools, technology, and personnel.
• Organizational changes: Adjusting roles and responsibilities to better align with future goals.
• New initiatives to drive growth and improvement: Introducing new projects or strategies to achieve your objectives.
Symbols for current vs future state diagrams
Using the right notation is crucial for making your diagram clear and understandable. Standardized symbols help make sure that everyone can easily follow the processes your diagram visualizes. Here are some common symbols for creating current state vs future state diagrams:
• Arrows indicate the flow of processes, showing the direction from one step to the next.
• Ovals represent the start and end points of processes, providing clear markers for where processes begin and end.
• Diamonds represent decision points where different paths can be taken based on certain conditions or criteria.
Choosing the right methodology
Choosing a guiding methodology will help add structure and depth to your diagramming process. Here are three widely-used methodologies:
Lean focuses on efficiency and waste reduction, making it ideal for streamlining processes and improving operational efficiency. It emphasizes continuous improvement to achieve a leaner future state.
Six Sigma helps to minimize defects and variability in processes through data-driven techniques. It's suitable for organizations aiming for high process reliability and quality in their future state.
Business Process Model and Notation (BPMN) provides a standardized graphical representation for business processes. It's valuable for visualizing and documenting complex processes across departments, ensuring clarity and alignment toward achieving future state goals.
Why use a current state vs future state diagram?
There are plenty of benefits that come with using a current state vs. future state diagram. Let’s zoom in on what they can help you achieve:
Identify problems
The 'Current State' serves as a diagnostic tool to pinpoint bottlenecks, inefficiencies, and resource misalignments within your organization. It visually maps existing processes to identify areas needing improvement or restructuring.
Plan long-term strategy
The 'Future State' acts as a blueprint for your organization's long-term goals, providing clarity on desired outcomes and milestones. It aligns teams toward common objectives and guides organizational growth.
Allocate resources
A current state vs future state diagram facilitates optimal resource allocation by comparing current and future states visually. This helps make sure your business uses resources like budget, manpower, and technology efficiently to support progress toward achieving future goals.
How to create a current state vs future state diagram
To create a current state vs future state diagram, it’s best to start by gathering your team and collecting data. You can use surveys, interviews, and observations.
When you’ve gathered your information, follow our quick step-by-step guide below on how to create an effective current state vs. future state diagram. To save time, you can follow along using our fully customizable Current vs Future State Flowchart Template.
1. Map the current state
Start by documenting your current processes, challenges, and roles. This sets a clear baseline for identifying areas that need improvement.
TIP: Try Miro's Value Stream Mapping tool — or save time with our Value Stream Mapping Templates.
2. Map the future state
Outline your desired outcomes and vision for the future state to set the stage for improvements and long-term goals.
3. Conduct a gap analysis
Compare the current and future states to identify gaps and opportunities for improvement. Consider additional resources needed to achieve the future state, and get input from important stakeholders.
4. Iterate, iterate, iterate
Refine the diagram based on feedback from your team and stakeholders. Continuously improve to make sure your diagram accurately reflects your organization's needs. Then turn your finalized diagram into a list of actionable plans and strategies.
TIP: Streamline the feedback and iteration cycle using Miro’s powerful and seamless collaboration features — regardless of whether your team collaborates in real time or async.
Best practices for creating current vs future state diagrams
To create an effective current state vs future state diagram, here are some best practices worth keeping in mind:
1. Gather comprehensive data
Start by gathering both qualitative and quantitative data through surveys, interviews, and observations. This helps you fully understand current processes, challenges, and opportunities for improvement.
2. Collaborate with stakeholders
Involve stakeholders from various departments early on. Their diverse perspectives and insights will enrich the diagramming process and ensure that the future state aligns with your organization’s goals and priorities.
3. Maintain a balanced perspective
While identifying current inefficiencies, always keep your future state goals in mind. This balanced approach allows for strategic planning and ensures that the diagram supports a clear path forward toward achieving your organizational objectives.
4. Measure impact with KPIs
Define and track Key Performance Indicators (KPIs) like efficiency gains, Return on Investment (ROI), and time savings. These metrics provide tangible evidence of the diagram’s impact, helping to demonstrate its effectiveness in driving positive organizational change.
Map out your business goals in Miro
Ready to create a powerful current vs future state diagram? Miro is the perfect place to get started. Between our intuitive diagramming tools and powerful collaboration features designed to seamlessly bring teams together, you’ll have everything you need to map out your goals and keep everyone aligned. But why not see for yourself?
Sign up for Miro to start innovating.
Author: Miro Team Last update: August 13, 2025