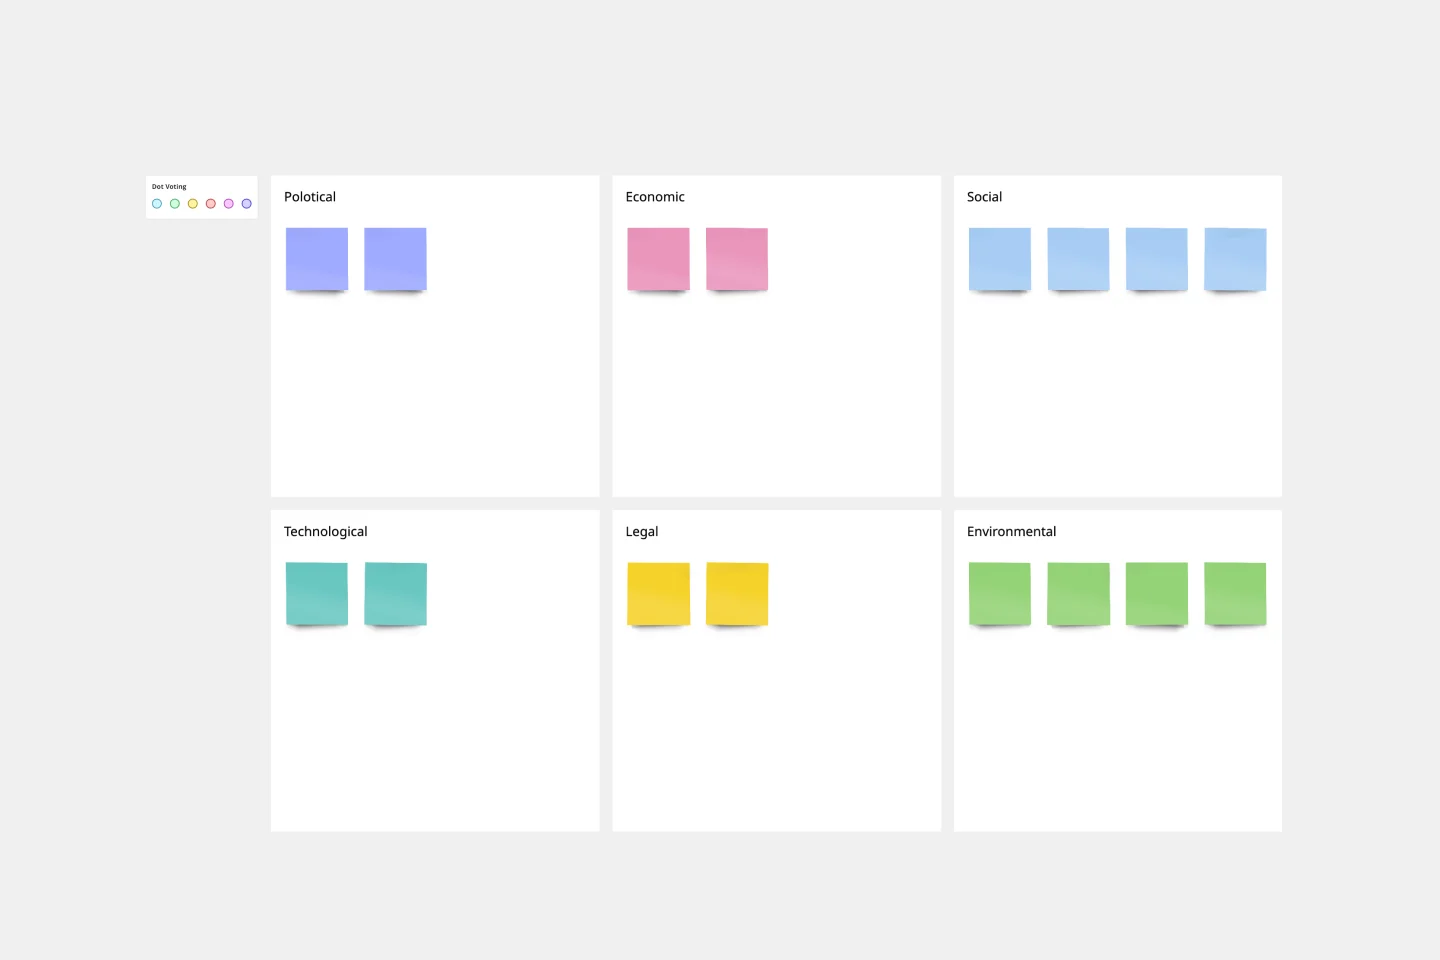
Gap Analysis Template
Find, define, and close gaps to help your business reach its potential with the gap analysis template.
About the Gap Analysis Template
The gap analysis template helps you identify what’s missing from company products or processes, making it easy to collaborate on and analyze historical performance benchmarks. Sharing information reduces guesswork or conflicting opinions – especially when you focus on your organization’s internal elements and its challenges or opportunities for improvement.
This template can be adapted from the general gap analysis to focus on specific gap analyses for skills, candidates, software, processes, vendors, training, market, data, or security. After you complete a gap analysis, you may want to conduct a SWOT analysis to identify broader strengths and opportunities.
Using this strategic process helps your business compare its current, real-world situation with its ideal goals. Determining what obstacles might prevent teams or individuals from attaining goals sooner allows you to push your organization toward growth and development.
Pinpointing goals, understanding the current situation, and figuring out remaining obstacles allows your team to collaborate on a plan to achieve those goals.
How to use the gap analysis template
Creating and sharing your gap assessment template with your team is easy with Miro's visual workspace. This template can be adapted for any industry. Get started by following these steps:
1. Define your “current state”
Try to pinpoint your business’s problem areas that need improvement or realignment with the company vision. Go for the “big picture” view here – aim to understand all your business does and how its different components are performing.
2. Define your desired “future state”
Getting idealistic here will help you tap into the true potential of your team and the entire organization. Use alongside this template. Your team can then collaborate on creative ways to get closer to where you want to be, or to what success looks like in an ideal world.
3. Locate the gap between the two states and work toward solutions
By adding specific metrics like KPIs, you can focus on opportunities you can measure (such as percentage change, financial value, or increase/decrease in a number of items). These indicators should have baselines you can measure now, to compare to future performance. And, they should ideally be both short-term and long-term.
4. Implement an action plan or identify remedies for your team
Create specific tasks for your team to close the gaps you’ve identified. You can also prioritize tasks based on the difficulty or potential impact of each one.
When to use a gap analysis template
Performing a gap analysis can help your team become better strategic planners. Use it to identify problems, adapt products or services, or change company processes to better align on goals.
Specifically, your organization can use a gap analysis to:
Benchmark company results against external criteria such as industry standards
Analyze your products and services to find new sales and marketing opportunities
Forecast profits
Reveal opportunities for improvement in existing processes
Understand why Key Performance Indicators (KPIs) aren’t met
Discern the difference between a product or service’s current and potential market size
Discover more gap analysis example templates to plan effectively.
Are there different types of gap analysis templates?
Gap analysis templates are designed to help organizations identify specific areas for improvement. Performance gap analysis templates focus on pinpointing discrepancies between expected and actual performance levels, while market gap analysis templates help identify gaps in the market that the organization can fill. Similarly, skills gap analysis templates are used to identify gaps in employee skills and knowledge. By using these templates, organizations can gain valuable insights into areas of improvement and develop strategies to address them.
Can I customize a gap analysis template to suit my needs?
Gap analysis templates provide a structured approach to identifying gaps between current and desired states. These templates are designed to be customizable, allowing users to tailor them to their specific needs and requirements. This flexibility enables organizations to conduct a more comprehensive analysis that is aligned with their industry, goals, and objectives.
Can I collaborate with others using a gap analysis template?
You can collaborate by sharing the template with team members or stakeholders, allowing them to provide input and work together to analyze and address gaps.
How often should I conduct a gap analysis?
The frequency of conducting a gap analysis may vary depending on the context. Some organizations perform them annually, while others conduct them whenever significant changes occur in their industry or processes.
Get started with this template right now.
Performance Review Template
Works best for:
Management, Growth
The Performance Review Template offers a structured and intuitive framework for managers and HR professionals to evaluate an employee's performance over a specific period. One significant benefit of using this template is its ability to foster clear communication, ensuring that both employees and supervisors have a shared understanding of achievements, expectations, and areas for development, thereby promoting a more cohesive work environment.
The Product Storyboard
Works best for:
Product Management, Planning
The Product Storyboard template enables product managers to visualize product experiences and user journeys. By mapping out key touchpoints, interactions, and scenarios, this template helps teams understand user needs and pain points. With sections for defining user personas, storyboarding user flows, and capturing feedback, it supports iterative product design and validation. This template serves as a storytelling tool for communicating product visions and guiding product development efforts towards delivering exceptional user experiences.
Six Thinking Hats Template
Works best for:
Ideation, Brainstorming
The Six Thinking Hats by Dr. Edward de Bono was created as an alternative to argument, it is designed to help teams explore and develop ideas collaboratively. Use this template to boost creative thinking and get different perspectives so you and your team can make better-informed decisions.
Growth Experiments Template
Works best for:
Leadership, Desk Research, Strategic Planning
Many ambitious companies are eying the future and aiming to grow. But growth decisions can be leaps of faith that are risky and costly. That’s why growth experiments make so much sense. They offer a systematic six-step method that reveals which strategies are most effective, how they’ll affect your revenue, and how they compare to your past approaches. By helping you test out your strategies for scaling your business before you fully commit, growth experiments can save you serious time, resources, and money.
Product Feature Presentation
Works best for:
Product Management, Planning
The Product Feature Presentation template aids product teams in showcasing product features and benefits effectively. By providing a structured framework for presenting key features, use cases, and value propositions, this template enables teams to communicate product functionality clearly and persuasively. With sections for creating feature demos, customer testimonials, and competitive differentiators, it facilitates engaging presentations that resonate with target audiences. This template serves as a powerful tool for driving product adoption and generating customer interest.
Infographic Template
Works best for:
Marketing, Desk Research, Documentation
As we bet you’ve experienced, data can get pretty dense and dry. But you need it to be compelling, memorable, and understandable. The solution? Infographics. These are tools that let you present information in a visually striking way and turn quantitative or qualitative data into stories that engage and resonate. Whoever you’ll be presenting to — customers, donors, or your own internal teams — our template will let you design an infographic that combines text and visuals to break down even the most complicated data.