Step-by-step process mapping examples to boost your organization productivity

Summary
In this guide, you will learn:
- Real-world process map examples across business functions
- Step-by-step process map creation using Miro's templates
- How to use Miro's specialized diagramming shapes
- Benefits of Miro's collaborative online whiteboard
- Different Miro process map templates and their use cases
- Tips for refining, reviewing, and implementing process maps
Try Miro now
Join thousands of teams using Miro to do their best work yet.
Imagine you're about to embark on a new project, and you need to get everyone on the same page. What if you could visualize each step, spot inefficiencies, and streamline the entire process? Enter: process mapping. Whether you're in manufacturing, healthcare, retail, non-profit, or SaaS, process maps are your secret weapon to success.
Identify your processes: Where to begin
So, you've decided to dive into process mapping. But where do you start? The first step is identifying the processes you want to map out. It might be overwhelming, but don't worry; it's simpler than it seems. Here are the steps to begin your process mapping journey:
Step 1: Define your objectives
Start by pinpointing the critical processes that drive your business. Think about the workflows that impact your goals the most. Are you looking to improve efficiency, enhance communication, or ensure compliance? Clearly define what you hope to achieve with your process map.
Step 2: Gather your team
It's crucial to involve stakeholders from various departments. Their input will help you understand the intricacies of each process and identify potential bottlenecks. Assemble a diverse team that includes people who are directly involved in the process, as well as those who oversee it.
Step 3: Outline the process steps
Begin by outlining each step of the process. You can start with a high-level overview and then drill down into more detail. Use sticky notes or Miro's visual workspace to list each step and arrange them in sequence.
Step 4: Identify inputs and outputs
For each step, determine the inputs (resources, information) and outputs (results, products) involved. This will help you understand the flow of materials and information through the process.
Step 5: Determine key metrics
Identify the key metrics you will use to measure the effectiveness of the process. These could include time taken for each step, costs involved, error rates, and customer satisfaction levels.
Step 6: Create the initial process map
Using the information gathered, create your initial process map. Use Miro's advanced diagramming capabilities and templates to make this task easier. Ensure that all steps, inputs, outputs, and metrics are clearly represented.
Step 7: Review and refine
Review the initial process map with your team. Gather feedback and make necessary refinements. Ensure that the map accurately reflects the current state of the process and addresses any identified issues.
Step 8: Implement and monitor
Implement the process map in your operations. Monitor the process regularly and use the identified metrics to measure its effectiveness. Make adjustments as needed to continuously improve the process.
Process mapping basic symbols and notation
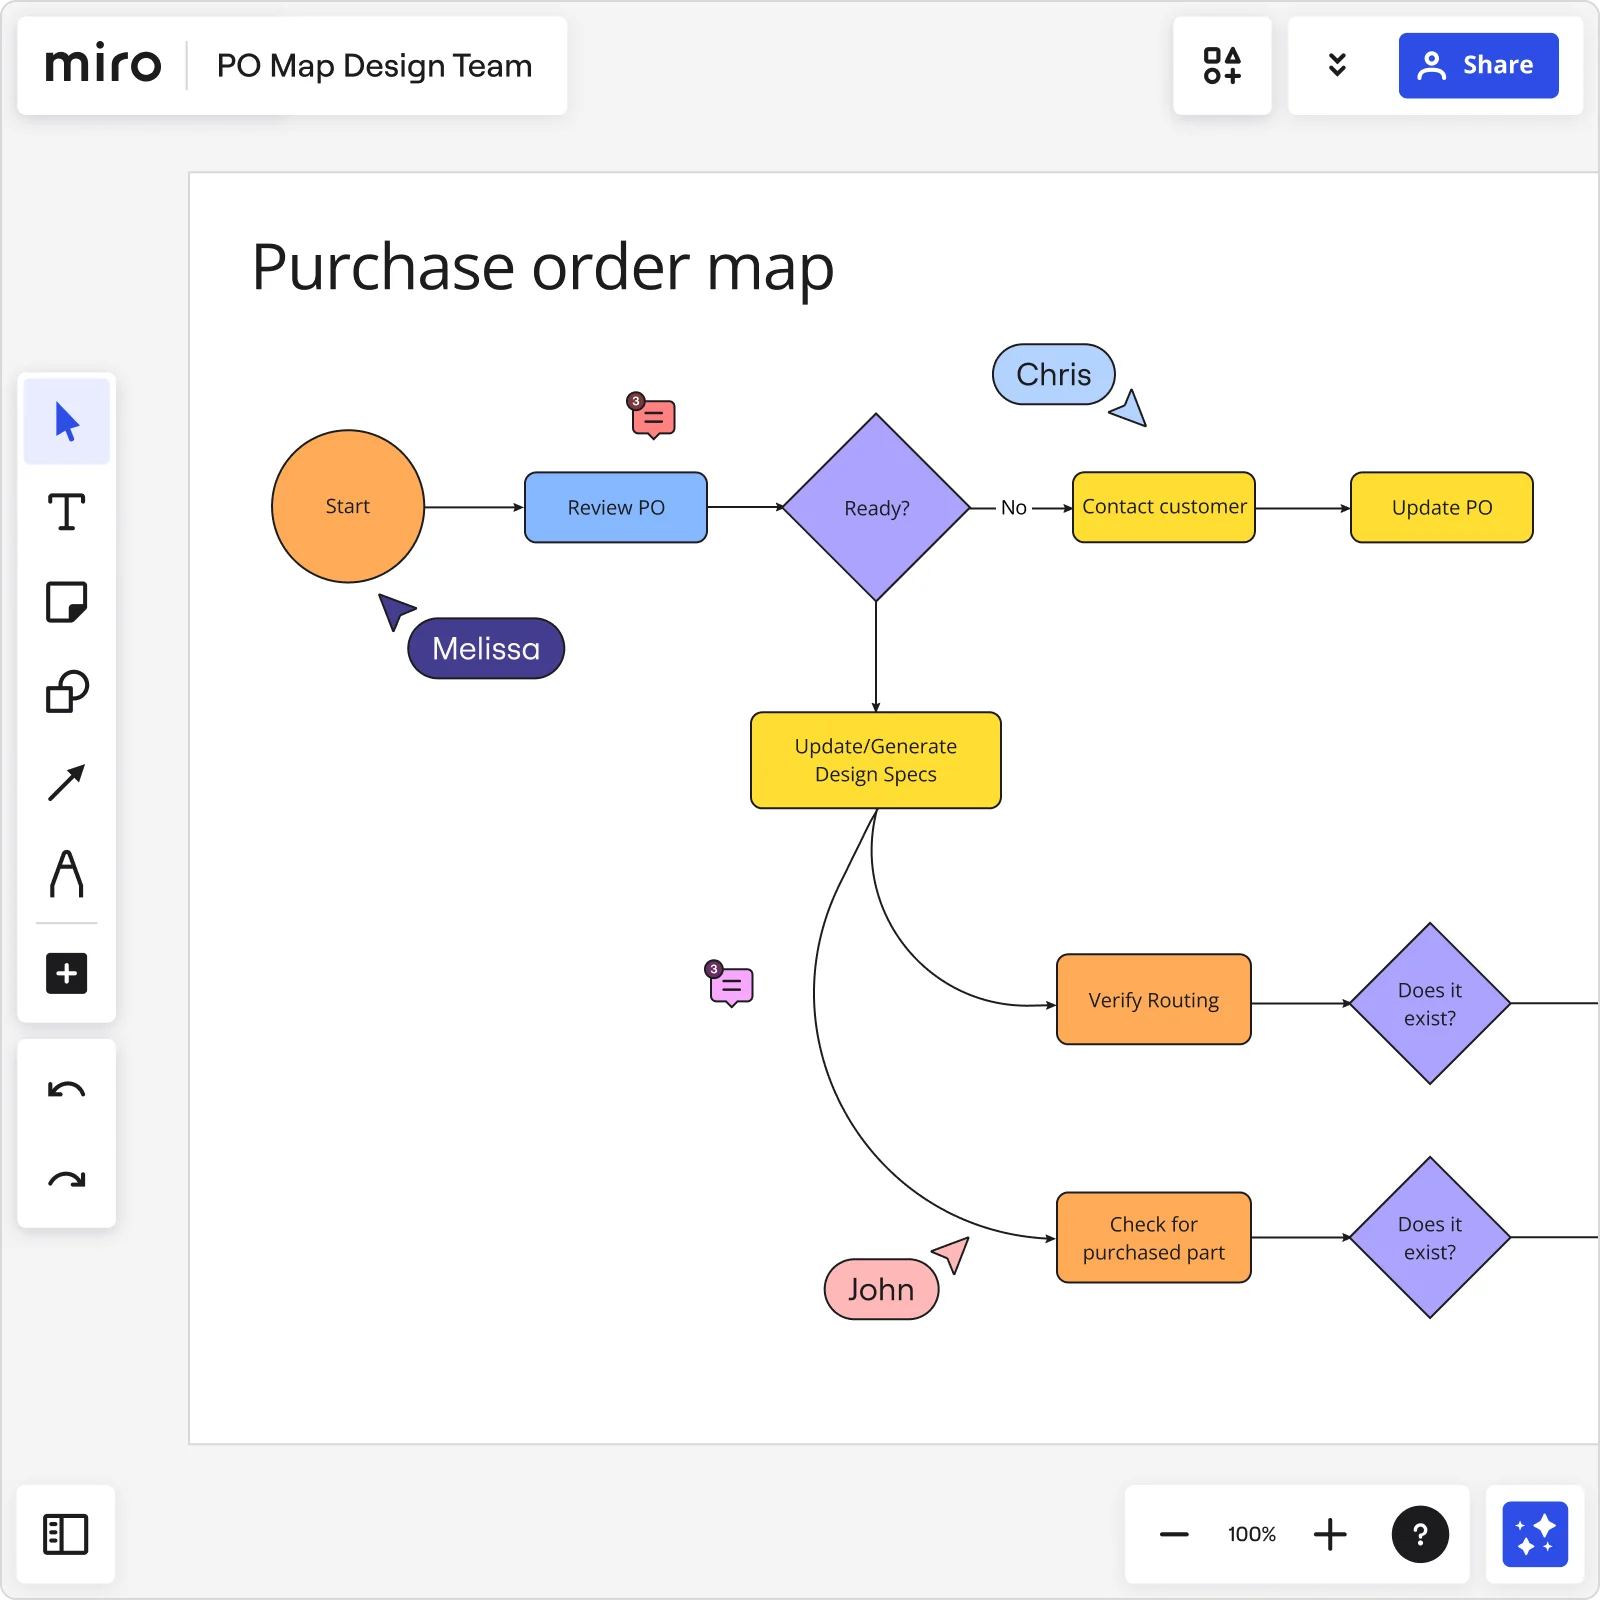
Ever seen a process map and wondered what all those shapes and arrows mean? Let's demystify the symbols and notation so you can create clear, effective maps. Understanding these symbols is like learning a new language that helps you communicate complex processes simply and effectively.
Ovals
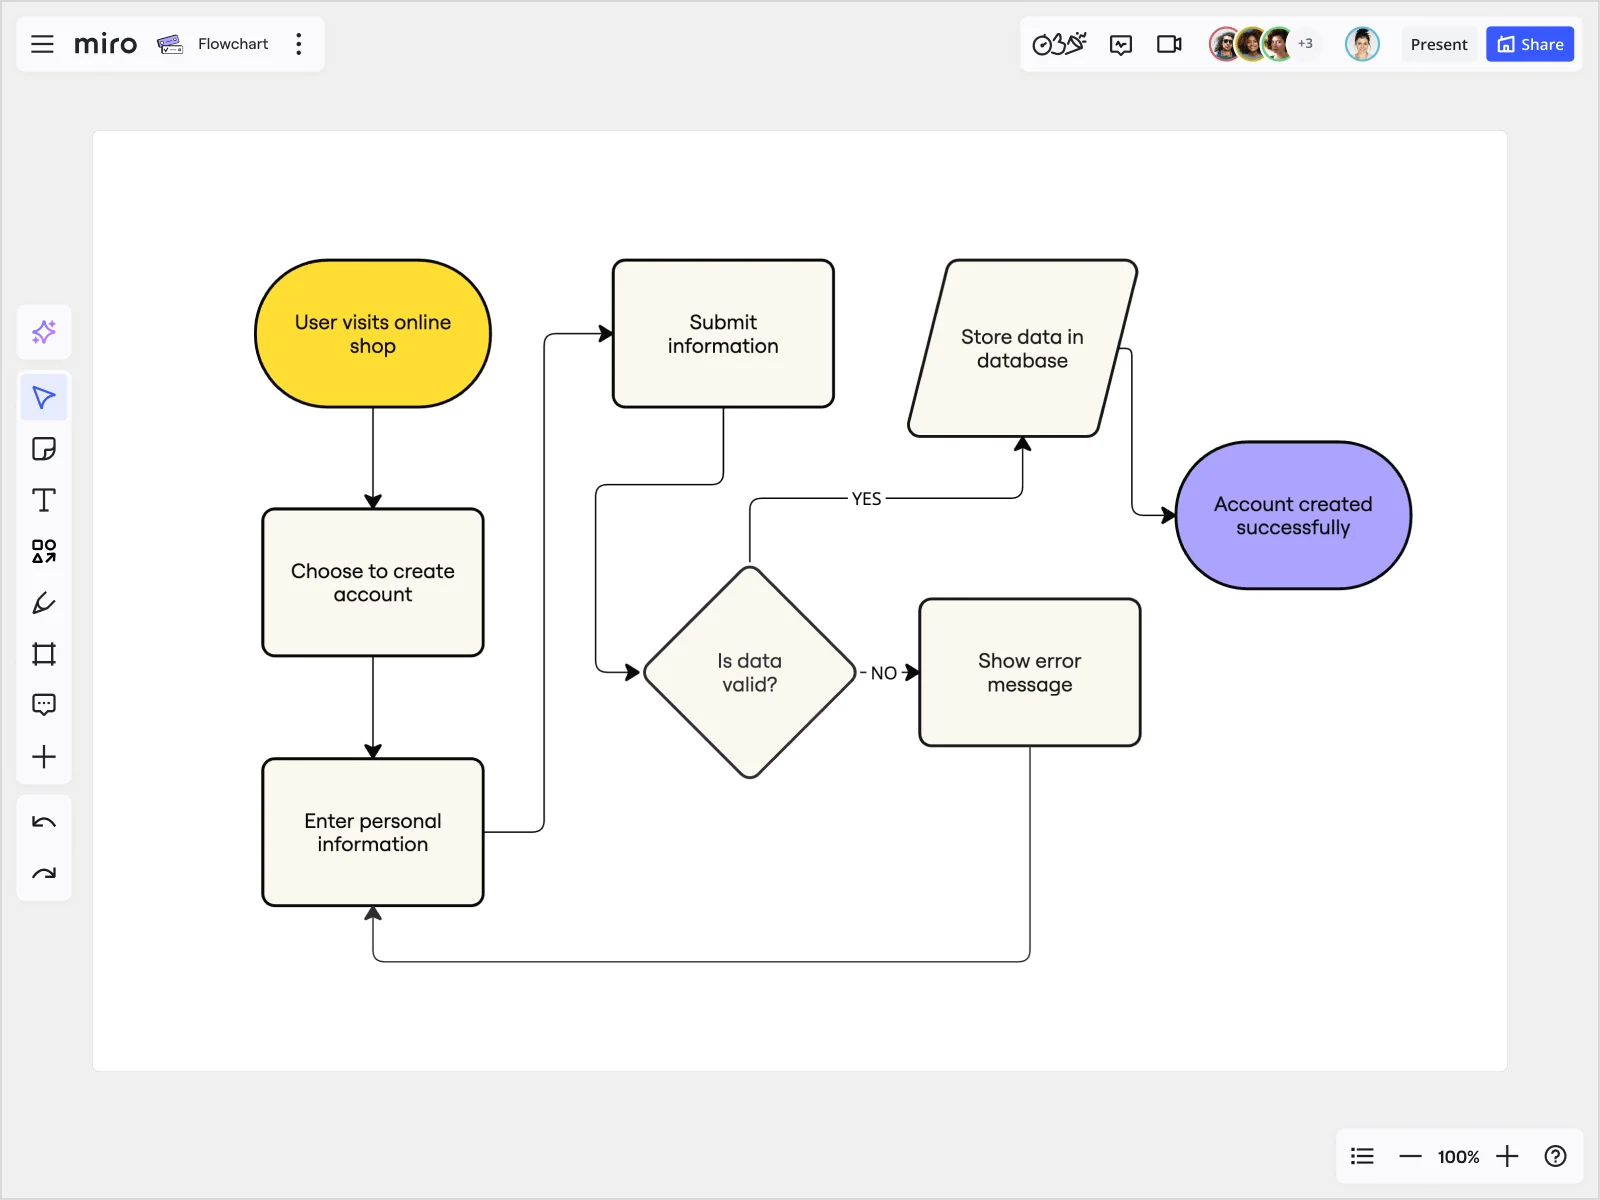
Ovals represent the start and end points of a process, indicating where the process begins and where it concludes.
Rectangles

Rectangles are for tasks or activities within the process. Each rectangle should contain a single, clearly defined task.
Diamonds

Diamonds indicate decision points. These are the crossroads where a process can take multiple paths based on different conditions.
Arrows show the flow direction, guiding you from one step to the next and ensuring logical progression.
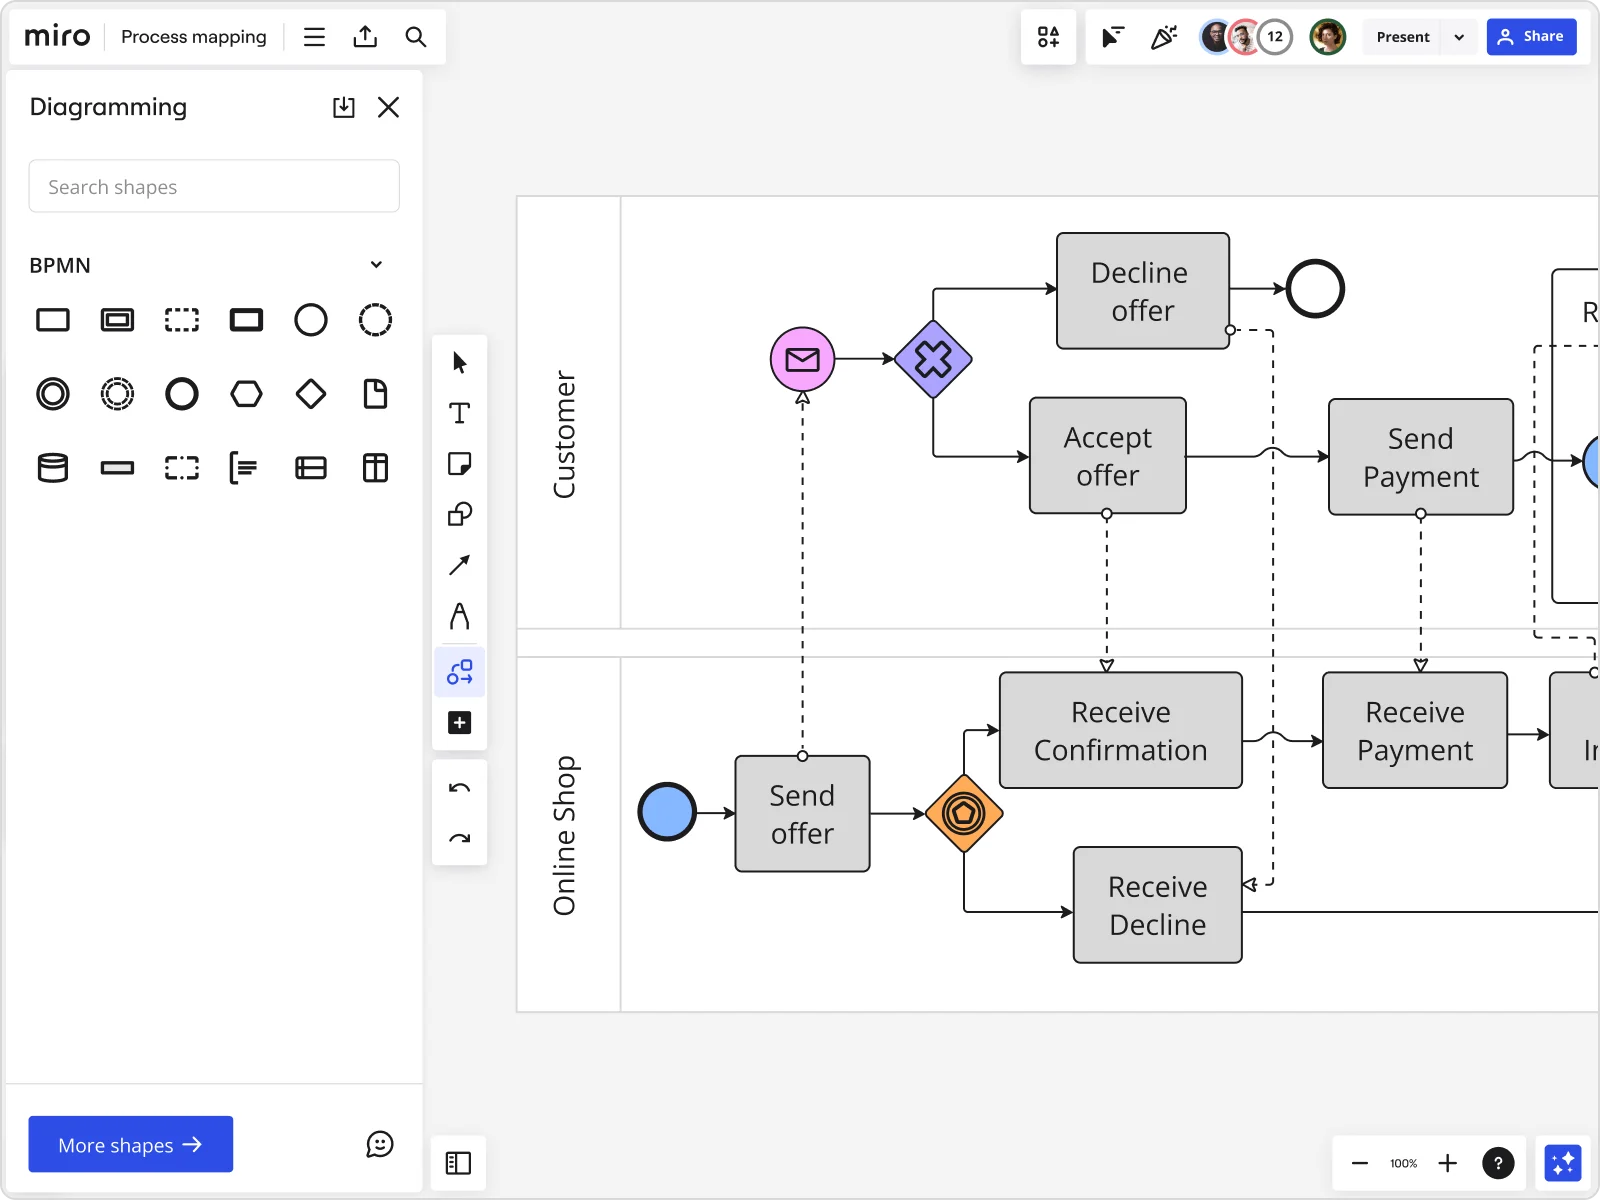
Using these basic symbols, you can map out any process from start to finish. And if you're using Miro, you'll find a rich library of templates and symbols to get you started quickly. Miro's advanced diagramming capabilities allow you to create detailed and interactive process maps, making it easier for your team to visualize and understand complex workflows.
Process mapping examples from Miro's templates library
Miro's templates library offers a wealth of resources to help you create effective process maps. Here are some examples of how you can use these templates to streamline various aspects of your business.
Mapping your supply chain

Efficient supply chain management is crucial for meeting customer demand and minimizing costs. Miro’s supply chain mapping template helps you visualize and optimize each step of your supply chain, from procurement to delivery.
Step-by-step process:
- Define objectives: Improve supply chain efficiency and reduce costs.
- Gather team: Include supply chain managers, procurement officers, and logistics coordinators.
- Outline steps: Map steps from sourcing raw materials, manufacturing, warehousing, to shipping.
- Identify inputs/outputs: Raw materials, finished products, delivery schedules.
- Determine metrics: Lead times, inventory levels, delivery accuracy.
- Create map: Use Miro’s supply chain mapping template to detail each step and flow.
- Review and refine: Identify bottlenecks, streamline processes.
- Implement and monitor: Apply changes, track improvements.
Mapping your product development process

In the fast-paced world of product development, staying organized and efficient is key. Miro’s product development process template allows you to visualize the entire lifecycle of your product, from ideation to launch.
Step-by-step process:
- Define objectives: Streamline product development and improve time-to-market.
- Gather team: Include product managers, designers, engineers, and marketers.
- Outline steps: Map steps from concept creation, prototyping, testing, to launch.
- Identify inputs/outputs: Ideas, prototypes, feedback, final products.
- Determine metrics: Development time, number of iterations, customer feedback.
- Create map: Use Miro’s product development process template to visualize each stage.
- Review and refine: Identify inefficiencies, gather team feedback.
- Implement and monitor: Apply changes, track progress.
Mapping your production
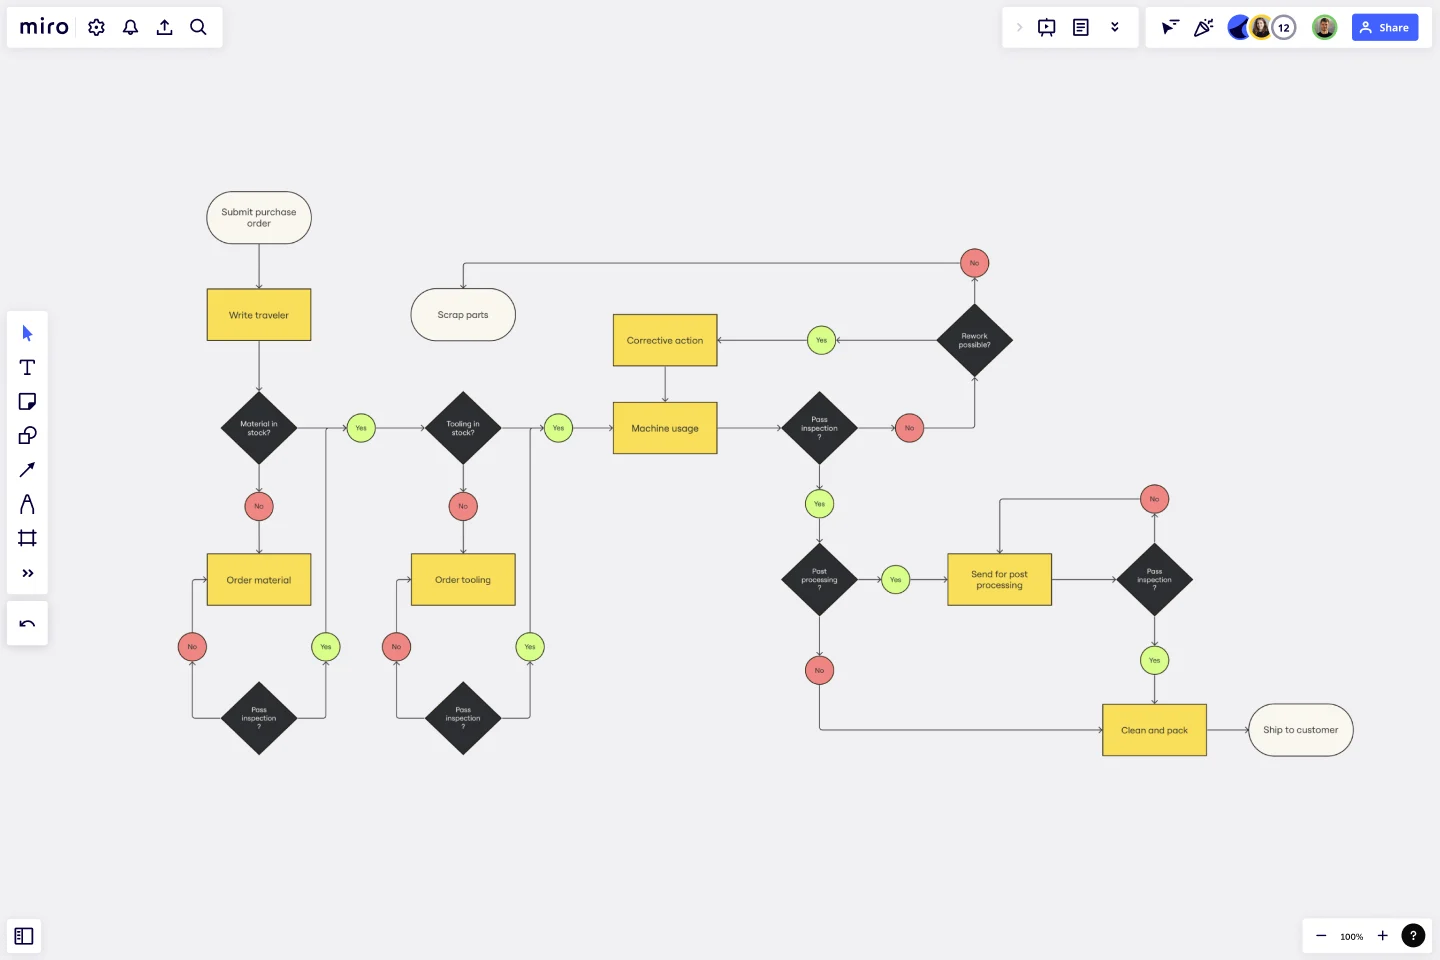
Production efficiency directly impacts your bottom line. Miro’s production mapping template helps you visualize and optimize your production processes, ensuring maximum efficiency and quality control.
Step-by-step process:
- Define objectives: Increase production efficiency and reduce waste.
- Gather team: Include production managers, line workers, and quality control experts.
- Outline steps: Map steps from raw material input, assembly, quality checks, to final product output.
- Identify inputs/outputs: Raw materials, intermediate products, final products.
- Determine metrics: Production time, defect rates, resource utilization.
- Create map: Use Miro’s production mapping template to detail each stage.
- Review and refine: Identify inefficiencies, implement improvements.
- Implement and monitor: Apply changes, monitor production metrics.
Mapping your user flow
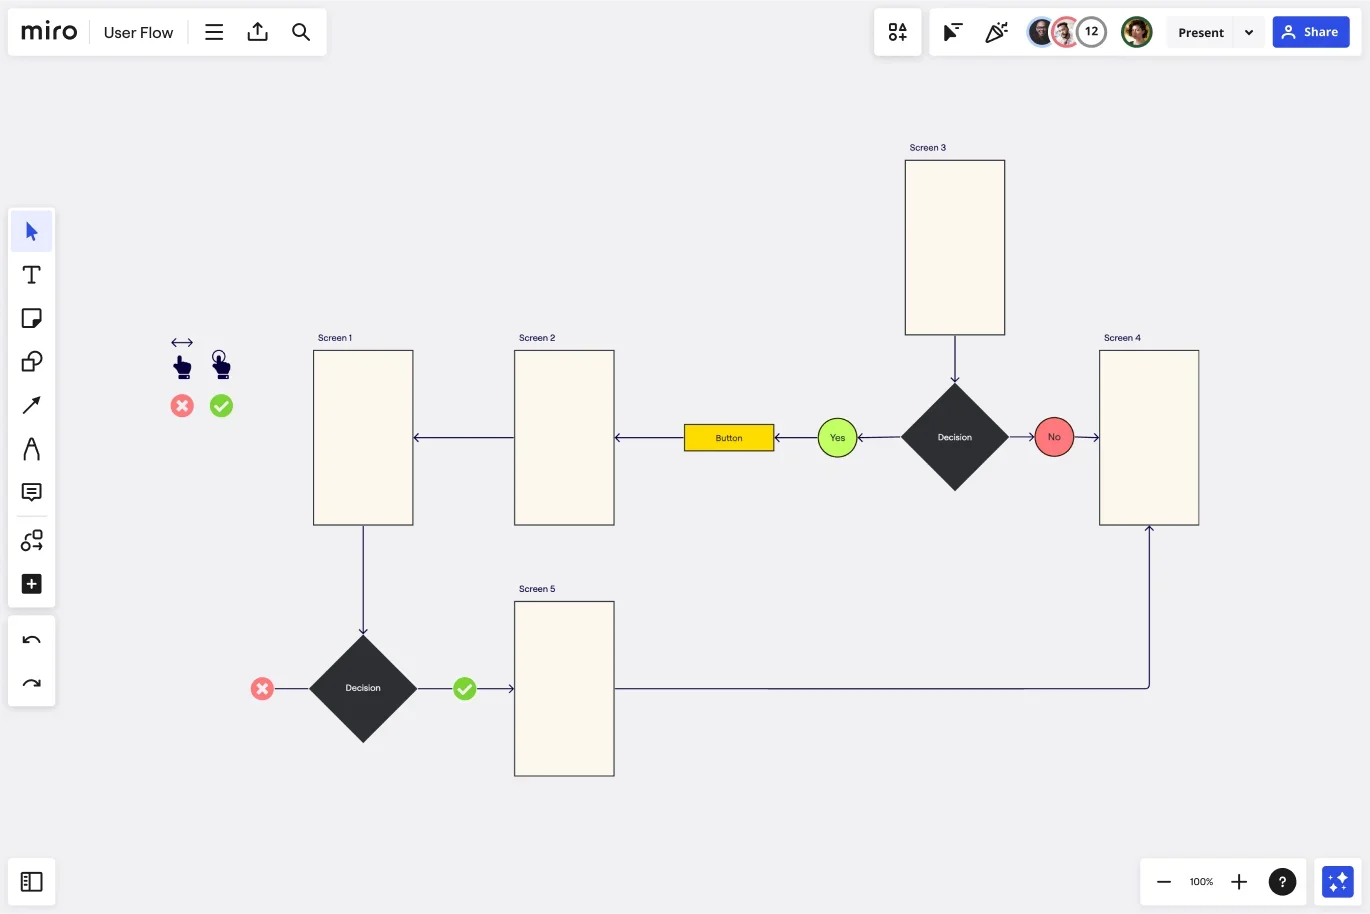
Understanding how users interact with your product is crucial for enhancing user experience. Miro’s user flow mapping template helps you visualize user journeys and identify opportunities for improvement.
Step-by-step process:
- Define objectives: Improve user experience and increase user retention.
- Gather team: Include UX designers, product managers, and customer support.
- Outline steps: Map user interactions from initial engagement, onboarding, daily use, to retention.
- Identify inputs/outputs: User actions, touchpoints, feedback.
- Determine metrics: User engagement, drop-off rates, satisfaction scores.
- Create map: Use Miro’s user flow mapping template to visualize each interaction.
- Review and refine: Identify friction points, optimize user journeys.
- Implement and monitor: Apply changes, track user metrics.
Mapping your team's project

Analyzing and documenting your team’s processes and outcomes is crucial for any project to succeed. The process map templates from Miro is the perfect example of a project process map, helping you visualize how people collaborate at different project stages.
Step-by-step process:
- Define objectives: Map your project's objectives at every stage of the process.
- Outline activities: Identify what each team will do at each stage.
- Determine deliverables: What's the main output for everyone involved?
- Create a project process map: Use Miro’s process map template to visualize your entire project.
- Review it with your team: Share your process map with your team and iterate according to feedback.
Mapping your cross-functional project

Cross-functional projects involve multiple teams working together, often with overlapping responsibilities and dependencies. Miro’s Swimlane diagram template helps you visually organize tasks, responsibilities, and timelines across different teams, ensuring clarity and accountability throughout the project.
Step-by-step process:
- Define objectives: Improve project coordination and ensure clear role distribution among teams.
- Gather team: Include project managers, team leads, and stakeholders from each functional team.
- Outline steps: Break down the project into key phases and tasks. Assign each task to a specific team or individual.
- Identify inputs/outputs: Task requirements, deliverables, approvals, and hand-offs between teams.
- Determine metrics: Task completion rates, time to completion, and hand-off efficiency.
- Create map: Use Miro’s Swimlane diagram template to separate responsibilities by team or department, showing the flow of work horizontally through the lanes.
- Review and refine: Ensure all teams understand their roles and responsibilities. Refine workflows to eliminate bottlenecks or delays between teams.
- Implement and monitor: Assign tasks, track progress, and monitor for any breakdowns in communication or hand-offs.
Mapping your business operations
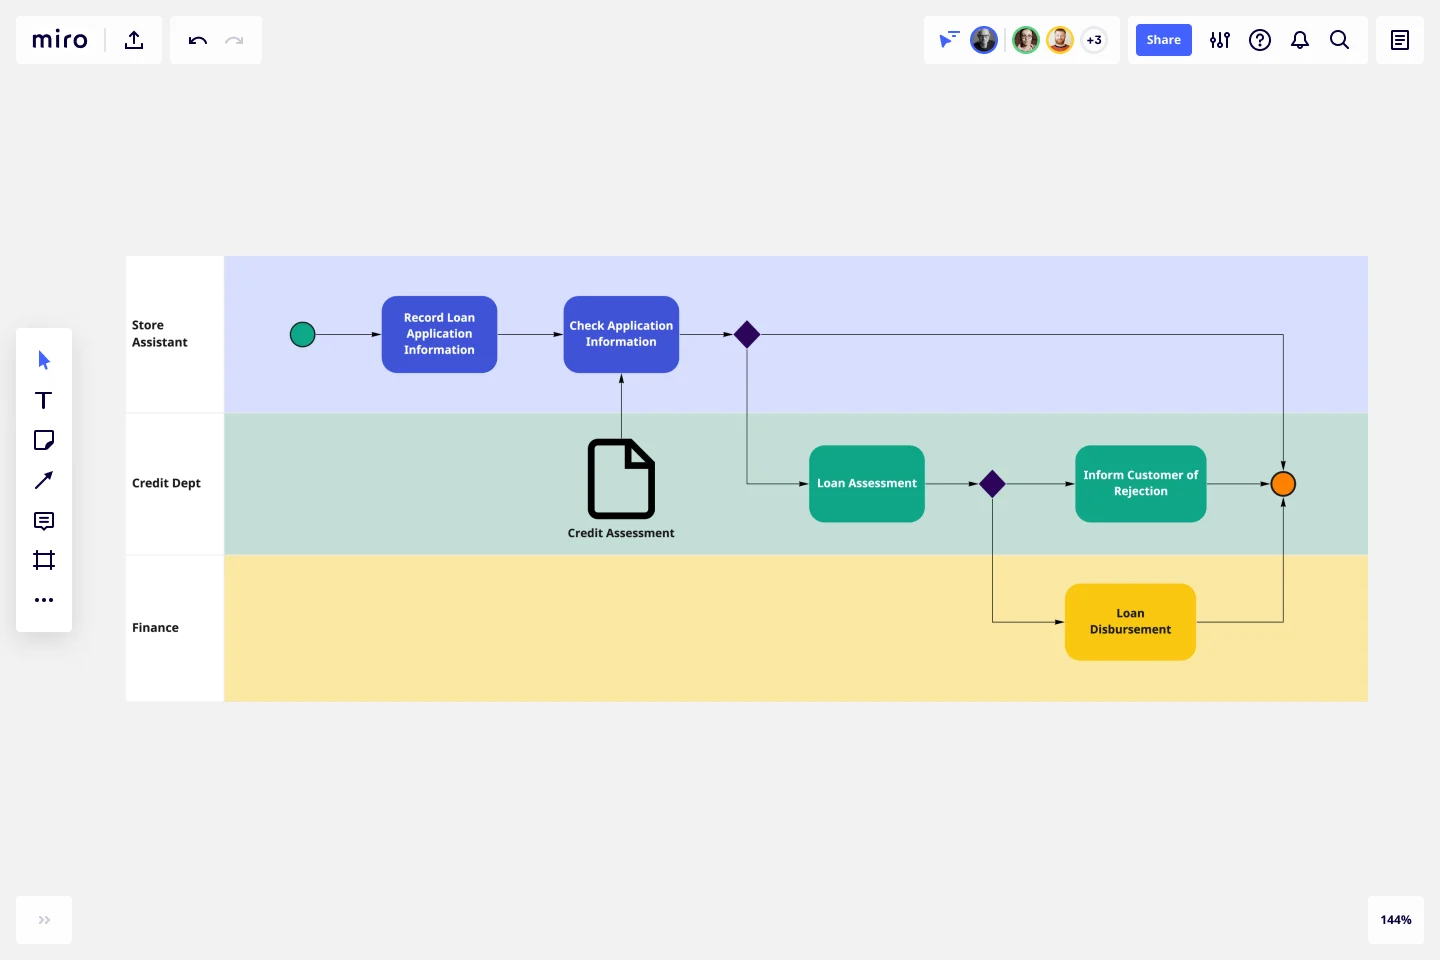
Business Process Model and Notation (BPMN) is a standardized method for modeling complex business processes. Miro’s BPMN diagram template helps you map, analyze, and improve your business operations with a detailed and comprehensive overview, ensuring operational efficiency and clarity.
Step-by-step process:
- Define objectives: Gain a clear understanding of complex business processes, reduce inefficiencies, and standardize workflows.
- Gather team: Involve operations managers, process owners, and key stakeholders from across the business.
- Outline steps: Break down the entire business operation into specific processes, such as procurement, customer onboarding, or service delivery.
- Identify inputs/outputs: Define the data, materials, or actions entering and exiting each process. Include decision points and conditions that affect process flow.
- Determine metrics: Time-to-completion for each step, error rates, cost per process, and overall process efficiency.
- Create map: Use Miro’s BPMN diagram template to represent tasks, events, decisions, and flows in a clear, standardized format, ensuring consistency across your business operations.
- Review and refine: Work with the team to ensure the diagram reflects real-world operations. Identify areas for improvement, such as automation opportunities or process consolidation.
- Implement and monitor: Roll out process improvements and monitor key metrics to track operational performance.
These process map examples from Miro’s templates library demonstrate the power of process mapping in various business areas. Whether you’re looking to optimize your supply chain, streamline product development, improve production efficiency, or improve user experience, Miro has the tools you need to create effective process maps that drive real results.
Common process-mapping mistakes to avoid
Even with the best tools, there are common pitfalls to avoid when creating process maps. Here are a few to watch out for:
Overcomplicating the map: Keep it simple. Too much detail can make the map confusing. Focus on key steps and avoid unnecessary complexity.
Ignoring stakeholder input: Make sure to involve everyone who plays a role in the process. Their insights are crucial for an accurate and comprehensive map.
Failing to update the map: Processes evolve, and so should your maps. Review and update them regularly to reflect any changes in the workflow.
Avoiding these mistakes ensures your process maps remain clear, accurate, and useful. Miro's collaborative features make it easy to gather input from all stakeholders and keep your maps up to date.
Process mapping best practices
To get the most out of your process maps, follow these best practices:
Start with a clear goal: Know what you want to achieve with your process map. Whether it's improving efficiency, reducing costs, or enhancing customer satisfaction, having a clear objective guides your mapping efforts.
Use consistent symbols and notation: This ensures clarity and understanding across your team. Standardized symbols make it easier for everyone to follow the process map.
Collaborate and communicate: Use tools like Miro to involve your entire team and gather diverse insights. Collaboration fosters a deeper understanding of the process and leads to better outcomes.
Review and refine: Process maps are living documents. Keep them updated and refine them as needed to reflect changes and improvements in your workflow.
Create process maps with confidence
Ready to create process maps that drive real change? Miro's visual workspace for innovation is your go-to tool. With advanced diagramming capabilities, Miro AI, and an extensive templates library, you'll create process maps that are not only clear and effective but also collaborative and dynamic.
Start mapping your processes today and see how Miro can transform the way your team works. Our integrations with various tools and platforms make it easy to incorporate Miro into your existing workflows, ensuring a seamless experience from start to finish.
Author: Miro Team
Last update: October 16, 2025