
Workflow chart examples to manage your processes with confidence

Summary
In this guide, you will learn:
- Types and purposes of workflow diagrams: workflow diagrams, process maps, flowcharts, swimlane diagrams, work breakdown structures.
- How to select and customize workflow and process templates.
- Key steps to create a workflow diagram: defining processes, start/end points, gathering info.
- How to use visual elements and symbols in workflows effectively.
- Ways to collaborate in real-time using Miro features.
- Best practices for reviewing, tracking, and improving workflow diagrams.
Try Miro now
Join thousands of teams using Miro to do their best work yet.
When it comes to improving and visualizing complex processes, workflow charts are your best friend. They're like the ultimate cheat sheet for understanding how everything fits together and where improvements can be made. But where do you start? Right here, with a rundown of some of the most effective workflow chart examples. Let’s dive in and see how these diagrams can streamline your processes and boost your team's productivity.
Workflow diagrams explained
Imagine trying to explain your favorite recipe to a friend. You could describe each step in detail, but a flowchart or diagram would be much clearer, right? The same principle applies to workflows. A workflow diagram visually represents a process from start to finish, showing the sequence of steps, decision points, and interactions between different elements. These diagrams help teams see the big picture and the finer details all at once.
Whether you’re mapping out a new project or optimizing an existing one, a well-crafted workflow diagram can clarify roles, streamline communication, and highlight areas for improvement. And the best part? You don’t need to be a design whiz to create one. With Miro, you can easily build, share, and collaborate on detailed workflow diagrams in real time or asynchronously.
Cross-Functional Flowchart
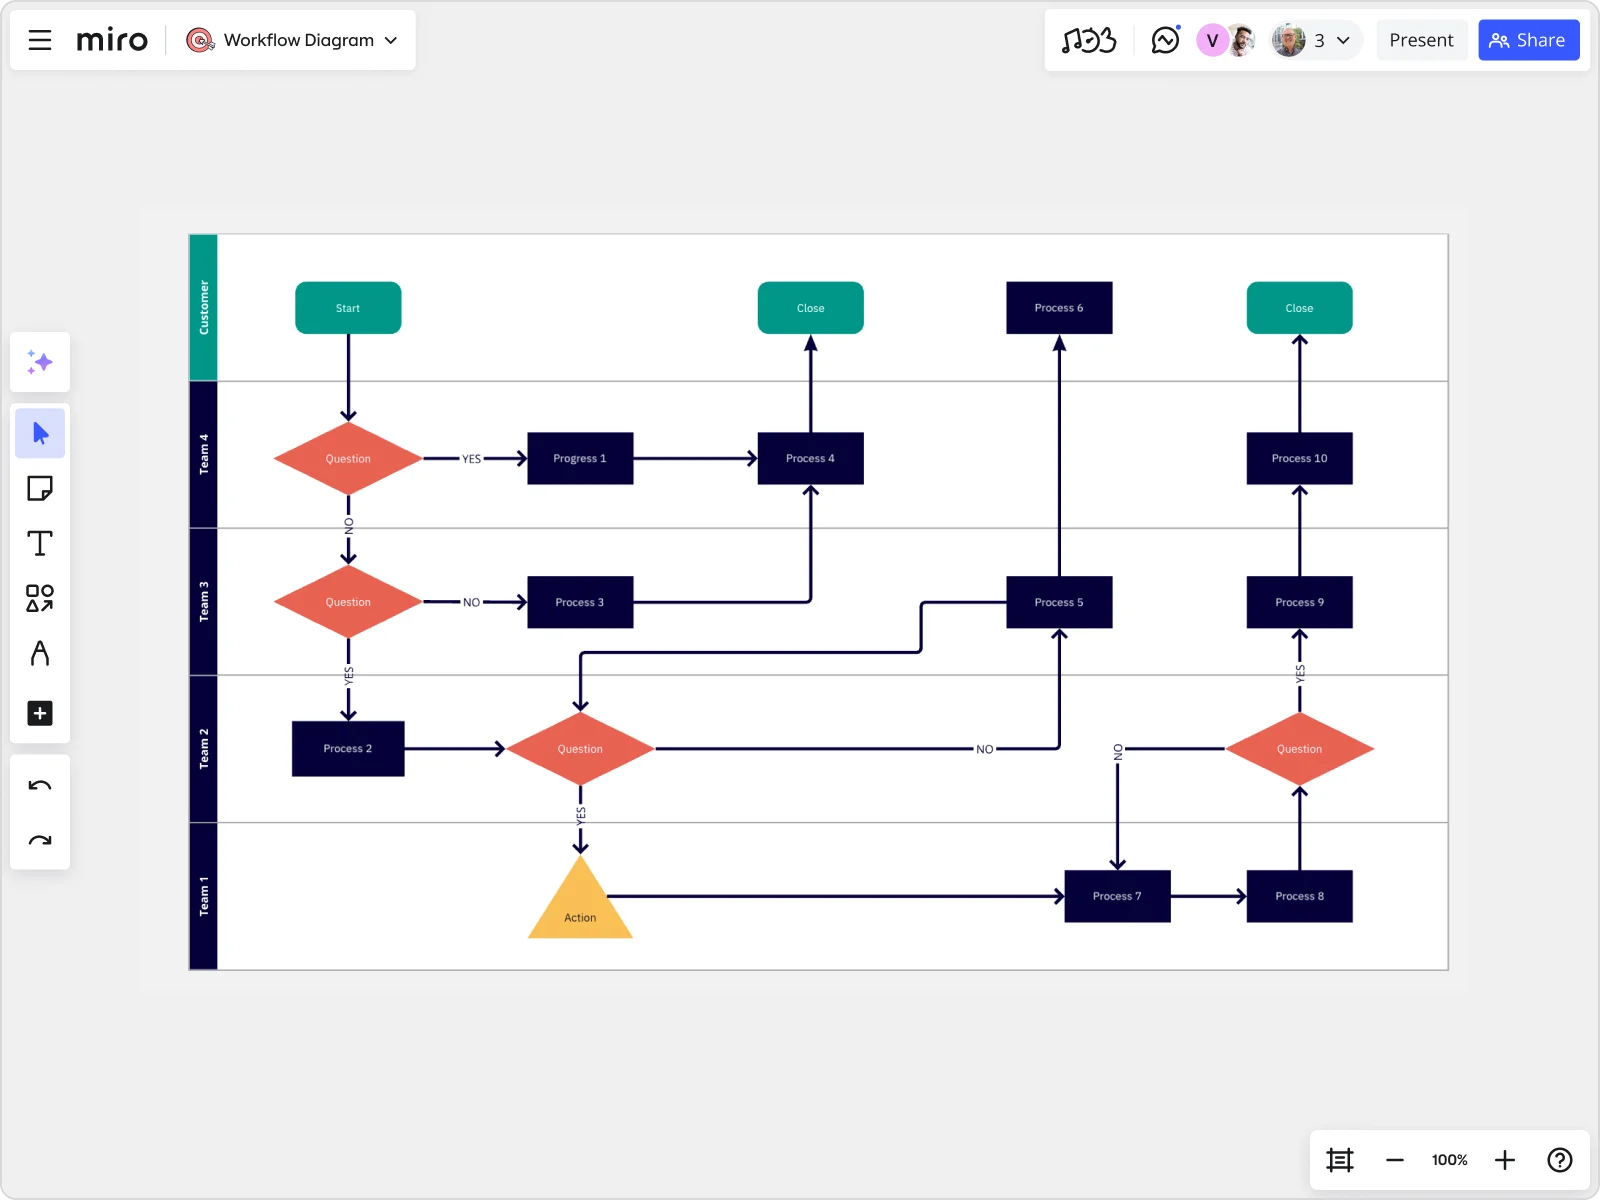
A cross-functional flowchart, also known as a swimlane diagram, is perfect for processes that span multiple departments or teams. Picture it like a relay race, where each team member has their lane and specific role. This type of flowchart helps you track responsibilities and handoffs between different groups, ensuring nothing slips through the cracks.
For example, in a product development process, you might have lanes for marketing, design, development, and quality assurance. A cross-functional flowchart shows how tasks move between these teams and where potential bottlenecks could occur. By visualizing the entire process, you can identify inefficiencies and streamline operations. And with Miro’s advanced diagramming capabilities, creating these charts is a breeze.
Swimlane Diagram

Swimlane diagrams are similar to cross-functional flowcharts but focus more on individual roles within a process. Think of it like a detailed roadmap for a single team’s journey. Each "lane" represents a person or a specific role, outlining their tasks and how they interact with others.
These diagrams are particularly useful for complex projects with many moving parts. They help ensure everyone knows their responsibilities and how their work fits into the larger picture. Using Miro’s visual workspace, you can quickly design swimlane diagrams, complete with all the necessary details and real-time collaboration features to keep your team aligned and on track.
Workflow Diagram
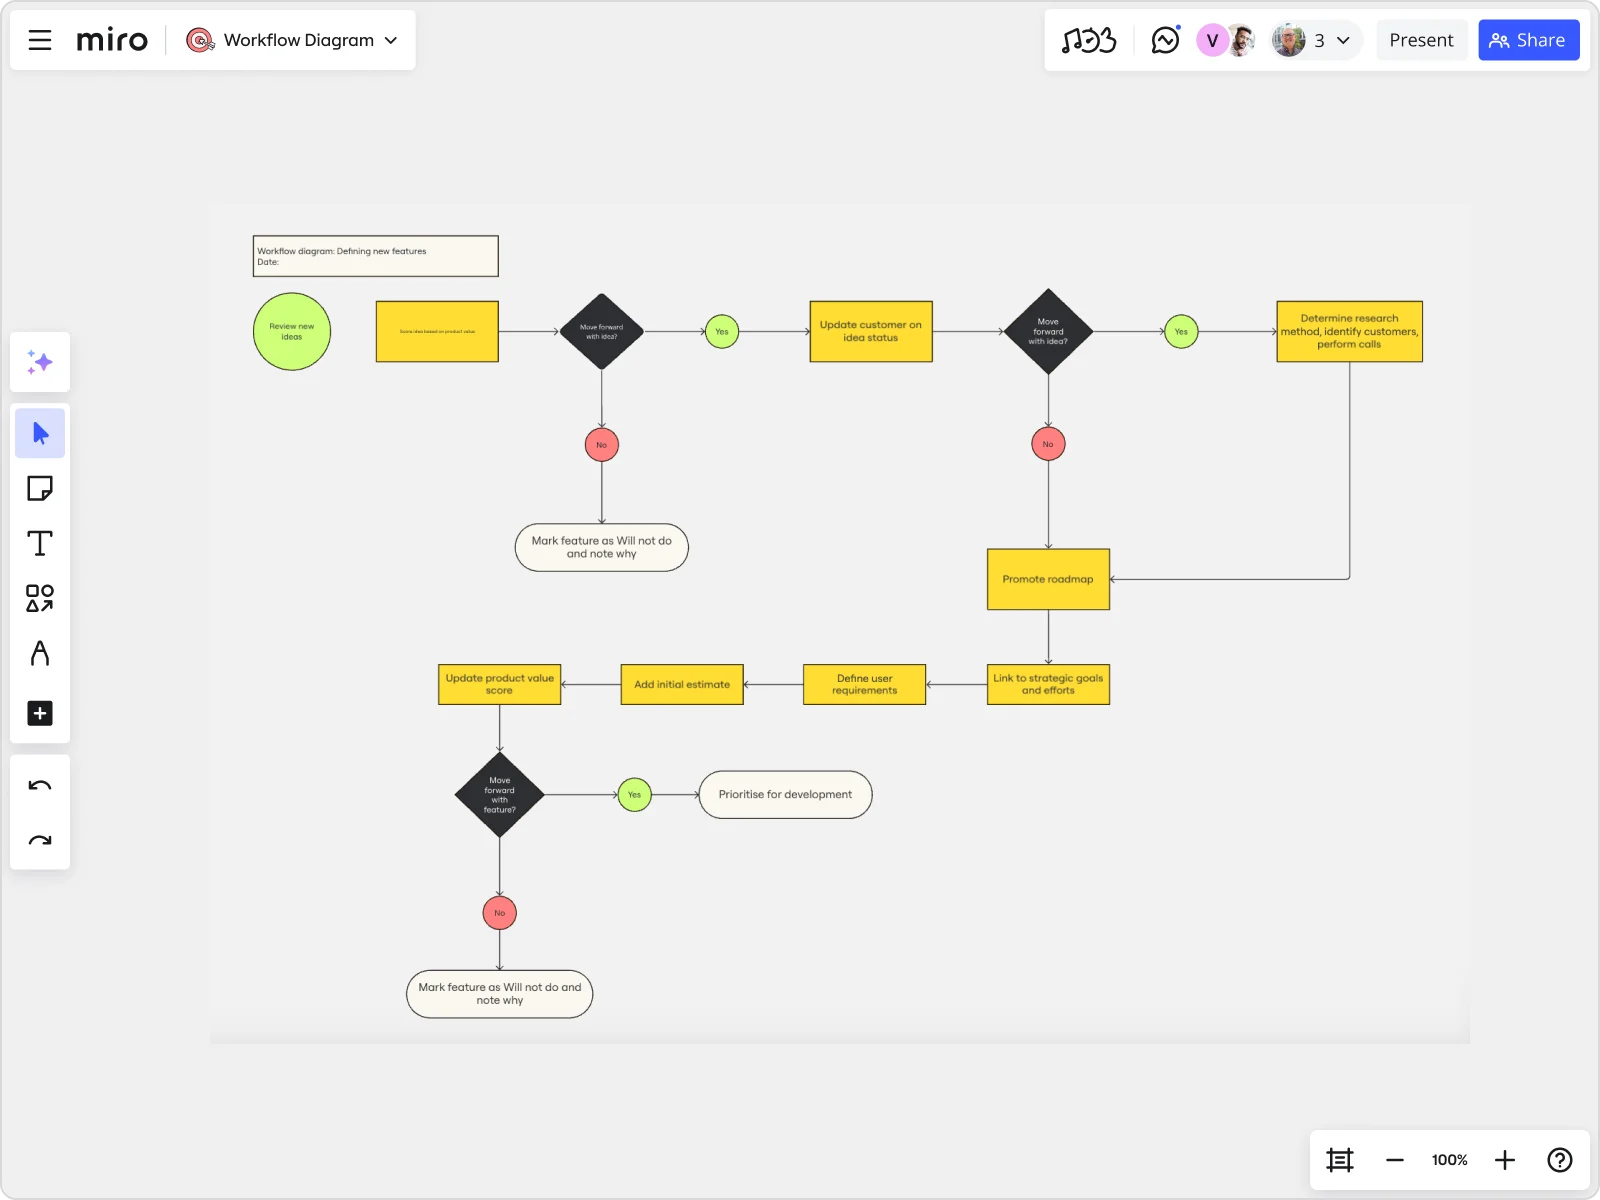
The classic workflow diagram is your go-to for mapping out any process. From simple sequences to intricate procedures, this type of diagram is versatile and straightforward. It highlights the flow of tasks, decision points, and potential outcomes, making it easier to spot inefficiencies and areas for improvement.
Whether you're documenting a new employee onboarding process or outlining a customer service protocol, a workflow diagram helps keep everyone on the same page. With Miro’s powerful diagramming shapes pack and AI features, you can create clear, detailed diagrams that enhance understanding and drive efficiency.
Work Breakdown Structure
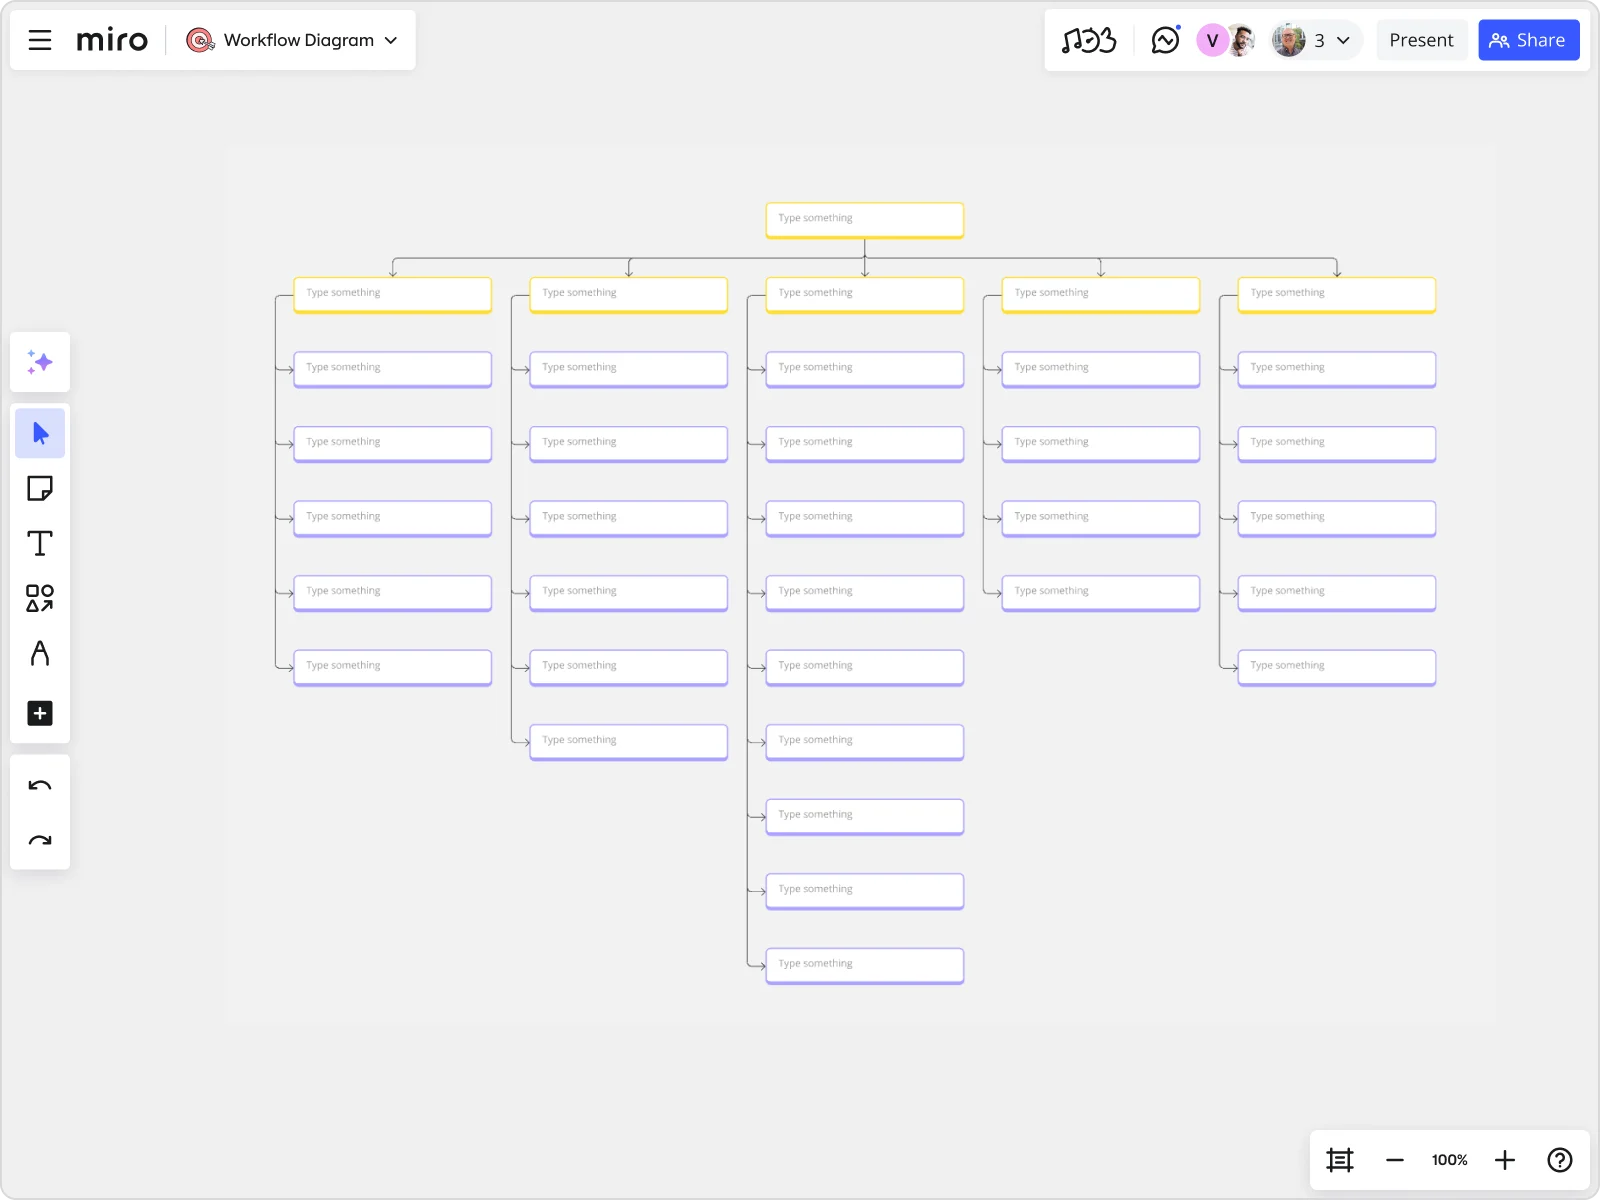
A work breakdown structure (WBS) takes your project from a high-level overview down to the nitty-gritty details. It’s like turning a complex puzzle into manageable pieces. This diagram breaks down a project into smaller components, making it easier to assign tasks, manage timelines, and track progress.
By visualizing the entire project in a hierarchical format, teams can see dependencies and allocate resources more effectively. Miro’s visual workspace makes creating and sharing WBS charts simple, helping teams collaborate seamlessly and keep projects on track.
Flowchart
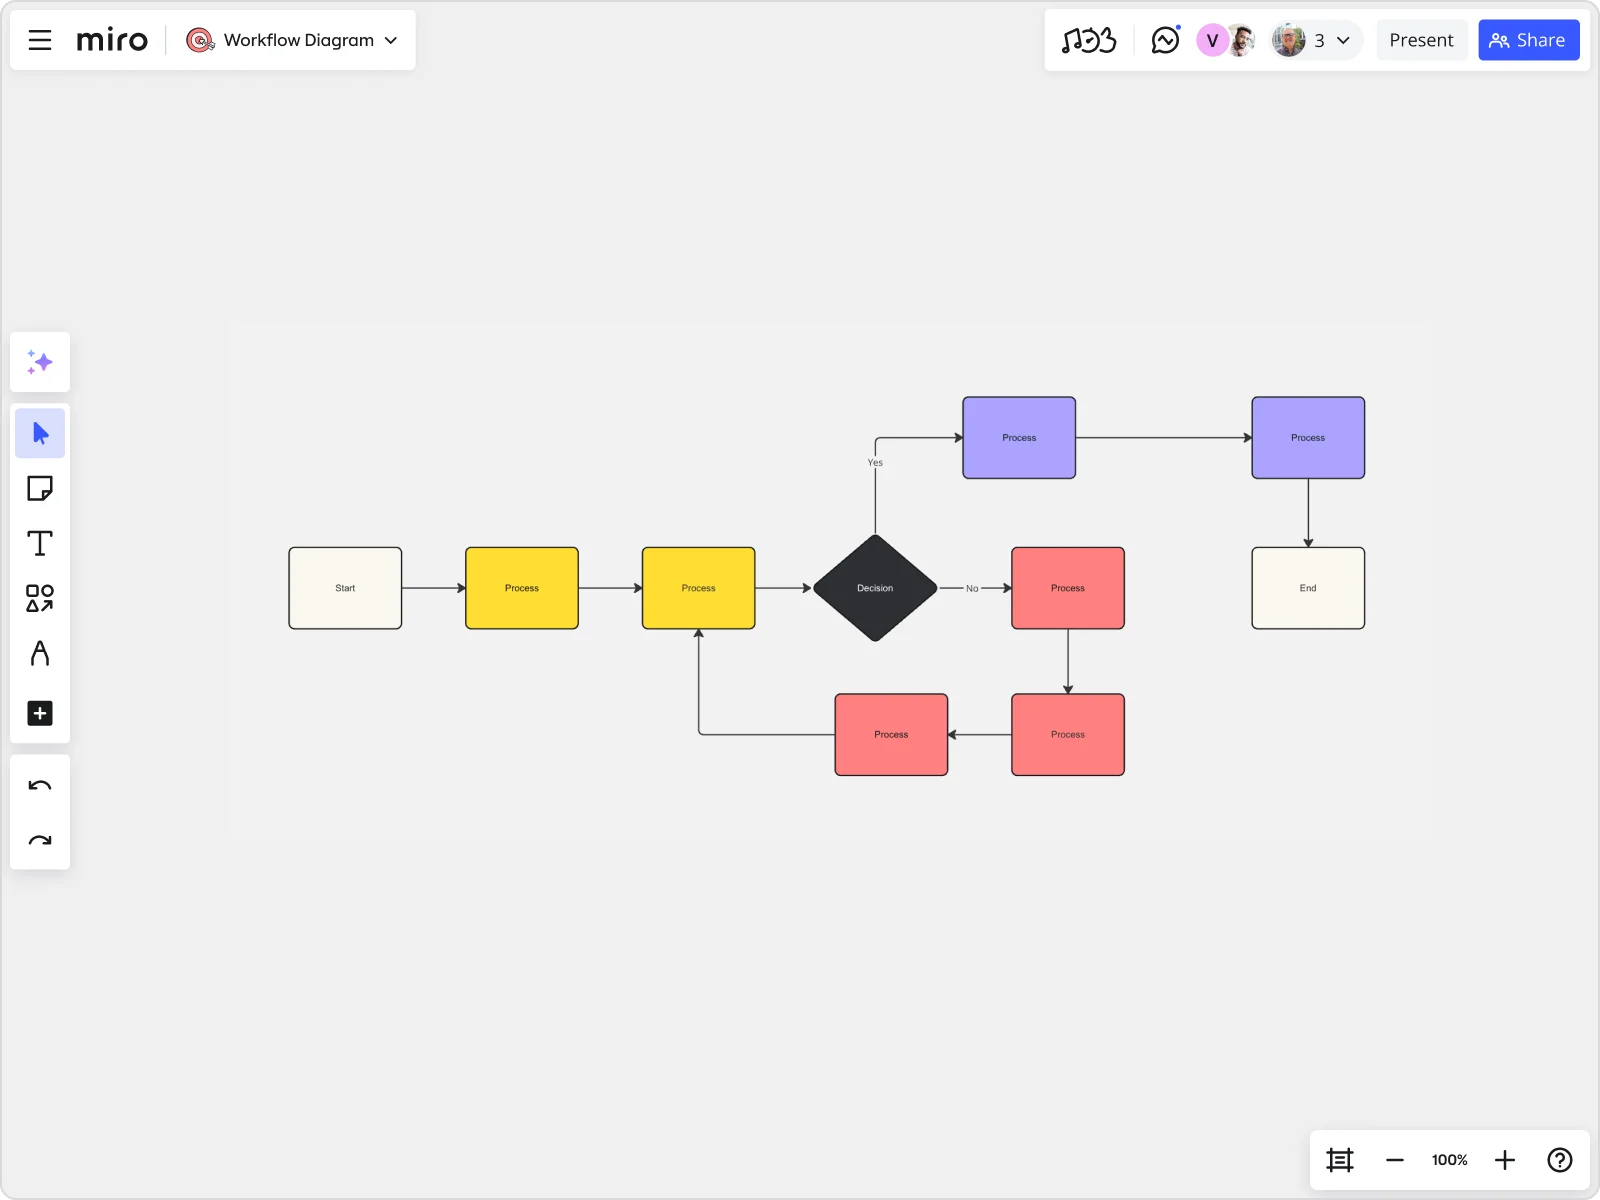
Flowcharts are the bread and butter of process mapping. They’re versatile, easy to understand, and can be used for virtually any process. Whether you’re troubleshooting a technical issue or planning a marketing campaign, a flowchart helps you visualize the steps, decision points, and possible outcomes.
Using Miro’s innovation workspace, you can create detailed flowcharts with a variety of shapes and connectors, making it easy to illustrate even the most complex processes. Plus, with real-time collaboration features, your team can work together to refine and optimize the flowchart, ensuring everyone is aligned and ready to execute.
Design Process Flowchart
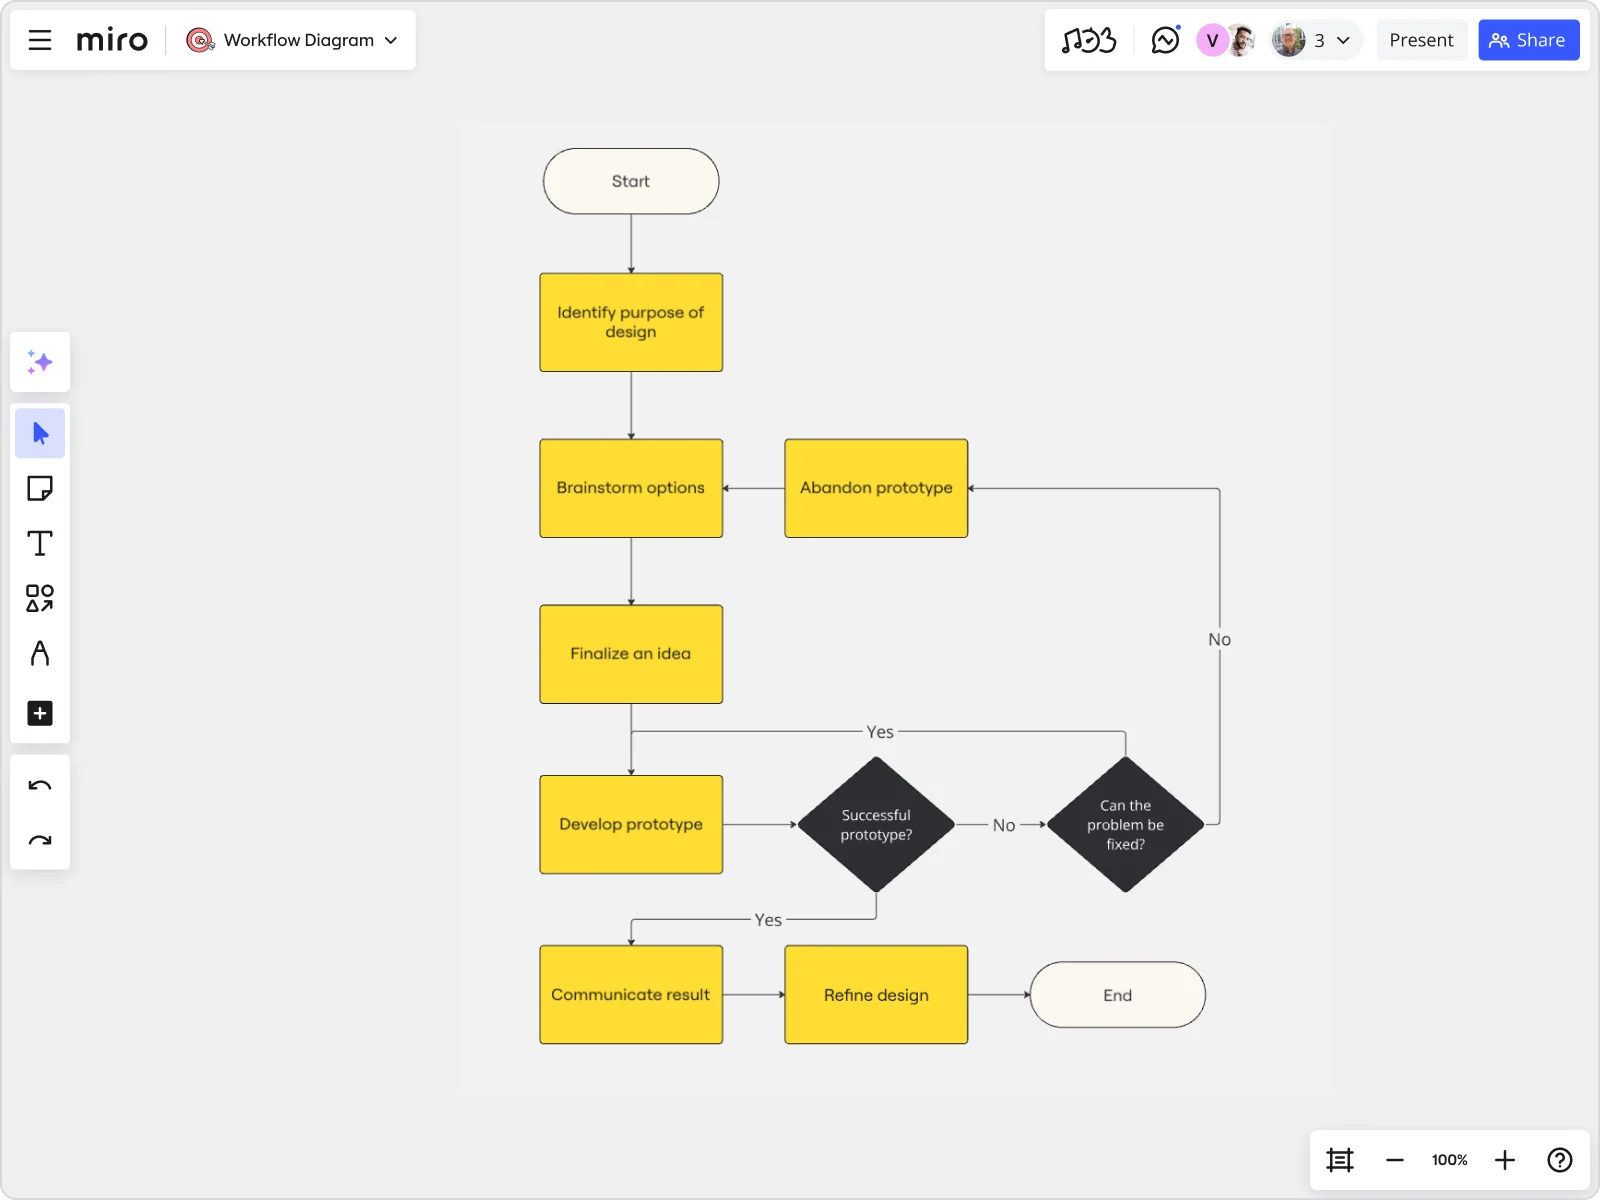
Design processes often involve multiple stages, feedback loops, and collaboration across different teams. A design process flowchart captures this complexity and provides a clear roadmap for taking a project from concept to completion. It outlines each stage of the design process, from initial brainstorming and prototyping to final revisions and delivery.
By visualizing the entire design process, teams can identify potential bottlenecks and ensure that everyone is working towards the same goals. Miro’s advanced diagramming capabilities and collaboration features make it easy to create and share detailed design process flowcharts, keeping your team aligned and efficient.
Best workflow chart practices
Creating effective workflow charts isn’t just about throwing shapes onto a page. There are best practices to follow to ensure your diagrams are clear, informative, and actionable. Here are a few tips to elevate your workflow charts:
- Start with a clear goal: Before you begin, understand what you want to achieve with your workflow chart. Are you mapping out a new process, identifying bottlenecks, or improving existing workflows? Having a clear objective will guide the structure and detail level of your diagram.
- Involve the right stakeholders: Engage team members who are directly involved in the process. Their insights can provide valuable details and help ensure the accuracy of the diagram. Use Miro’s real-time collaboration features to gather input and make adjustments on the fly.
- Keep it simple: Avoid overcomplicating your diagrams. Use clear, concise labels and standard symbols to ensure your chart is easy to understand. Too much detail can be overwhelming and defeat the purpose of creating a workflow chart.
- Use standardized symbols: Stick to commonly recognized diagramming symbols and shapes. This helps ensure that anyone looking at the chart can easily understand it without needing additional explanations.
- Validate with your team: Once your initial diagram is ready, share it with your team for validation. Encourage feedback and make necessary adjustments. This collaborative approach ensures that the workflow chart accurately reflects the process and gains team buy-in.
- Iterate and improve: Workflow diagrams are not set in stone. Regularly review and update them based on feedback and changes in the process. Continuous improvement ensures that your workflows remain efficient and effective.
- Highlight key points and decision nodes: Make sure critical steps and decision points are clearly marked in your diagram. This helps in quickly identifying where major actions occur and where potential delays or issues might arise.
- Use color coding for clarity: Leverage color coding to differentiate between various tasks, roles, or stages in your process. This visual cue makes it easier to follow the flow and understand different elements of the diagram at a glance.
- Focus on scalability: Design your workflow charts with scalability in mind. As your project or team grows, your processes might become more complex. Ensure that your diagrams can be easily adjusted to accommodate new tasks, roles, or steps without needing a complete overhaul.
- Use templates: Take advantage of pre-built templates available in Miro. These templates can serve as a great starting point and ensure that you’re following industry-standard practices. They also save time and provide a professional look to your workflow diagrams.
- Incorporate feedback loops: Build feedback loops within your workflow charts to continuously identify areas for improvement. This helps maintain the effectiveness of your processes and encourages a culture of constant enhancement and innovation.
- Prioritize clarity over aesthetics: While it’s tempting to create visually stunning diagrams, prioritize clarity and readability. Ensure that anyone, regardless of their familiarity with the process, can understand the workflow by glancing at the chart.
- Use Miro AI for optimization: Miro’s AI can help analyze your workflow diagrams and suggest optimizations. Use this feature to identify potential improvements and ensure your workflows are as efficient as possible.
- Monitor and measure effectiveness: Regularly track the performance of your workflows using key metrics. This can help you identify areas that need improvement and ensure that your workflow diagrams are delivering the intended results.
- Use layers for complex workflows: For particularly complex processes, consider using layers in your workflow diagrams. This allows you to present high-level overviews and detailed breakdowns without overcrowding a single diagram.
By following these best practices, you can create workflow charts that are not only visually appealing but also highly functional and effective. Miro’s innovation workspace is designed to support these best practices, offering a range of tools and features that make creating, sharing, and refining workflow charts a collaborative and efficient process.
Create your workflow chart with confidence
Workflow charts are indispensable tools for visualizing and improving processes. From cross-functional flowcharts to design process flowcharts, each type serves a specific purpose and offers unique insights. By incorporating these diagrams into your team's workflow, you can enhance clarity, streamline communication, and drive efficiency.
Miro, as your go-to innovation workspace, provides all the tools and features you need to create detailed, effective workflow charts. With its advanced diagramming capabilities, AI features, and strong collaboration tools, Miro makes it easy to bring your workflows to life and keep your team aligned.
Remember, the key to effective workflow charts is to start with a clear goal, involve the right stakeholders, keep it simple, and continuously iterate. By following these best practices, you can ensure your workflow diagrams are valuable assets in your process improvement toolkit.
Ready to visualize your processes with confidence? Start creating your workflow diagrams with Miro today and take your team's productivity to the next level.
Author: Miro Team
Last update: October 14, 2025