What is BPMN? A Guide to Business Process Modeling
Summary
In this guide, you will learn:
- What BPMN is and its role in business process management
- History and development of BPMN as a global standard
- Key components and visual elements in BPMN diagrams
- How BPMN facilitates communication and collaboration
- Practical steps to create BPMN diagrams
- Scope and limitations of BPMN
Collaborative AI Workflows
Join thousands of teams using Miro to build the right thing, faster.
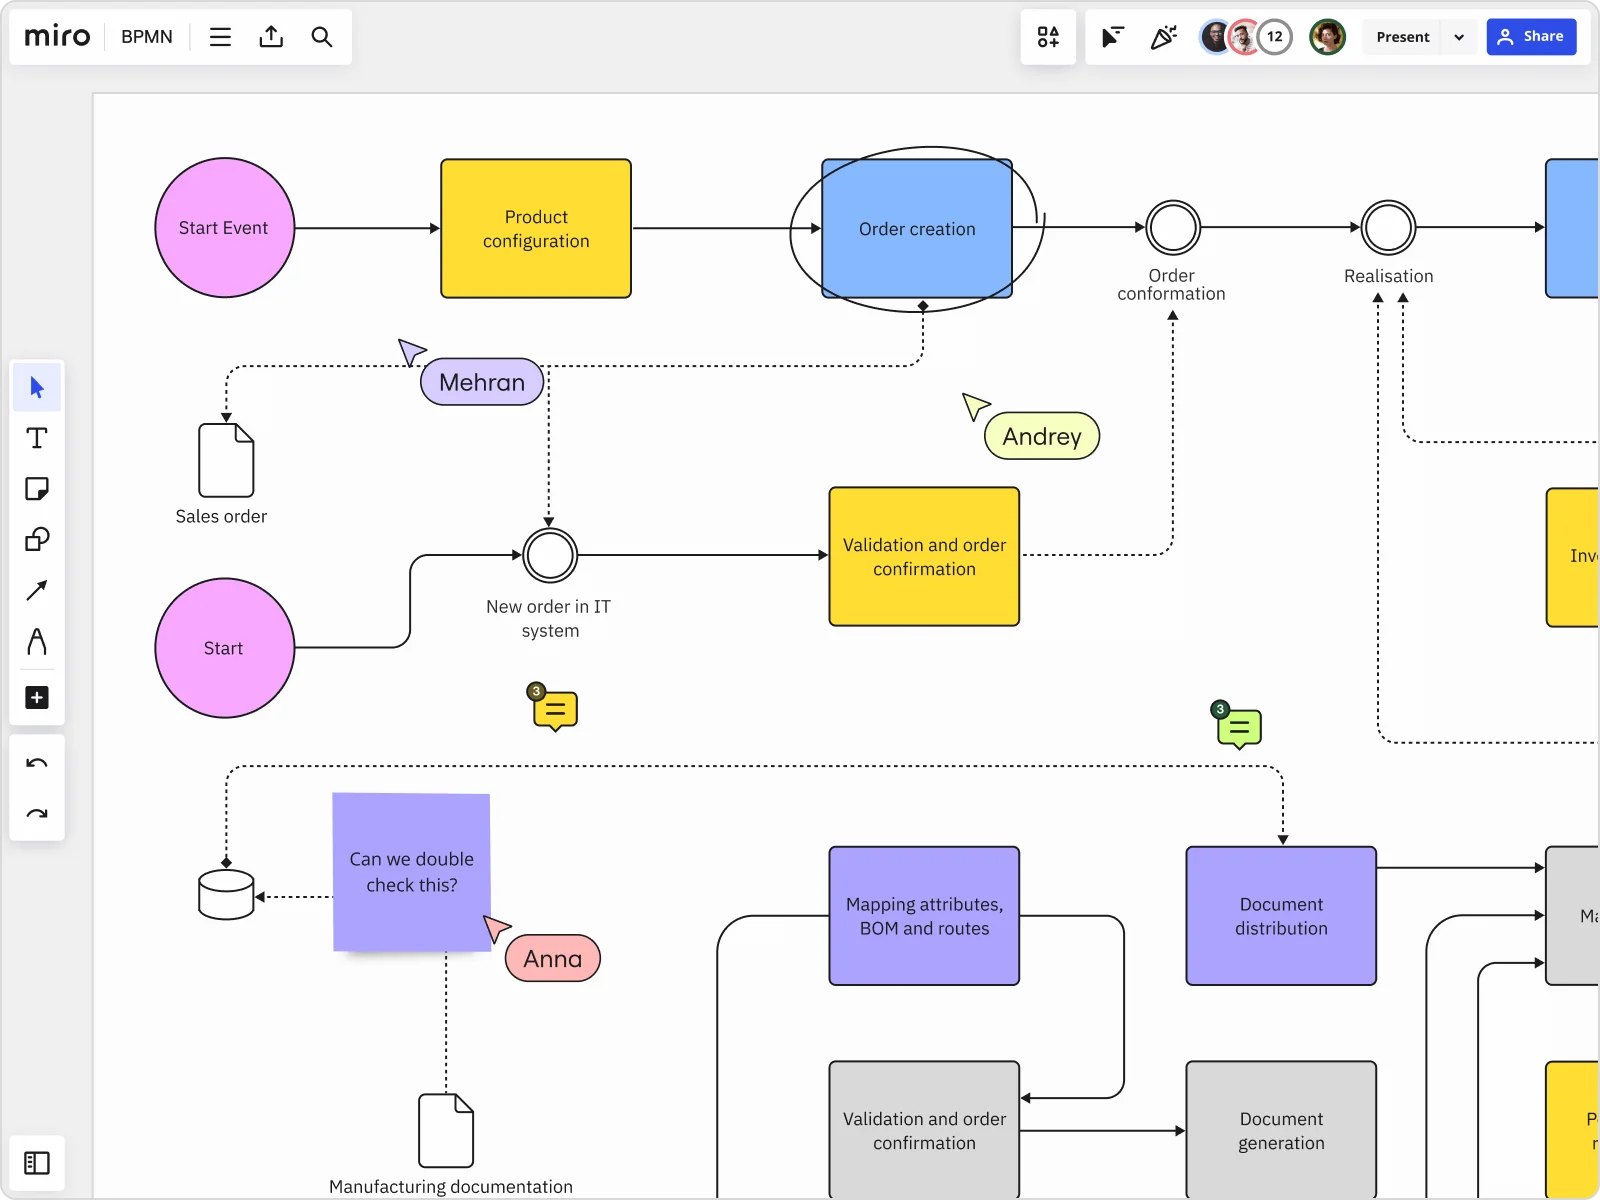
What is BPMN?
Business Process Modeling Notation (BPMN) is a method for outlining a business process. Project managers and business analysts use it to visualize how a process works, what’s included in that process, and what the outcome should be. A BPMN diagram is a visual representation of this process. Making a BPMN diagram can help you gain a clear understanding of your business processes to help improve communication and collaboration across your team. A BPMN diagram is a type of flowchart that uses standardized icons to represent the different elements and flow of a business process. BPMN was originally developed in 2004 by the Business Process Management Initiative (BPMI). A year later, BPMI merged with the Object Management Group (OMG), a computer industry standards consortium. Together, they released a specification document that outlined the BPMN notation and semantics, including the best practices for creating a BPMN diagram. Then, in 2011, OMG released the BPMN 2.0 specification, which offered a more detailed standard for business process design. This included a richer set of symbols and notations for creating business process diagrams.
What are the four categories of BPMN?
BPMN symbols fall under four main areas: flow objects, connecting objects, artifacts, and swimlanes. Let’s take a look at each of these in more detail.
Flow objects
BPMN flow symbols are the elements that connect and form the process flow. They include the following:
Events - An event represents something that happens in the process. For example, “order confirmation” or “payment received” could represent part of the shipping and delivery process. In the diagram, events are circles. There are sometimes icons within the circle that further explain what the event means. For example, the “payment received” event could be represented by a pile of coins or a dollar bill.
Activities - Activities appear in a BPMN diagram as a rounded rectangle. They represent the parts of the process that require action — for example, “package the product” or “track the shipment.” Activities can also include tasks and a variety of sub-processes.
Connecting objects
These are the connection lines and arrows that symbolize how objects relate to each other and how the process flows from one activity to the next. Here are some of the different connecting objects:
Sequence flow - Solid lines and arrowheads depict the order (or sequence flow) of activities. These lines also identify dependencies in your workflow, highlighting which tasks must happen for the process to move forward.
Message flow - Message flow lines are dashed with an open circle at the start and an open arrowhead at the end. They outline which events or activities cross organizational boundaries. For example, “customer places an order” could be an event in the ordering process, but it also could be the start of the shipping and delivery process. It crosses the boundary between the two processes, and the message flow line brings this to light.
Association - Association connections show the relationship between text, data, artifacts, and flow objects. Dotted lines often represent these associations.
Artifacts
Artifacts provide supporting information about your business processes. They allow you to describe elements of the process and help to categorize and organize tasks. Here are some of the different elements you might come across in a BPMN artifact:
Data object - A data object outlines how data enters, leaves, and moves through the process (called data input, output, and collection). It also refers to how data is stored in the process (known as data storage). Icons for these elements vary depending on the type of data.
Group - As the name suggests, a group icon categorizes items based on their significance in the process. In the diagram, these are rounded corner rectangles with dashed lines. They help teams better organize and arrange their diagrams.
Text annotation - A text annotation refers to any text that provides extra information about objects in the diagram. It can describe certain parts of the process, provide additional context, or explain the flow of objects in more detail. It makes the diagram easier to follow and understand.
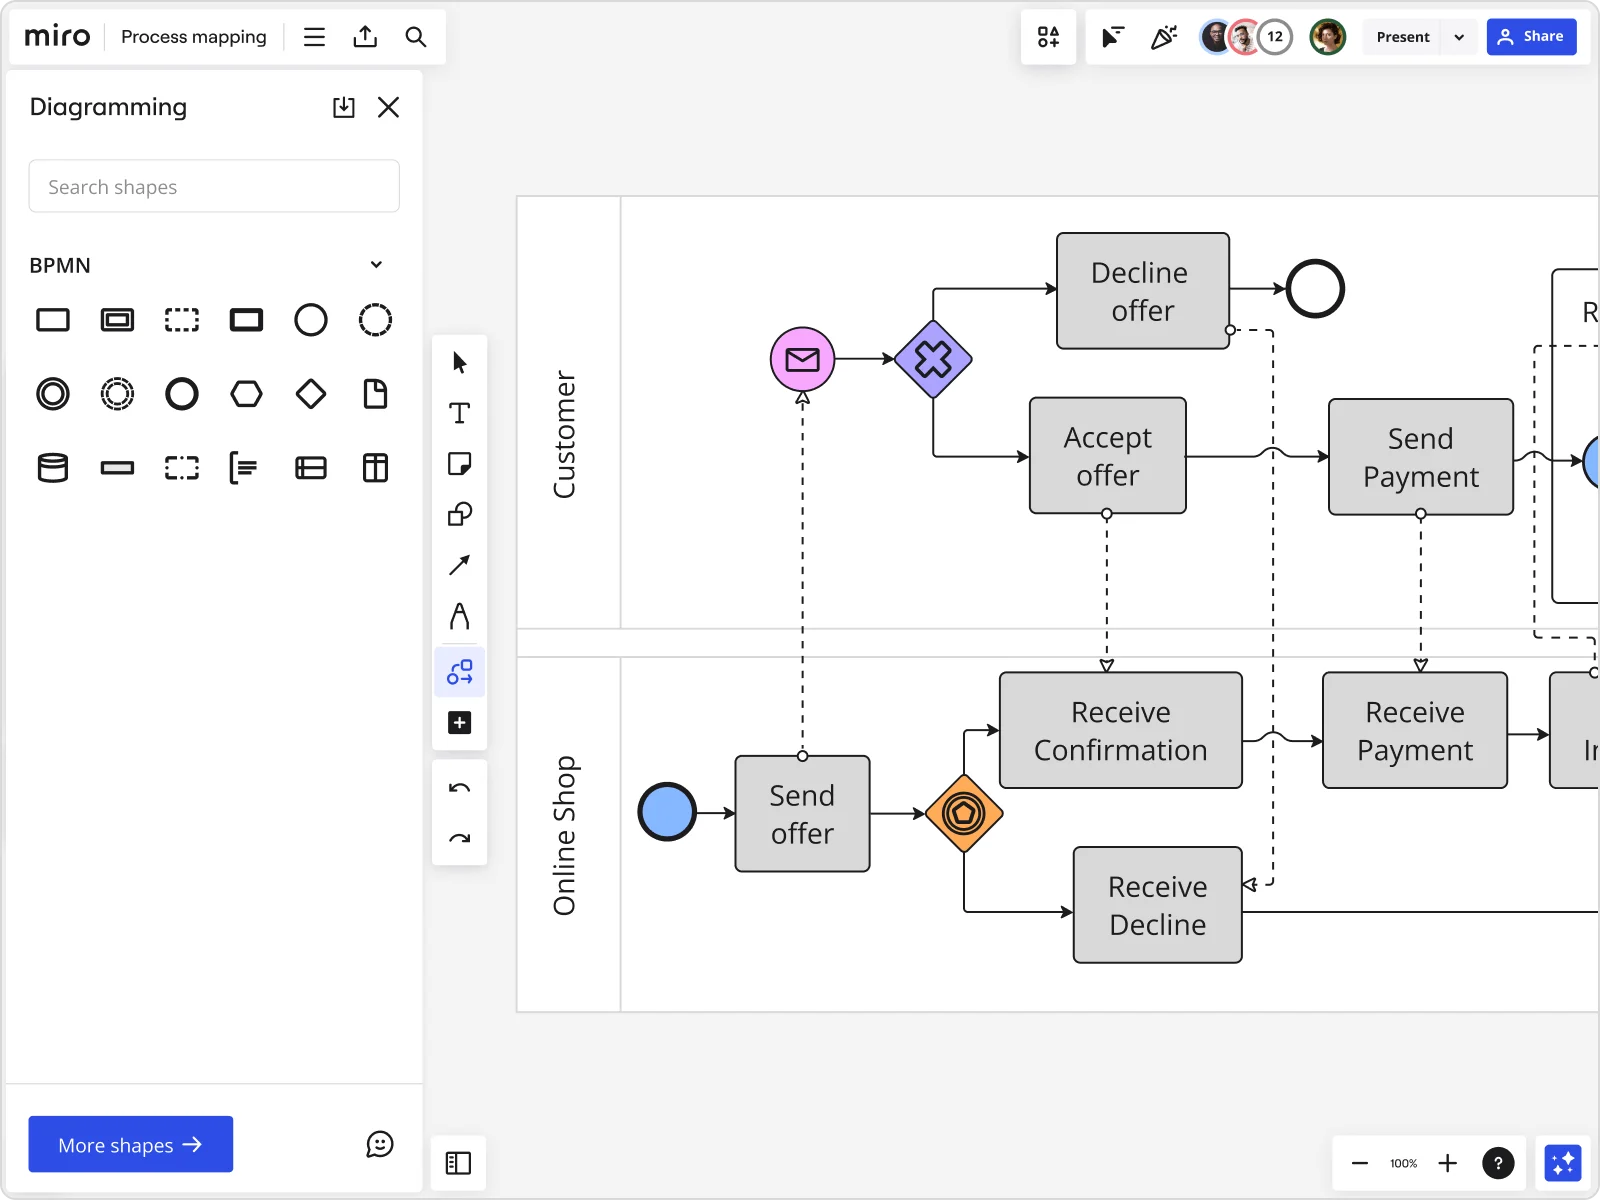
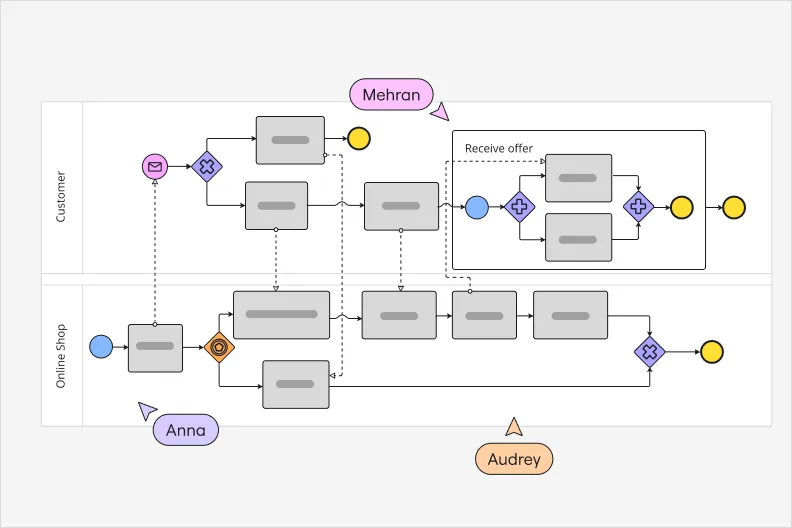
Swimlanes
Swimlanes are a key part of a BPMN diagram’s structure. They’re typically horizontal, rectangular boxes that separate different stages of the process. The swimlane diagram template can be seen as an example of how one is structured. In the template, the diagram is split into four swimlanes: Customer, Sales, Inventory, and Payment. Each item within this row falls under the remit of that particular area of the business. Swimlanes help to further categorize the diagram and show which teams or departments are responsible for certain tasks and objects. For example, all payment-related objects sit within the Payment swimlane. As a result, the payment team can easily see where their tasks sit within the business process.
Why is BPMN useful?
Let’s take a look at some of the main benefits of using a business process modeling notation:
Align your team
Use a BPMN diagram to create a shared understanding of your business’s processes. Get everyone on the same page to make sure your workflow moves as smoothly and efficiently as possible.
Standardize processes
Create clear processes without any room for interpretation using BPMN’s standardized symbols. Everyone in the business can review the BPMN diagram and understand exactly how business procedures work — and boost company-wide productivity as a result.
Identify areas for improvement
Identify hurdles and bottlenecks in your business process with a BPMN diagram. Give yourself and your team a bird’s-eye view across departments to discover opportunities, analyze existing processes, and optimize your existing processes.
Improve cross-functional collaboration
Better manage cross-departmental processes and relationships with a BPMN diagram. Set clear processes and create consistency across departments to remove the guesswork and streamline collaboration.
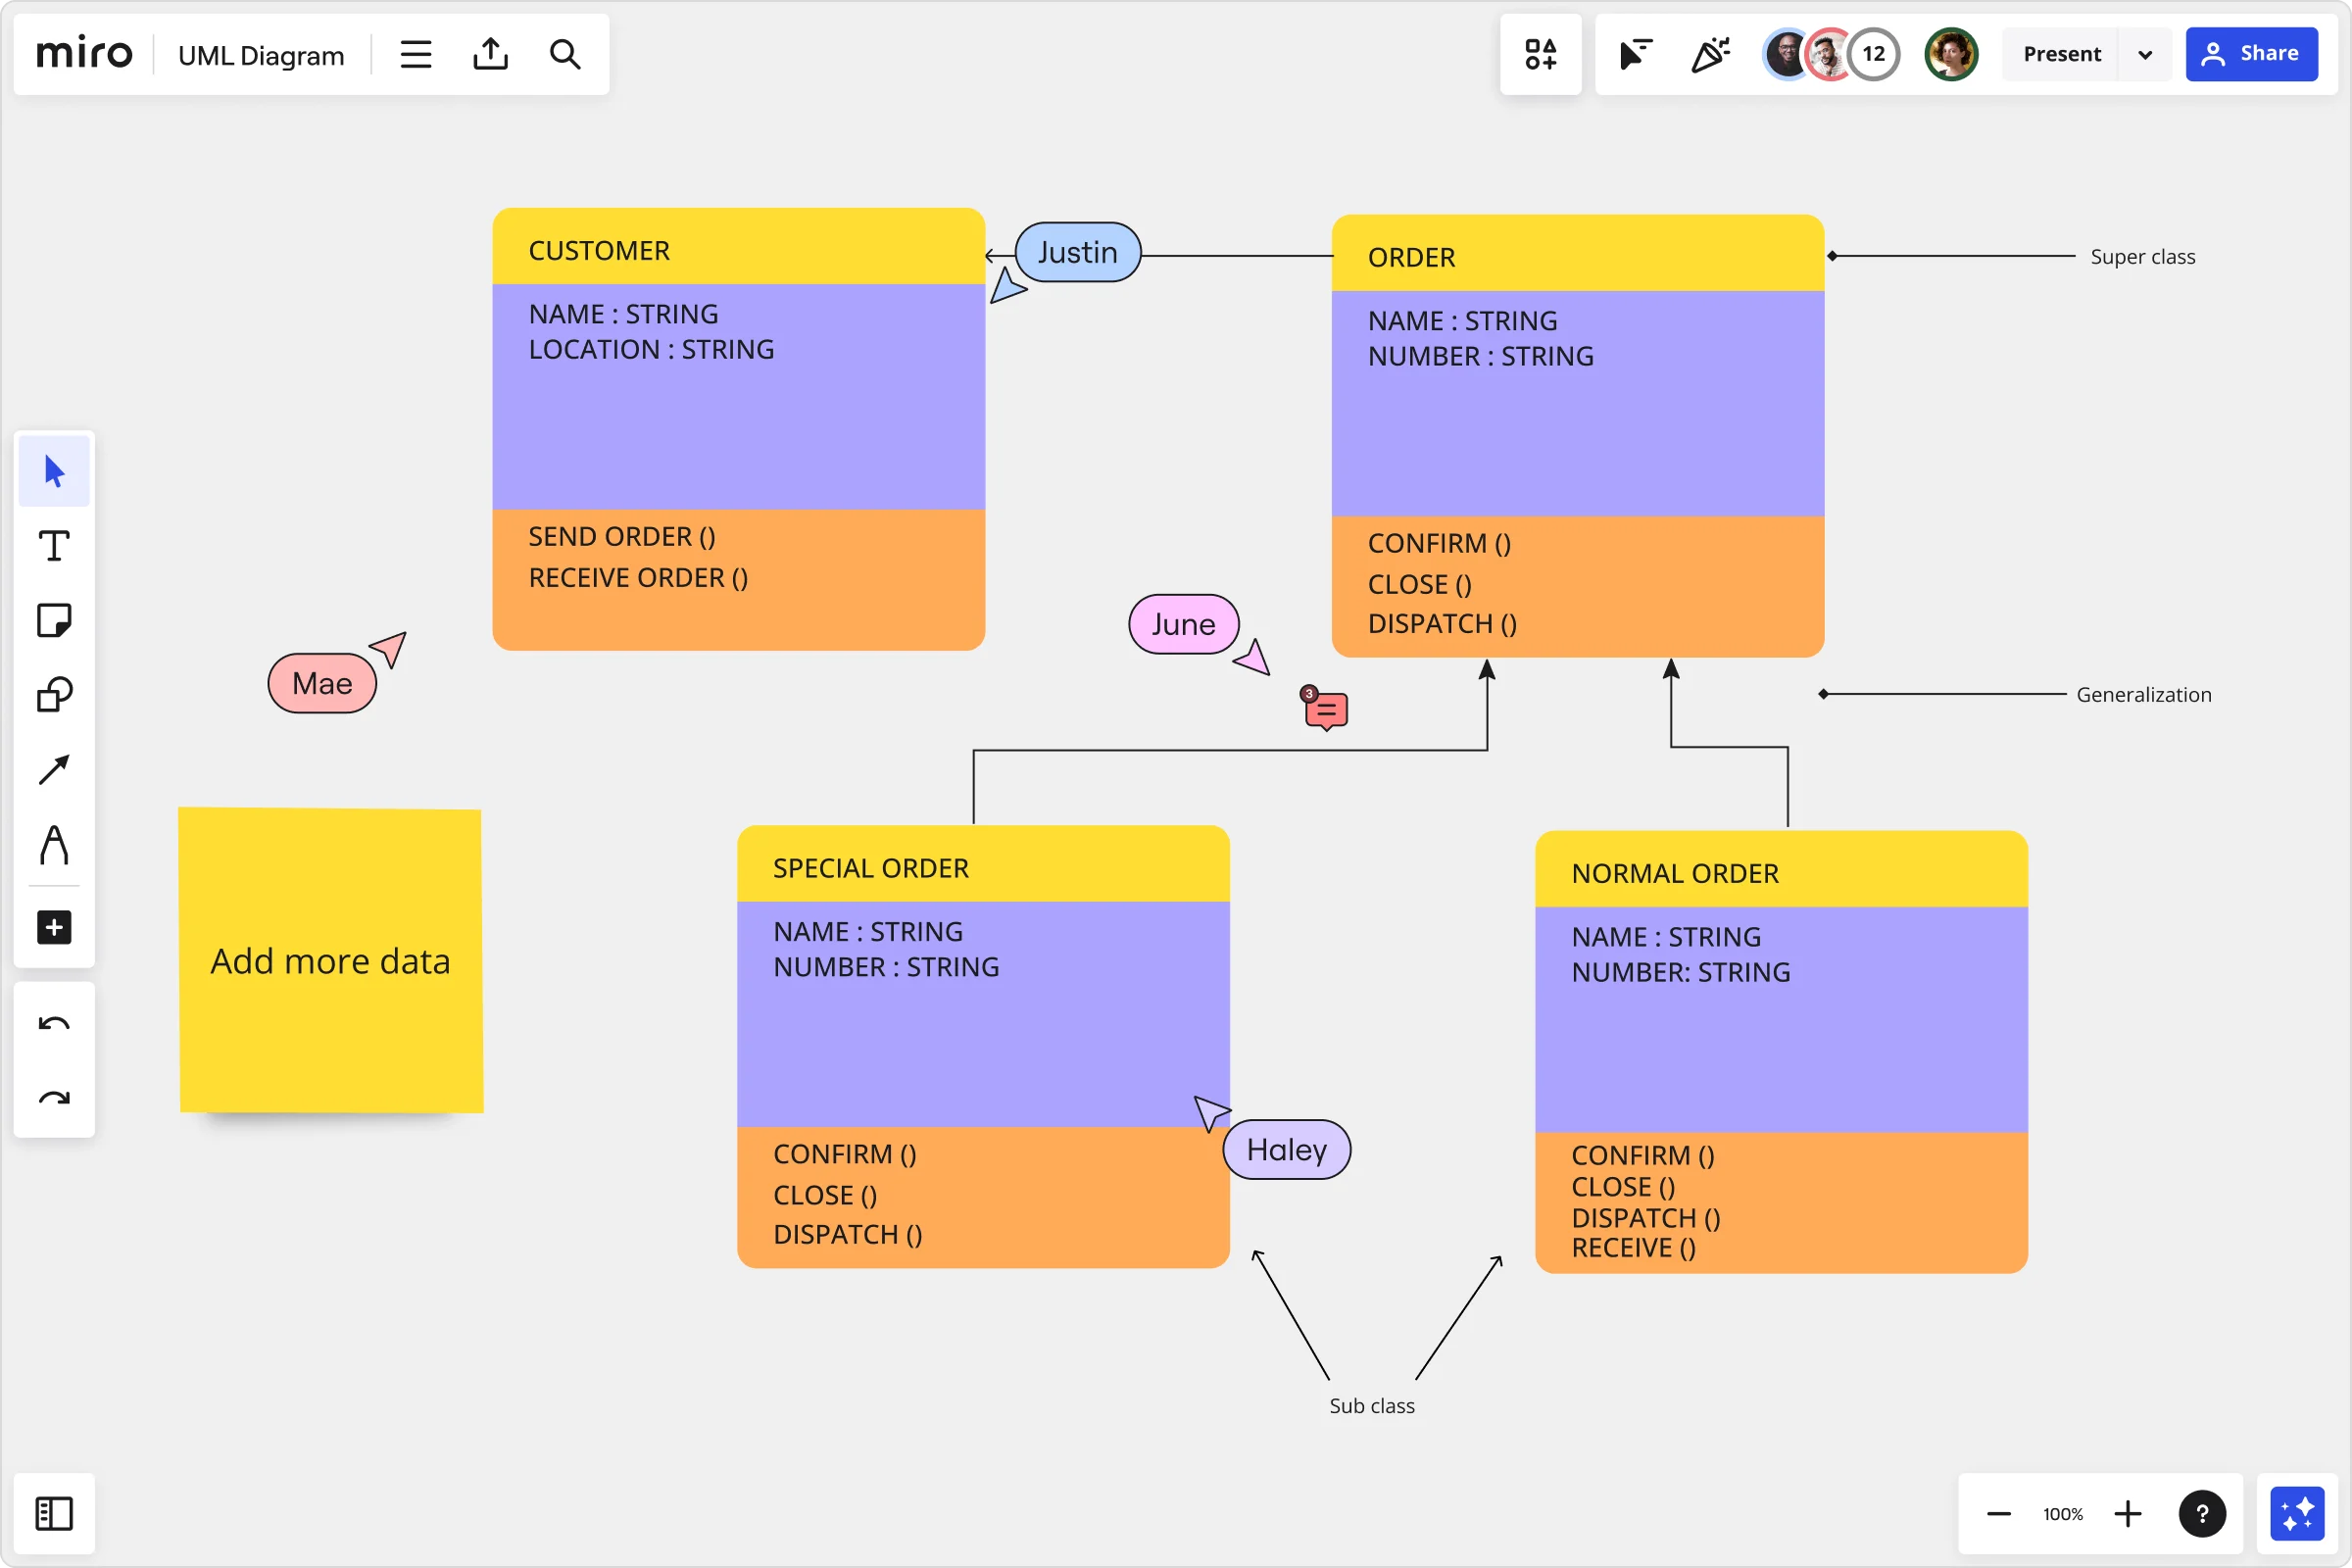
What is the difference between BPMN and UML?
The main difference between BPMN and UML (Unified Modeling Language) is their purpose. A UML diagram is used to model software, while a BPMN diagram outlines business processes. This means that BPMN diagrams are widely applicable to both IT and business, while UML diagrams are more specific to developing IT systems. There are some similarities between BPMN and UML diagrams, however. For example, they both have standardized symbols and notations, and they both use a flowchart style to outline systems and processes. But ultimately, they’re two completely different diagrams.
How do I create a BPMN diagram?
We’ve covered what a BPMN diagram is. Now, let’s take a look at how you can create your own BPMN diagram with Miro.
1. Start with a template
Using BPMN templates is an easy way to get started. The template is fully customizable, so you can move things around, add new elements, and amend the existing structure to best reflect your process.
If you’d prefer to build out your BPMN diagram from scratch, jump into the BPMN tool.
With Miro’s digital workspace, you can also collaborate with your team throughout the creation process — which is particularly helpful for remote or distributed teams. Everyone in your team can access the board from wherever they’re working, allowing you all to create the BPMN diagram together.
2. Define the scope
Before starting your BPMN diagram, you need to define the scope of the process. The scope outlines what the process is for and what it should do from a top-level perspective. Is it a recruitment process? A shipping and delivery process? A customer outreach process? Whatever it is, the scope should clearly define it. Here’s what to cover in the scope of your BPMN diagram: • The beginning of the process • The end of the process • What the process includes • What the process doesn’t include (also known as process boundaries) • The output or final deliverable With a clearly defined scope, you’ll be able to create a clear and concise BPMN diagram.
3. Add your activities
With your scope in place, you can now start to plot the sequence of business activities. The first step is to determine your start event. Your scope will have covered this at a top level, but you can now flesh out the details and pinpoint the exact activity that will start your diagram. You can also add the final event to confirm when the process will end. Then, you can clearly define your activities. From your start event, move through the process and add the key actions, tasks, and activities. To make sure you use the right symbols and icons, take a look at the four categories of a BPMN diagram that we covered earlier in the article. Here are some best practices for adding and structuring activities to your BPMN diagram:. Ideally, your entire diagram should fit on one page. This makes it easier for everyone to review the diagram and visualize the process at a glance. Adding activities to the diagram might bring inefficiencies to light. If that’s the case, add a comment or sticky note outlining the issues so that you can review and resolve them. The sequence flow should move horizontally, while associations and data flows should move vertically. This is where swimlanes come into play — more on this in the next section.
4. Outline your swimlanes
Every BPMN diagram must have at least one pool with a swimlane. Exactly how you structure that swimlane is up to you. Ultimately, it depends on the process you’re mapping and who’s involved. Here are some of the main categories you can use to structure your swimlanes: By department: When creating a company-wide process, you can use swimlanes to show which departments are responsible for certain tasks and activities. For example, all payment-related tasks can sit in the swimlane for the accounting team. By employee: If the process relates to a specific team or department, you can break down your swimlanes by employees. Every employee involved in the process will have a clear overview of what they’re responsible for and how their role fits into the process. By activity type: If you don’t want to categorize tasks by employee or department, you can simply use swimlanes to group similar activities together. For instance, any sales tasks will fall under the “sales” swimlane.
5. Use connectors
Finally, you can use connector lines and arrows to show how activities relate to each other. The direction of flow should always move from left to right. Even when hopping between swimlanes (which means using arrows and connections vertically), the flow of the diagram should be consistent. This makes it easier to understand how the process works and which activities relate to one another. Connectors should also never cross overtop of each other. If they do, you need to rearrange the structure of your activities. However, if you’re following the simple left-to-right format, you shouldn’t come across this problem.
6. Share the diagram
When everything is mapped out, share the diagram with your teammates and business stakeholders to get their thoughts and feedback. Have your team review the diagram and add comments or suggestions. That way, it’s easier for you to review their feedback and make any necessary changes. Over time, your processes will change. New tasks will be added, different technology will be used, and new employees will join the team — it’s inevitable. When this happens, be sure to return to the diagram and update it accordingly.
Author: Miro Team
Last update: October 10, 2025