There’s nothing more important for a business than a competitive advantage. It determines whether you’ll sink or swim in a crowded field.
But business isn’t a sports league. Competitive advantage doesn’t come from defeating your opponents directly but from providing value to your customers better than anyone else.
Where does value come from? From your internal processes. Every step taken by someone in your company should point toward your value proposition.
That sequence of steps that creates what customers buy is your value chain — and with a value chain diagram, you can see it all.
In this article, we’ll explain what a value chain diagram is, how to build one, and how to use it to get ahead of the competition.
What is a value chain diagram?
A value chain diagram, or value chain analysis, shows the steps your company follows in order to provide a product or service that customers value.
Designed by Michael Porter, the value chain assumes that you have the goal of providing as much value for customers as you possibly can. Ideally, every function in your company contributes some value to the end product. The total value created minus that which is reinvested in the value chain is the profit.
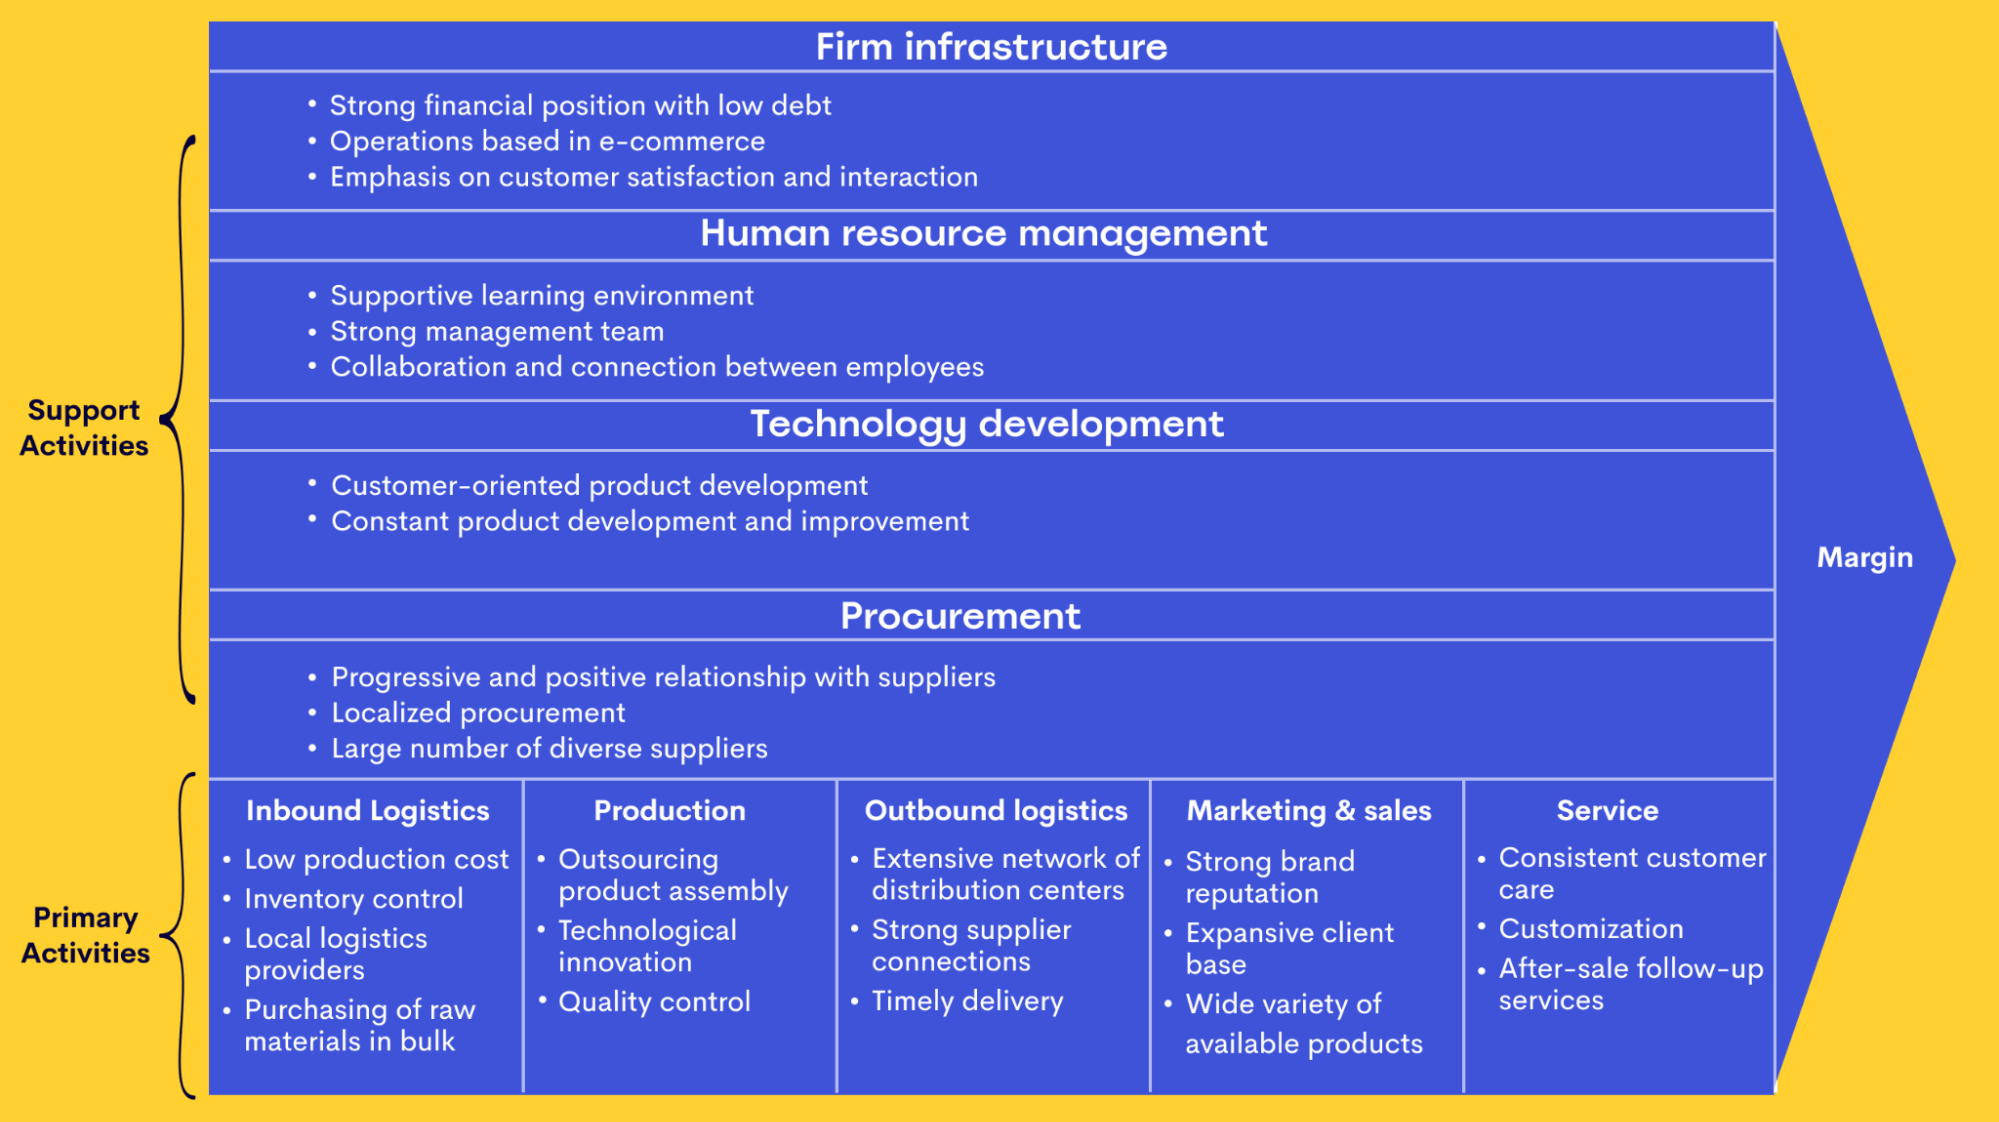
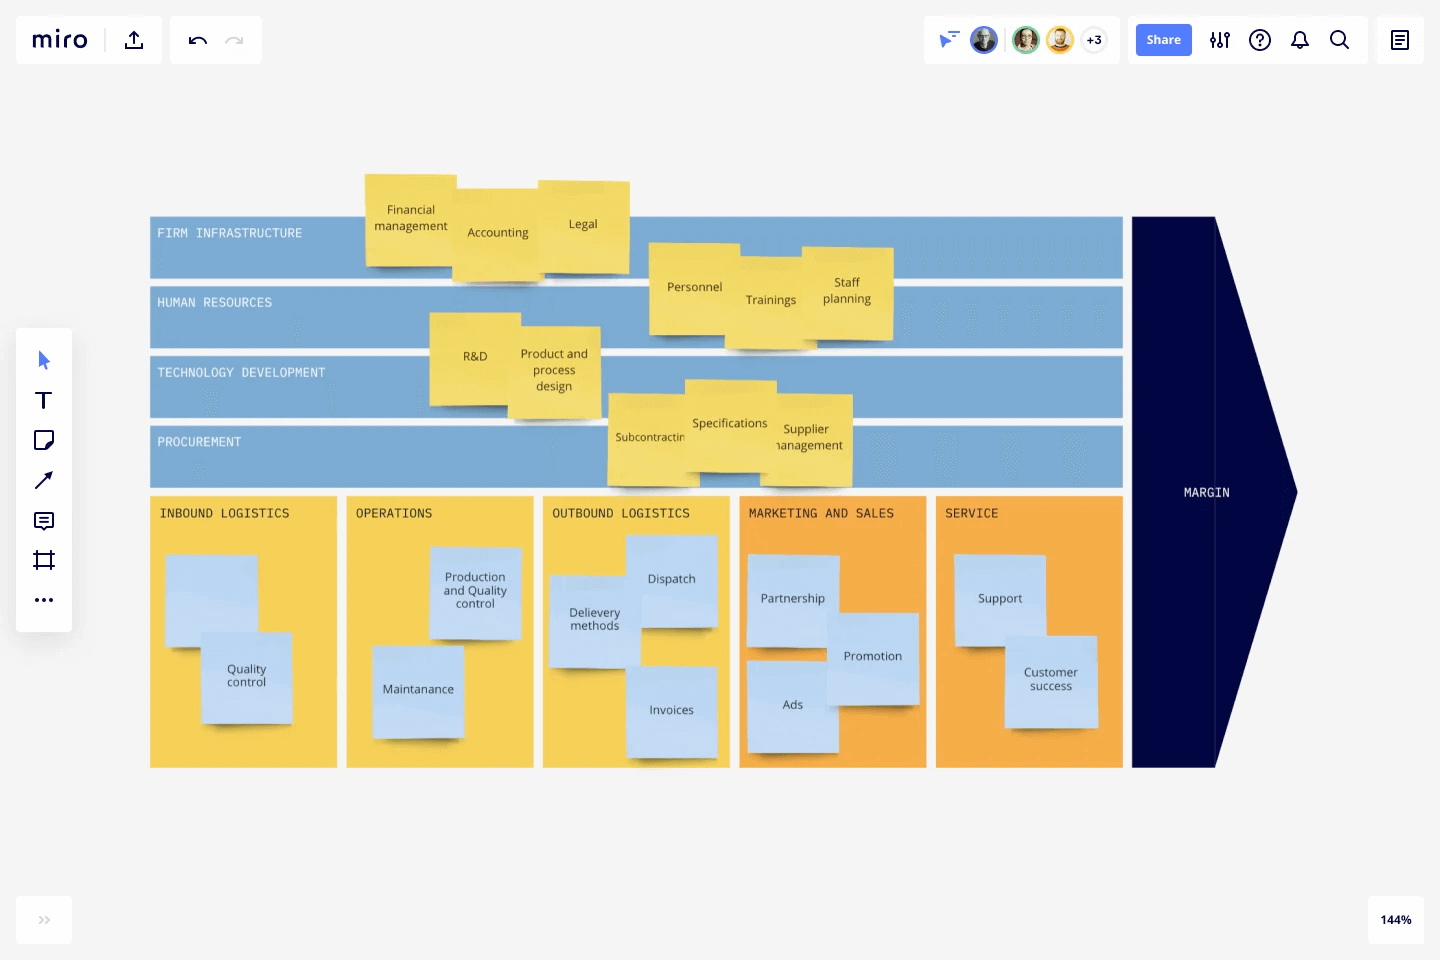
Porter used those fundamental concepts to build a diagram that looks like this:
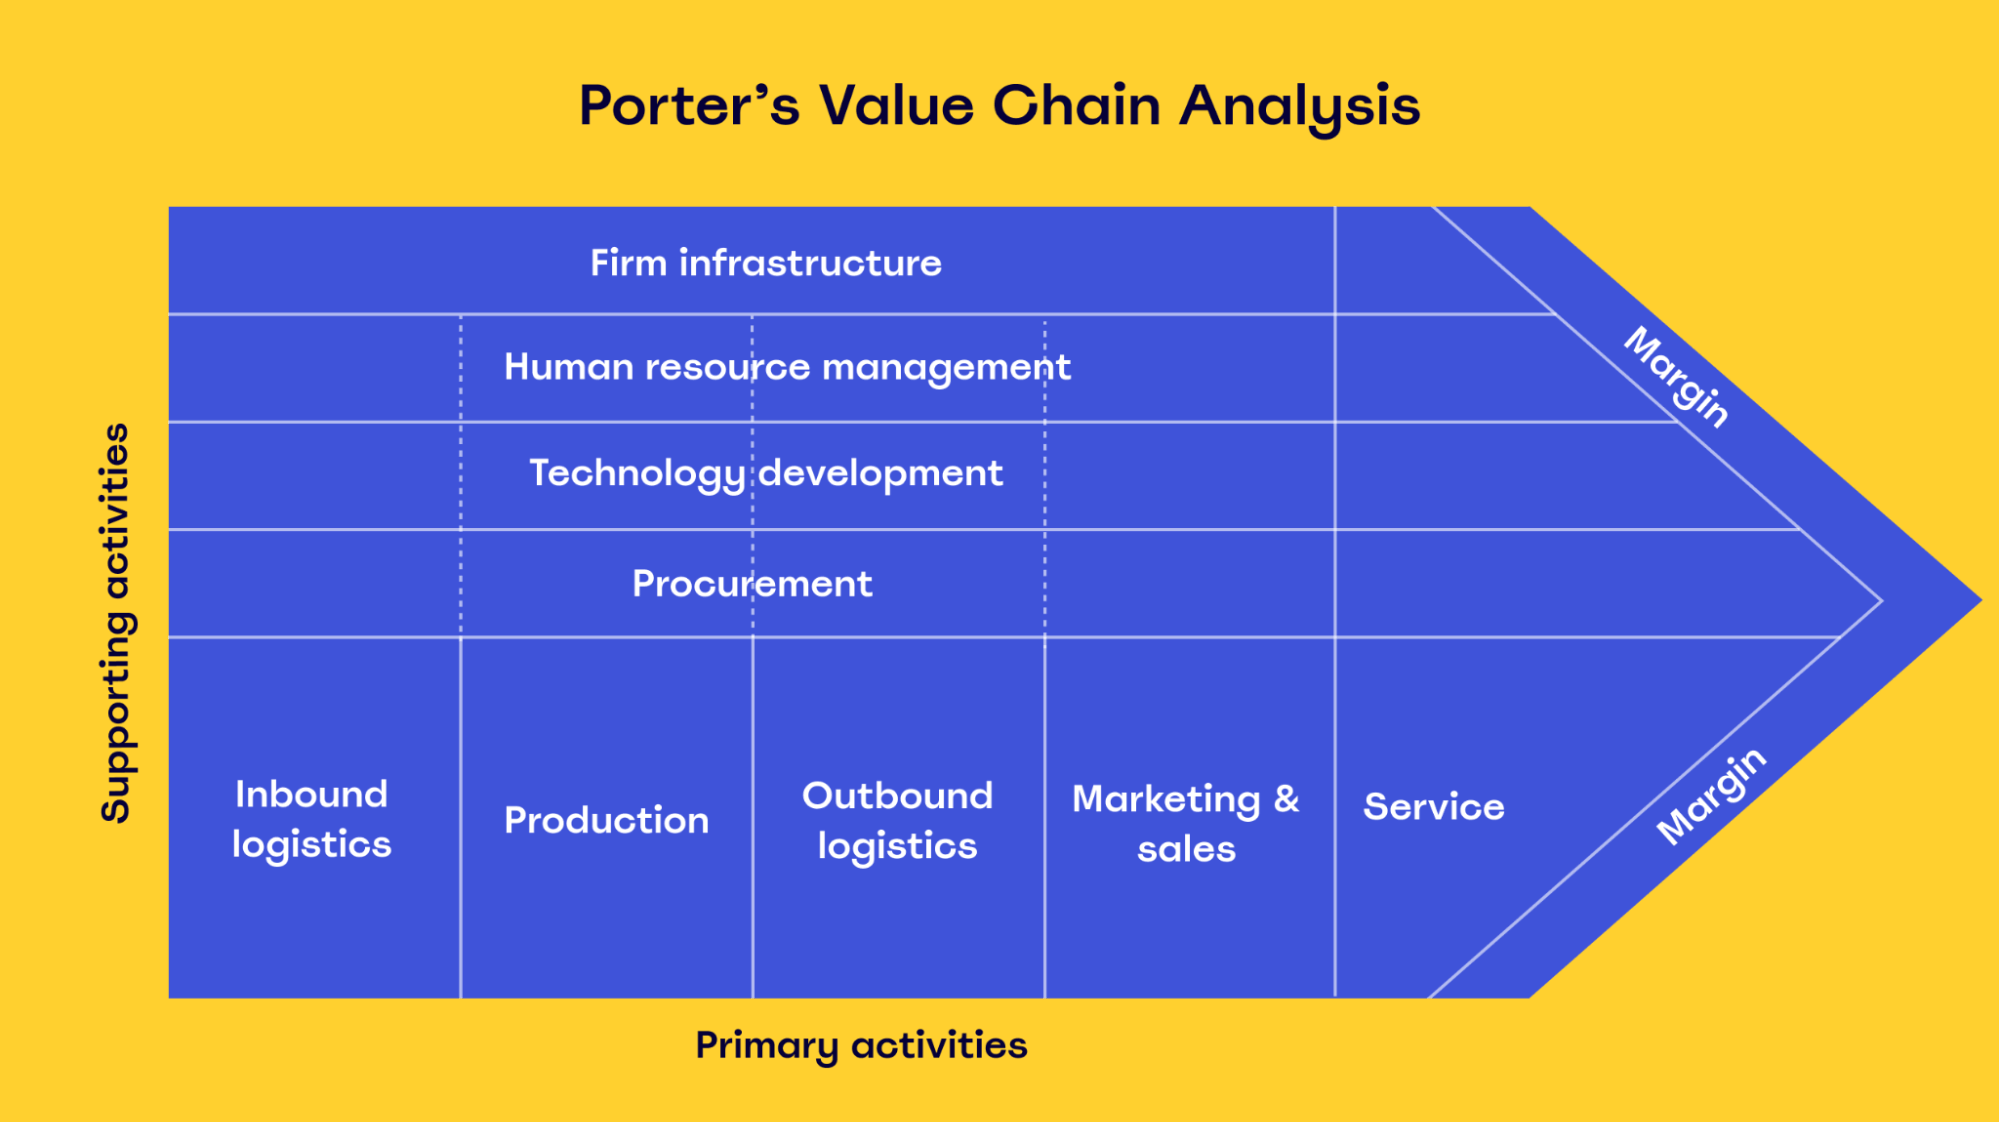
The value chain is composed of three fundamental elements. Primary chain activities, represented by vertical segments on the bottom row, contribute directly to value creation. Each support activity bolsters and guides the primary activities. The profit margin provides a measure of overall operational efficiency.
According to Porter, primary chain activities include:
- Inbound logistics: Acquiring raw materials and directing them to production centers.
- Production: Processing raw material into a final product that has a greater value than the material does on its own.
- Outbound logistics: Distributing the processed product to wholesalers, retail locations, and eventually end customers.
- Marketing and sales: Raising awareness of the product or service, cultivating new customers, and ensuring a continuous source of revenue.
- Service: Providing assistance to the customer outside the purchase itself, from in-store help to regular maintenance.
Porter’s support activities, which cross and back up all primary activities, include:
- Firm infrastructure: A company’s “corporate” functions, including executive management, accounting, and legal counsel.
- Human resource management: Hiring new employees, distributing compensation and benefits, and handling employee needs.
- Technology development: Gaining a competitive advantage by creating more efficient internal processes and new customer-facing technologies.
- Procurement: The company-wide structures that provide everyone with the tools and materials they need to work. All primary and support activities need supplies, but they won’t all need the same ones (for example, the corporate office can’t do much with raw product materials).
Note that both these primary activities and secondary activities can change when the industry provides a service instead of a physical product.
In service industries, the “raw materials” are the employees’ skills and the customers’ needs, so processing and logistics look different. However, value chain analysis can still be applied.
One more important point is that a value chain should not be confused with a supply chain. Supply chain analysis focuses on the movement of physical materials and human resources — it’s more concerned with logistics and efficiency than it is with value.
What is a value chain diagram used for?
A value chain diagram is an opportunity for analysis. When you create one, you’re looking for opportunities to increase value and gain a competitive advantage.
The act of creating the diagram forces you to think about how each element of the process works with all the others. Once you can see each activity and how it relates to every other one, you can survey the entire process to look for waste.
Efficiency is one of the primary goals of value chain analysis. You want to beat your competitors by delivering the product or service with minimum waste.
But you’re also looking for your unique competitive advantages — the things you can do that nobody else can.
How to create a value chain diagram
If you’re sold on the benefits of value chain analysis and want to create a value chain diagram of your own, we recommend starting with Miro’s value chain diagram template.
Let’s walk through the steps of how to create a value chain diagram.
1. Identify all the activities in your value chain
Get your team together and come up with a list of everything your company does that adds value to the final product. Be as complete as possible: even collecting garbage at your facilities is part of the value chain!
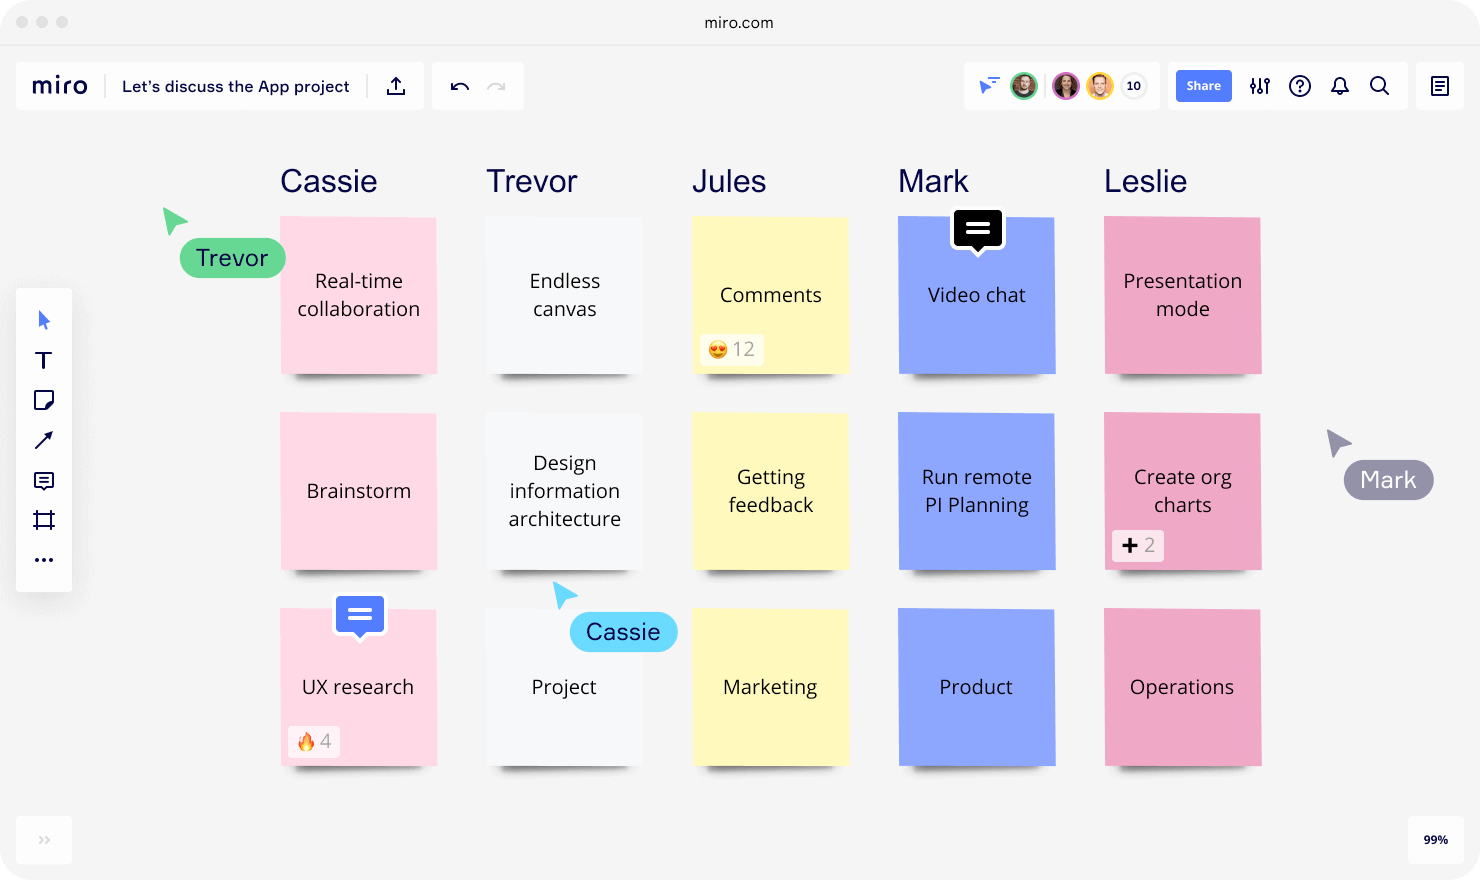
Our online brainstorming tools can help with this step. Use sticky notes, mind maps, and more to help determine your process for adding value.
2. Separate your primary and secondary activities
Working off your results from step one, classify all your value-adding steps into each category as a primary activity or support activity. Don’t be afraid to edit Porter’s activity lists if any of your unique value-adds don’t quite fit.
As you classify your value chain activities, add them to the appropriate spot on a value chain diagram. This is a great spot to start using our Value Chain Analysis Template (more on that below).
3. Label each activity to show how it creates value
Once you have all your activities on the diagram, label each with a brief description of what it adds to the value chain. For example, activities could create value through unique processes, promoting efficiency, or quality assurance.
Be as detailed as you can. If you need more room, you can use Miro’s diagramming tools to link notes with definitions in another window.
4. Add the cost of each activity
Determine how much each activity costs the company. Consider every kind of resource you might have to pay for: labor, materials, tools, land, permits, subscriptions, and anything else that costs money.
Cost calculation is the heart of value chain analysis. When you have the costs of each activity written down, you’ll subtract them from your profits to get your margins, which you can then work to increase. As you add each cost, look for areas that cost more than they should.
When you’re finished, it should look a bit like this:
5. Use the diagram to look for waste
Alongside your team, go over the diagram again, looking for any areas where costs run high. Whenever you find one, discuss ways you could make those activities work more efficiently.
Be aware of tradeoffs. Some steps, especially those that are very unique, might add so much value to the final product that you’d actually lose profit by streamlining them too far.
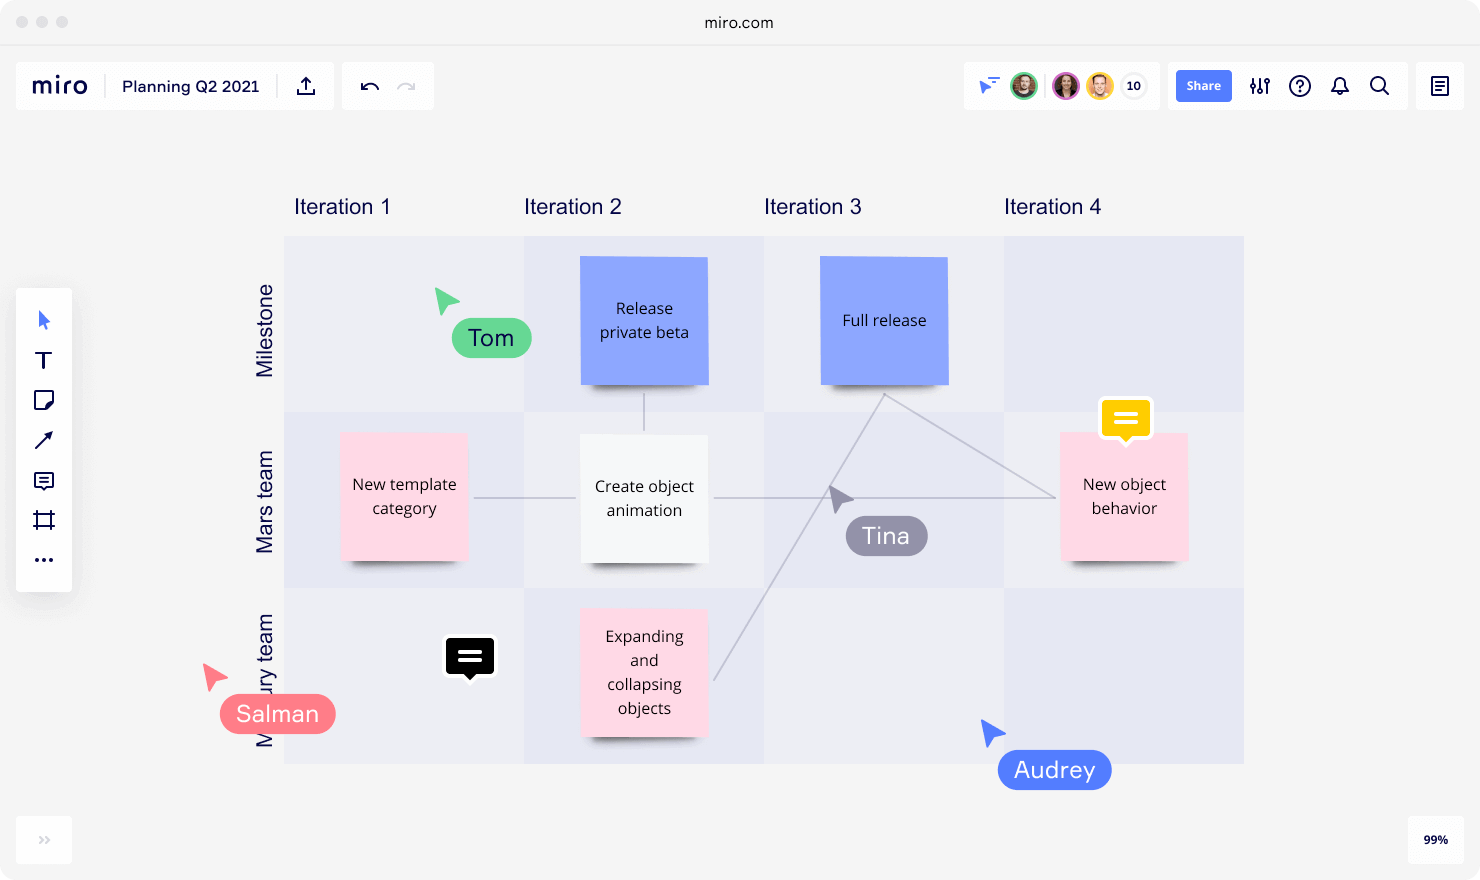
Now that you’re into the strategy phase, you can take advantage of our strategic planning features to work with your team on plans to improve efficiency.
6. Act on the information you discovered
If you went into enough detail on your value chain analysis, you should have identified several opportunities to improve efficiency, reduce waste, add more value, and bolster your competitive advantage. Now it’s time to roll up your sleeves and get to work.
Hold a strategic planning meeting for all stakeholders, and decide how to apply your value chain analysis to different areas of the company. As you go, you can use Miro’s integrations to slot the new information seamlessly into existing workflows.
4 value chain diagram use cases
We’ve been talking generally up until now, but value chain analysis is different for every company. Here are four specific cases where a value chain diagram might come in handy.
1. Visualize complex processes
Most companies start small. In the beginning, your value chain is so simple you don’t even need a diagram. You buy ingredients, bake the cookies, and sell them to customers.
But as you grow (hopefully you’re growing!), complexity builds up exponentially. If you start offering more kinds of cookies, you have to source ingredients for each. People are ordering from farther away, so you hire a delivery driver and someone else to manage your website.
By the time you’re sitting in a corner office as the CEO of CookieCorp, it can be hard to see where exactly the value is coming from.
For companies with complex processes, especially multinationals, a value chain analysis can be a way of grounding your thinking: getting back to what you actually do and why you do it.
2. See where resources are being lost
Even if you’re not in an active waste crisis, a value chain diagram can help you tighten up your operations by showing where things could be done better.
When assigning costs to each step in the value chain, you might notice that procurement costs more every year than HR and technical development combined. Drilling down on that activity, you might discover that you’ve been using expensive vendors for years just because you never considered switching away from your original contracts.
“Cost” doesn’t have to mean money. Significant losses can also occur when labor isn’t used efficiently, such as when people are required to spend time on tasks that don’t match their skill sets.
3. Look for cost advantages
Ultimately, value chain analysis is about one thing: getting an edge over your competitors. There are two main kinds of competitive advantage.
The first is cost advantage. If you can deliver the same value your competitors do but use a more efficient process, you can offer the product at a lower price, claiming market share for yourself.
Any competitive market analysis shows that the lowest-cost provider is the winner in most markets — that’s how Walmart and Amazon got so big. Be careful, though, since you can lose market share if your increased efficiency results in a lower-value product than your customers could get elsewhere.
4. Seek out differentiation advantages
The other main type of competitive advantage is differentiation advantage. Instead of being the lowest-cost provider, you provide value that’s completely unique.
A prominent example can be found in the computer hardware industry. Dell, HP, and Asus might compete to provide low-cost computers, but Apple takes a different route: it’s the only company that can sell its unique Apple products.
Similarly, in the entertainment industry, Netflix can provide more unique content than Warner Brothers because its value chain makes it far more able to absorb the cost of a failure.
How to fill in a value chain diagram template
We offer a wide range of tools your team members can use to collaborate remotely. The value chain analysis template is just one, but it’s extremely versatile. You can use it to create a working value chain diagram in minutes and start drawing insights from it right away.
Using it is simple. Just log into your Miro dashboard, add the template, and replace the existing text with notes relevant to your company. Follow the steps outlined above, adding sticky notes wherever you need extra detail. That’s it!
Build your first value chain diagram today
Every business should conduct a value chain analysis at least once. If you don’t, you’ll never know whether or not you’re missing out on competitive advantages.
Use Miro to collaborate on a value chain diagram that will pay big dividends for your team and company. Check out all our templates today to see what our collaborative whiteboards can do for you!