Process and workflow visualization is a critical tool for software engineering, product, and design teams. It’s how they organize and structure their application design and code, troubleshoot problem areas in their systems, and share knowledge about the project and product with their teams.
Flowcharts are a useful tool in this process, allowing programmers to:
- Easily visualize all key stages, dependencies, and decision points in their programming sequence
- Plan the logic behind new programs
- Map existing programs to help them better understand and work with a less familiar code structure
- Align developers, designerts, and project managers to enable greater visibility and collaboration between departments
This guide will walk you through the key steps for how to make a flowchart for programming, and the various applications for this type of visualization. You can also check out Miro’s flowchart templates and see how easy it is to create your own. Let’s get started with the basics.
What is a flowchart?
A flowchart is a diagram that depicts a process, system, or algorithm visually. These diagrams can be used to document, study, plan, improve, and communicate the sequences so that they’re easy to understand by both the diagram creator and other stakeholders.
That’s the purpose of any flowchart — to visualize a sequence. But before you create your flowchart, you should first think about what you want it to accomplish.
Here are three examples of what flowcharts can do.
1. Design and visualize an algorithm
You’re tasked with designing a load balancer algorithm for a web service that distributes incoming client requests to a pool of backend servers. The goal of this algorithm is to evenly distribute traffic to ensure that no single server is overwhelmed, while also maintaining service for end users.
A flowchart can be used in this scenario to break down the complex decision-making process for this algorithm into manageable steps, making it easier to determine what code logic needs to be built and deployed.
This flowchart can also serve as a communication tool, allowing the algorithm design to be easily understood by other stakeholders in the company, including engineers, UX designers, and other non-technical team members.
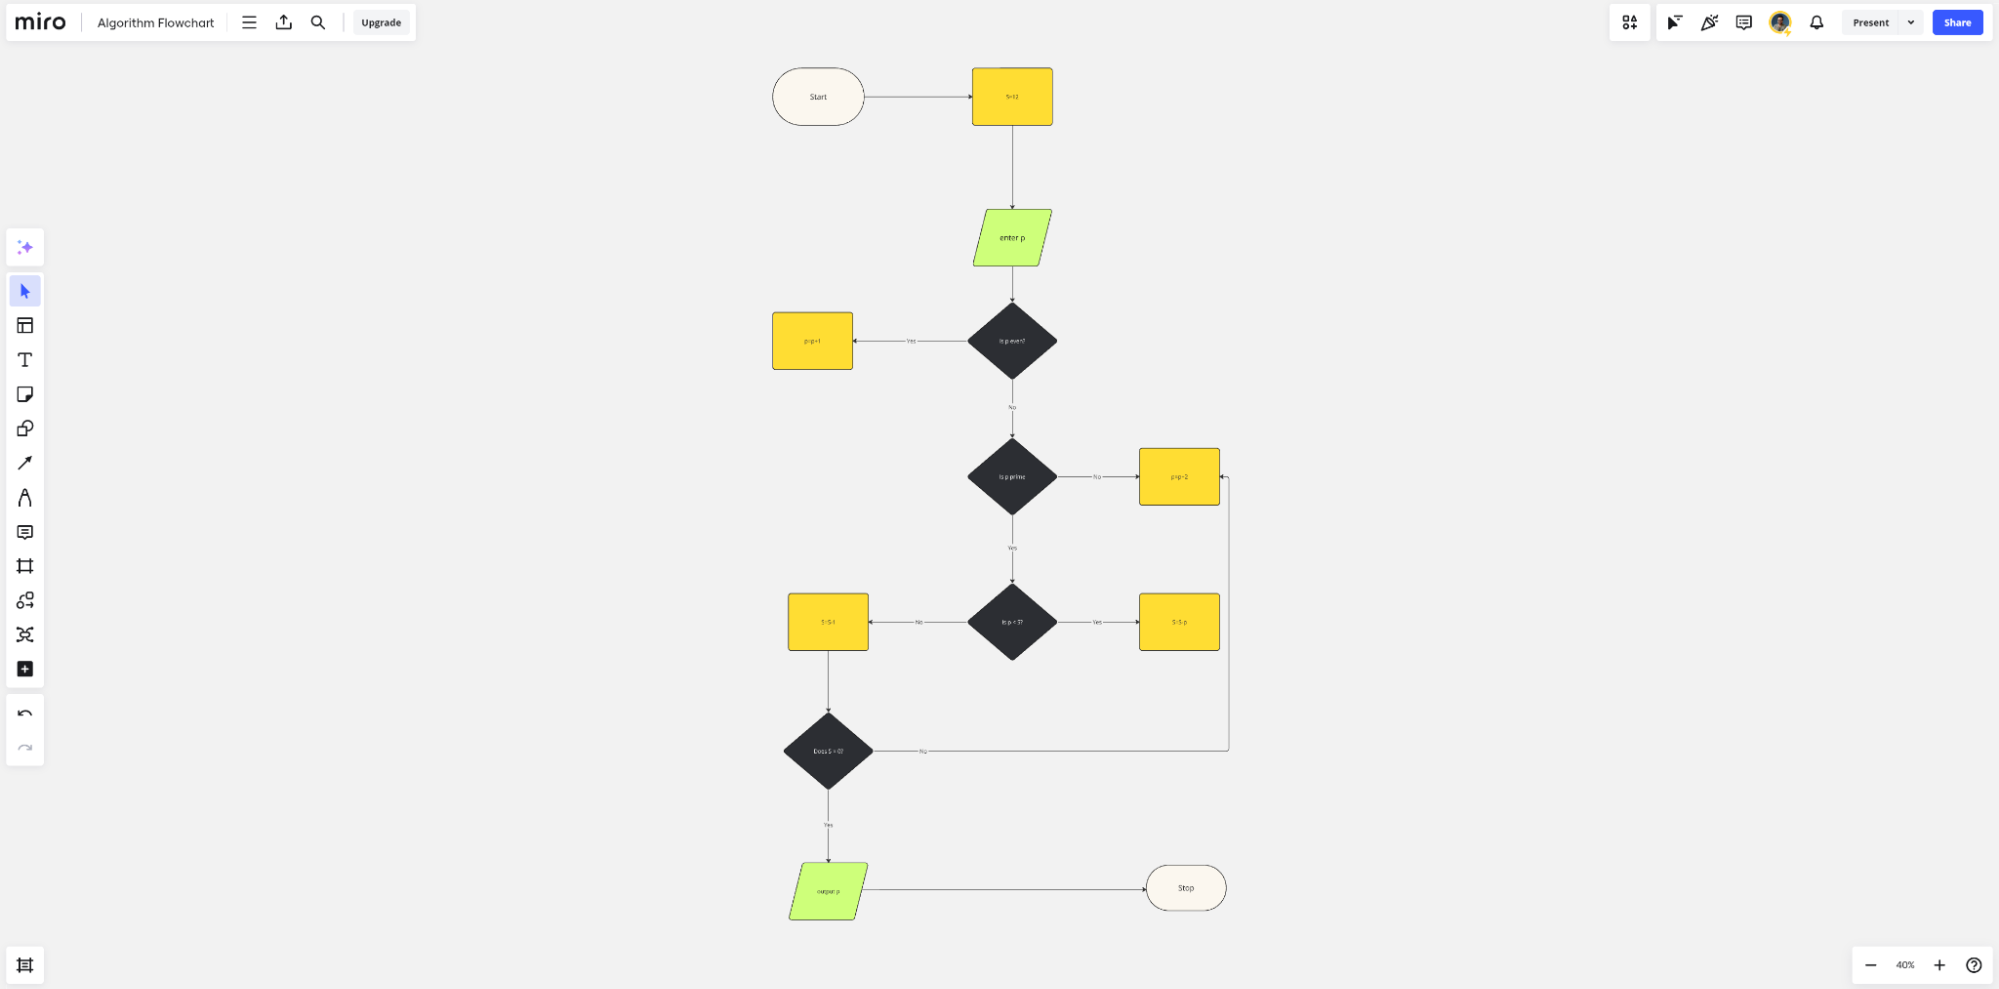
Here’s a visual example of an algorithm flowchart. You can explore all algorithm flowchart templates in Miro’s library to find the perfect starting point for your project.
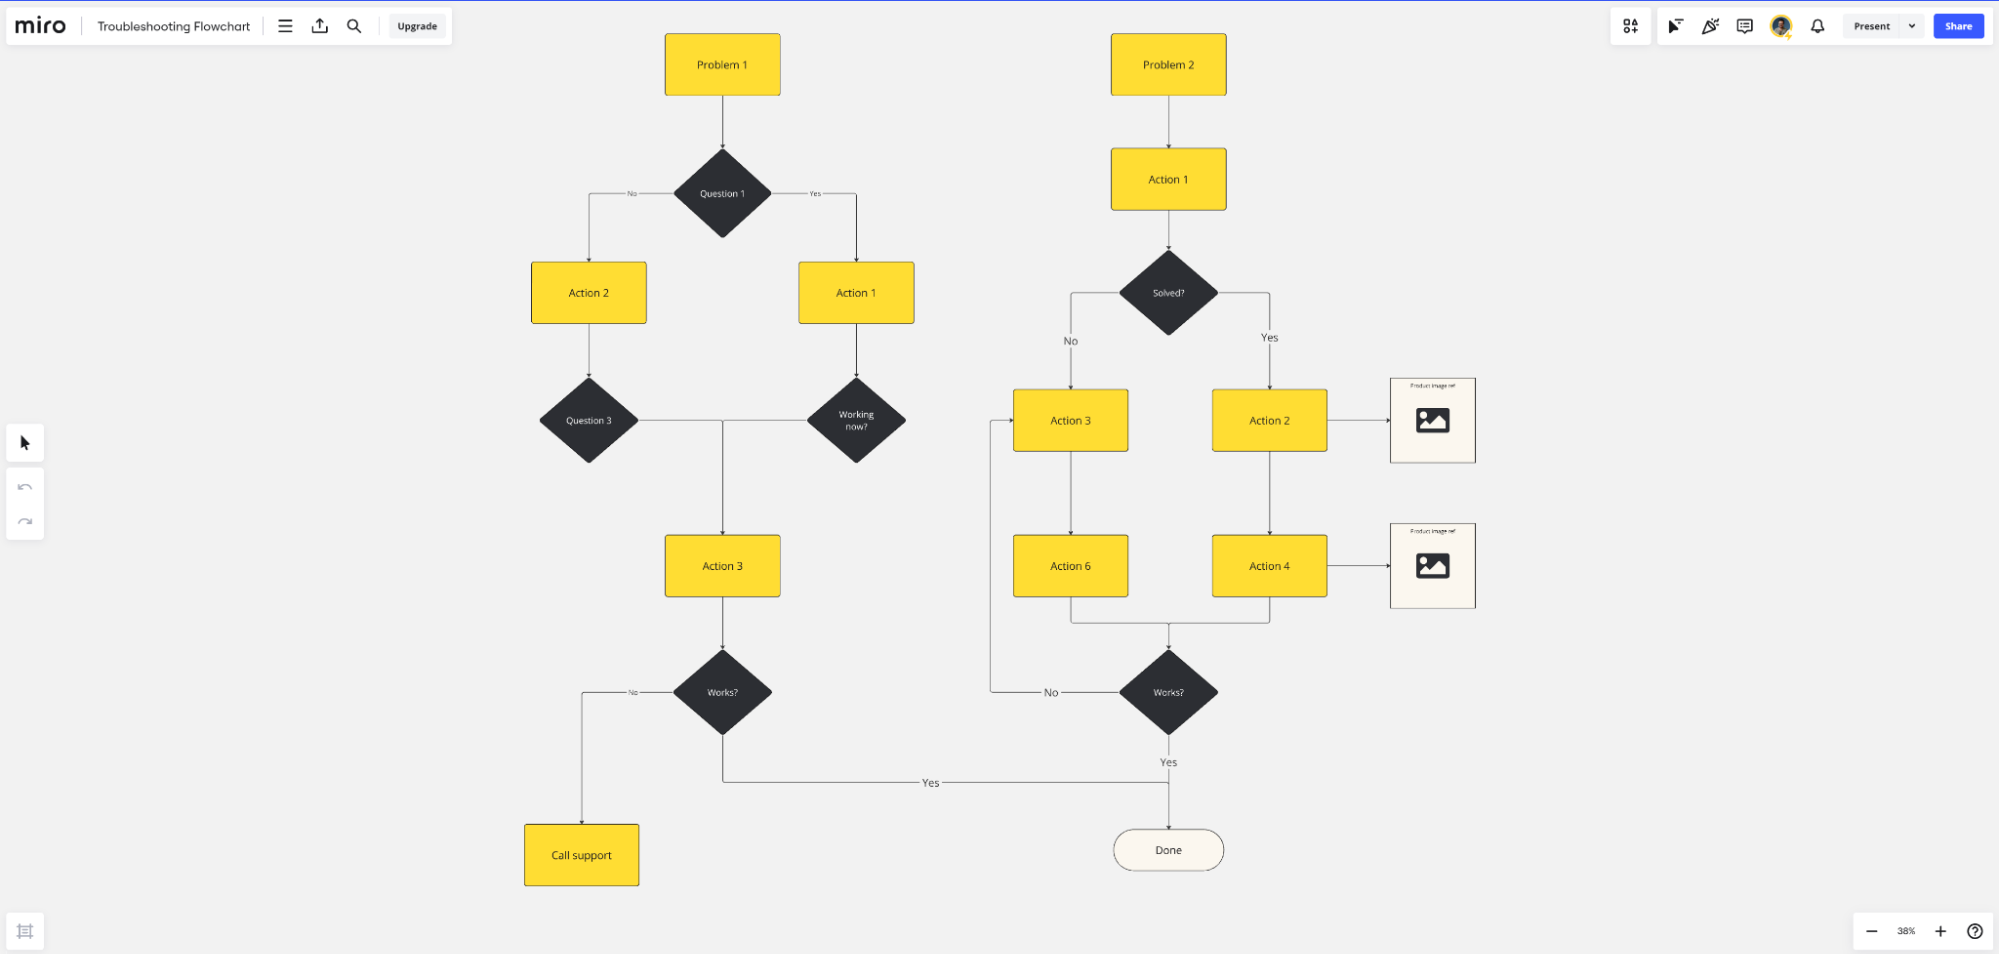
2. Debug and troubleshoot a program
Say your program crashes on input validation during QA. You’re not sure what caused this crash, so you use a flowchart to visualize the decision-making process and data flow. This ultimately helps you pinpoint the error by allowing you to isolate where in a sequence specific errors might be occurring, and why, within the context of the end-to-end user flow.
Flowcharts can also be used to visually display the steps required to diagnose and solve problems. This standardizes the troubleshooting process and ensures that all QA team members are following a structured approach to quality control. It also makes onboarding new team members more efficient, as a visualization of your processes can help them get up to speed faster.
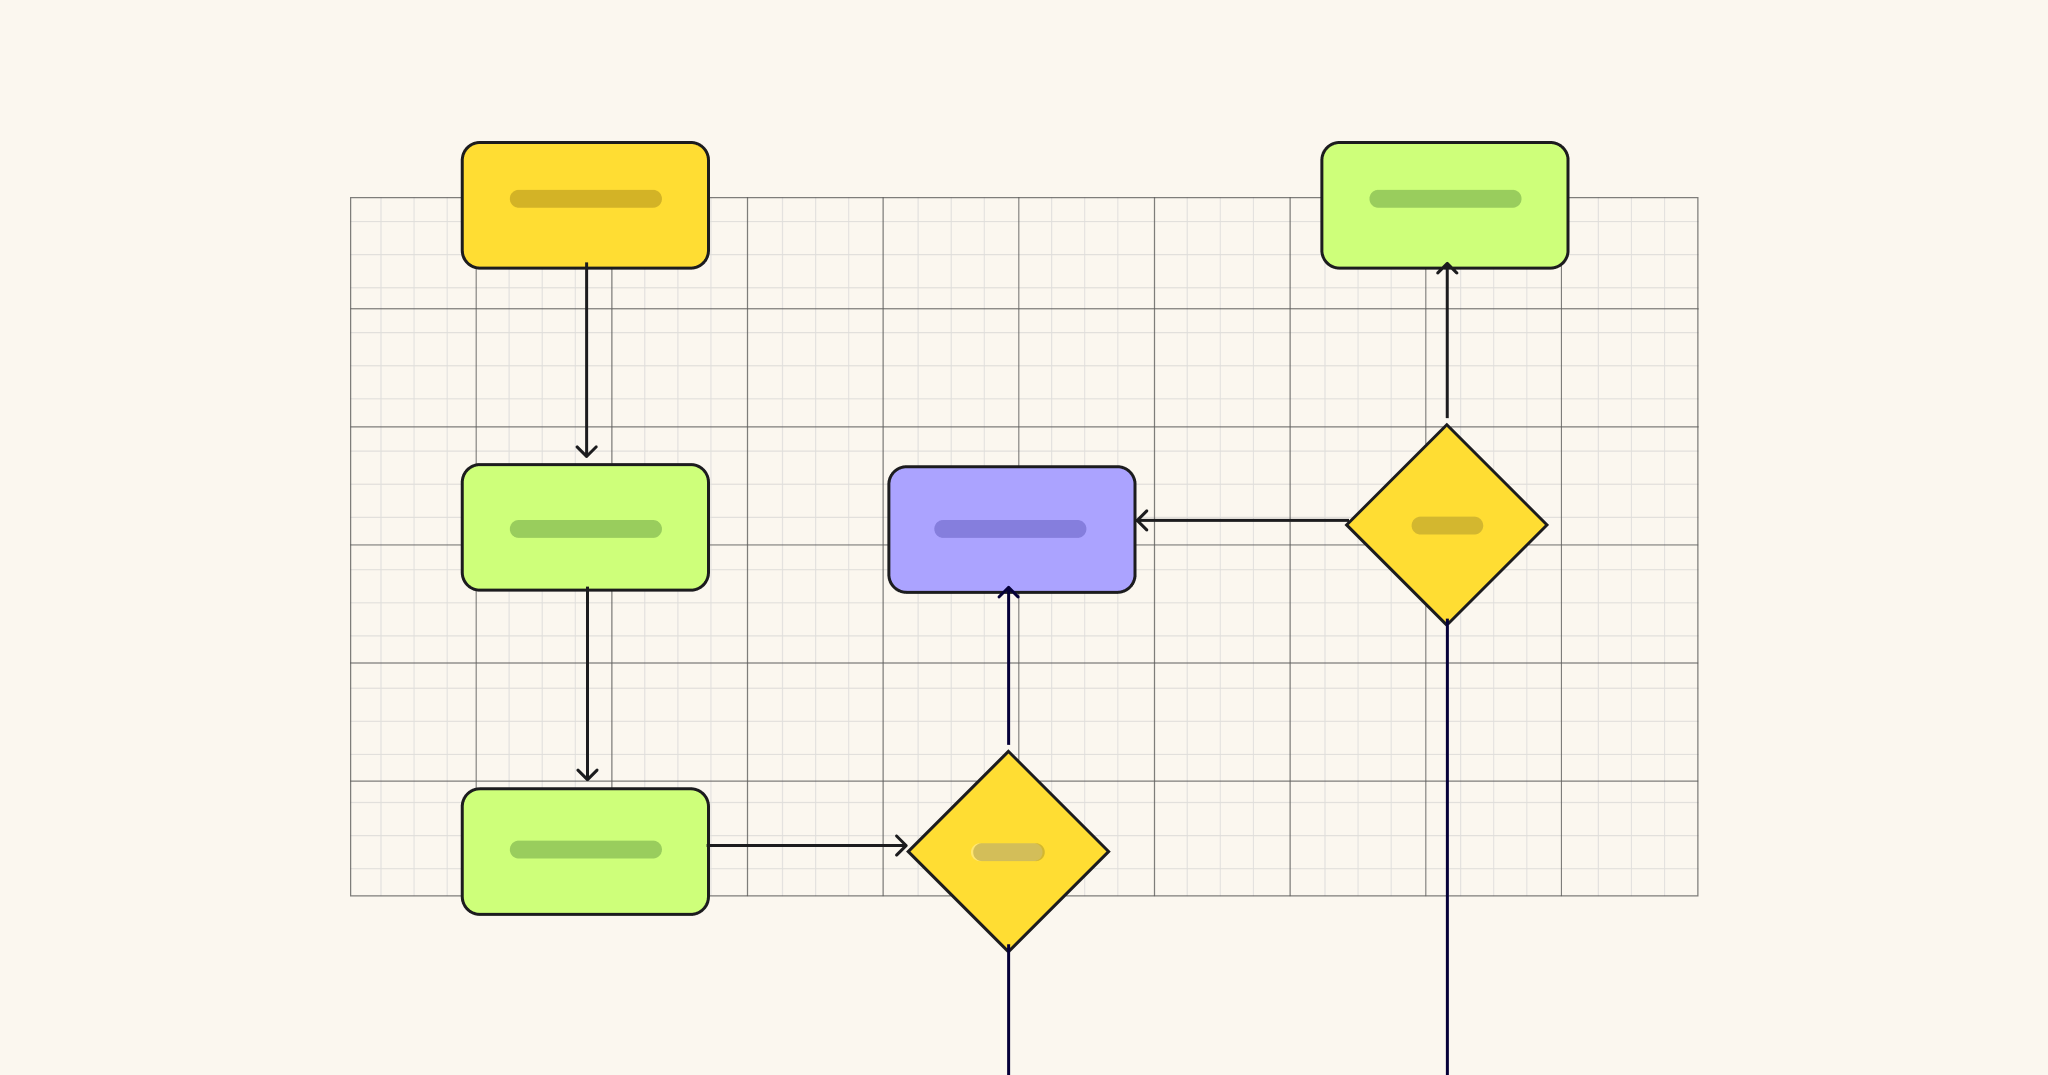
Here’s an example of a troubleshooting flowchart.
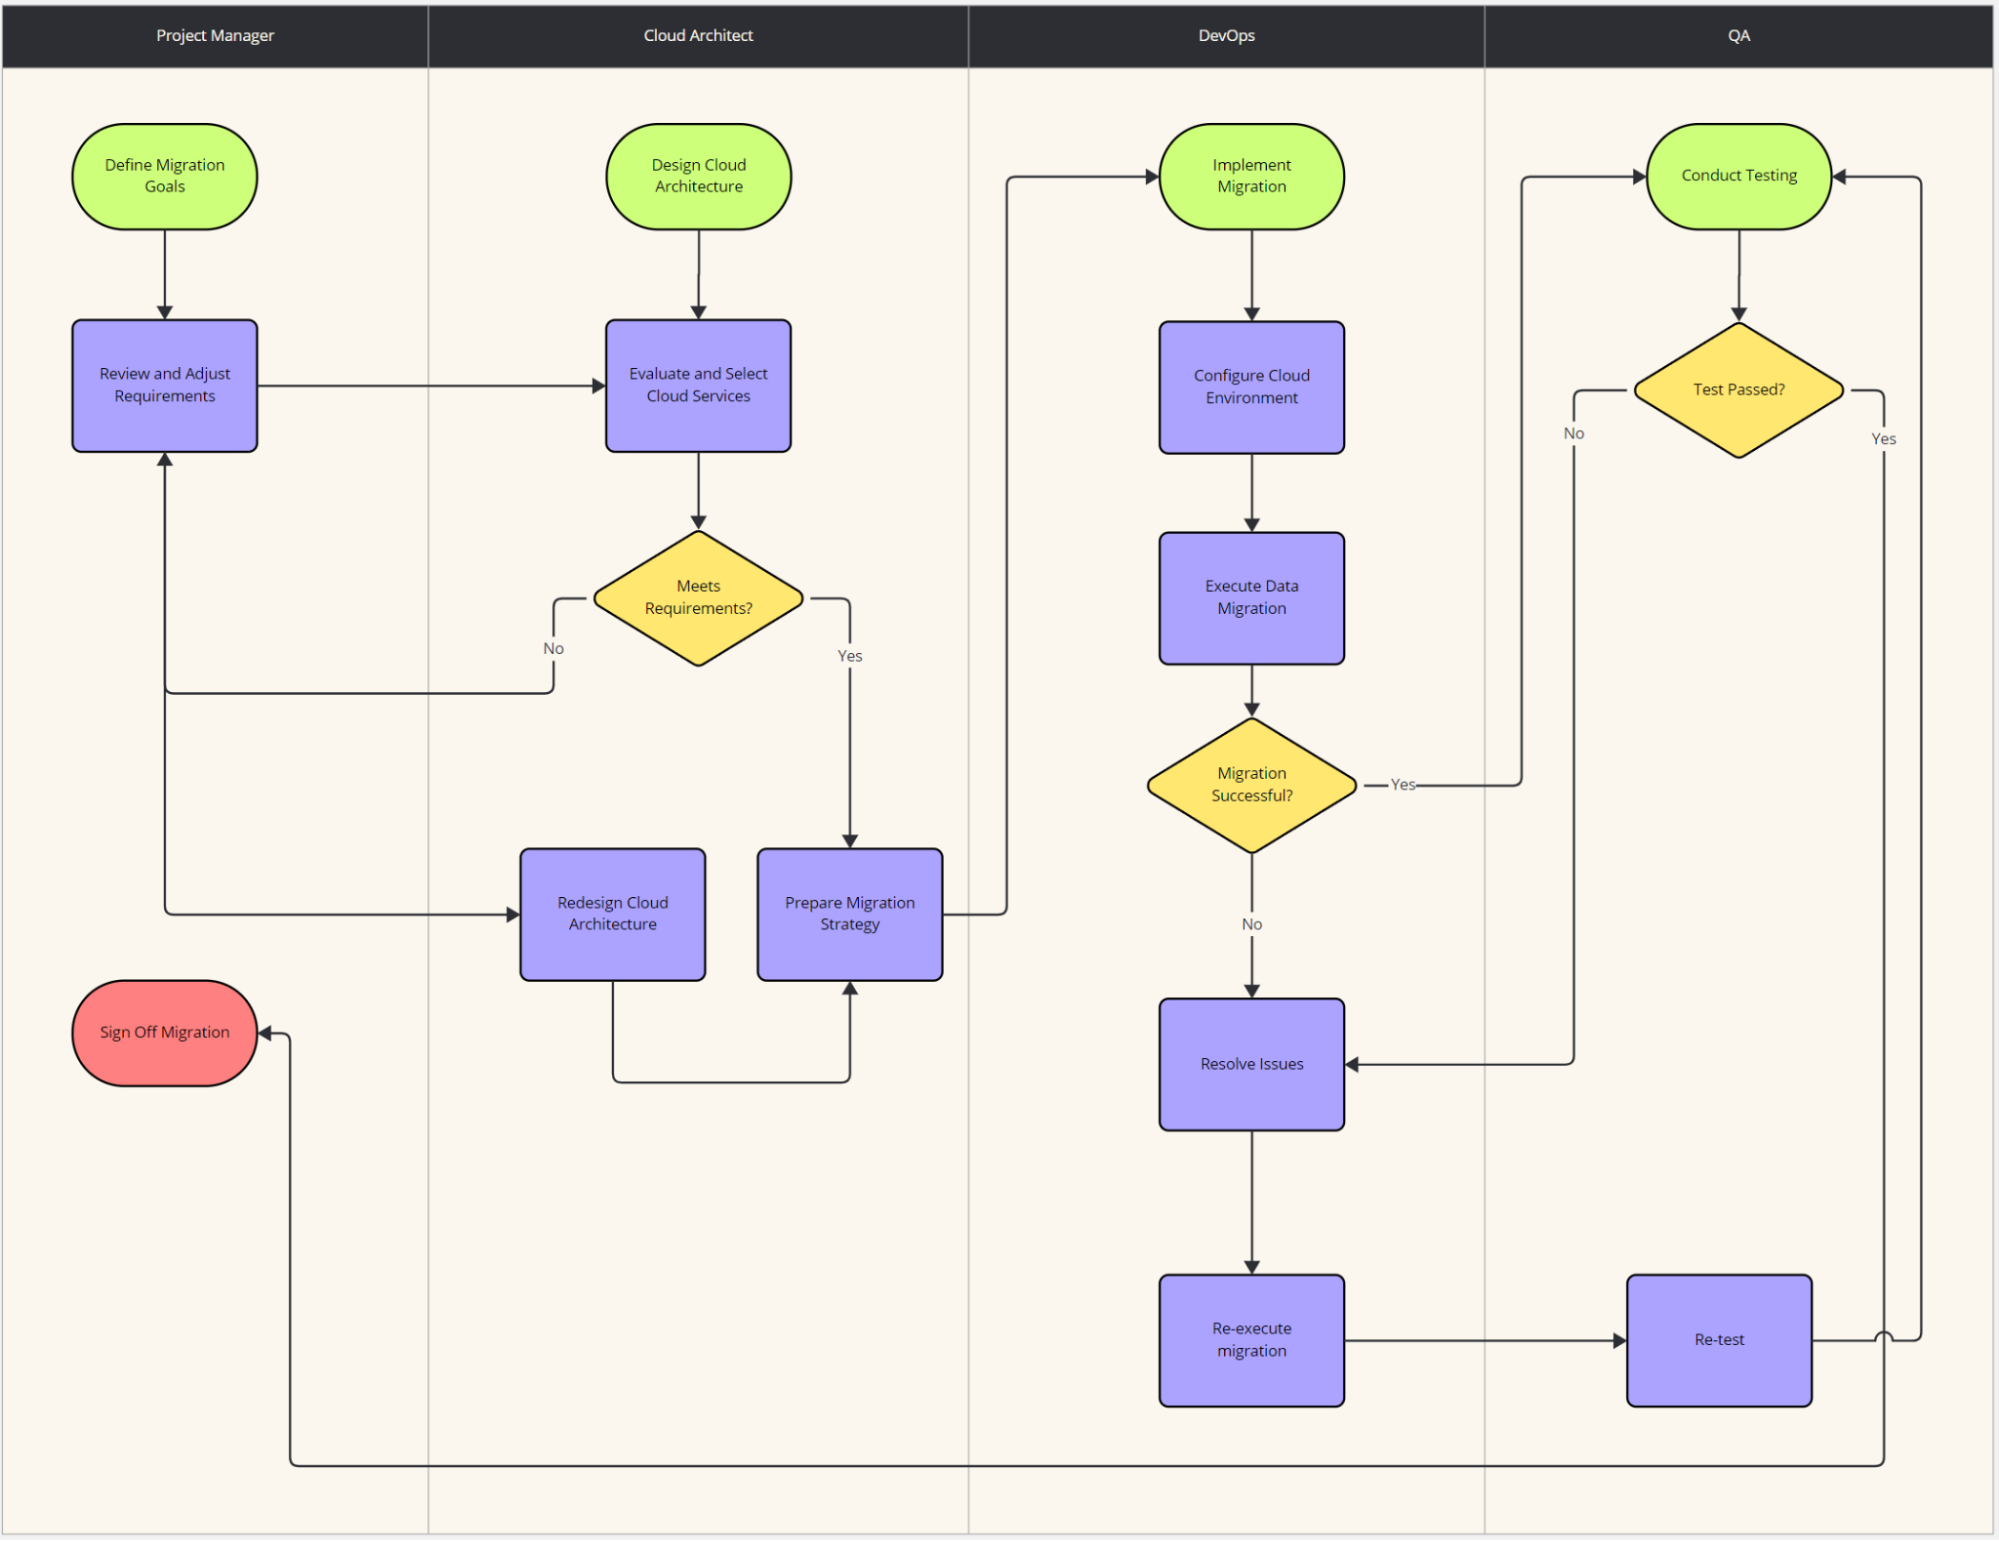
3. Document a system or process
In larger programming projects, having a source of truth that maps how different parts of the system interact is critical for team alignment. This is where a flowchart can be useful, helping to illustrate the flow of data through various modules or functions to show how the entire application works.
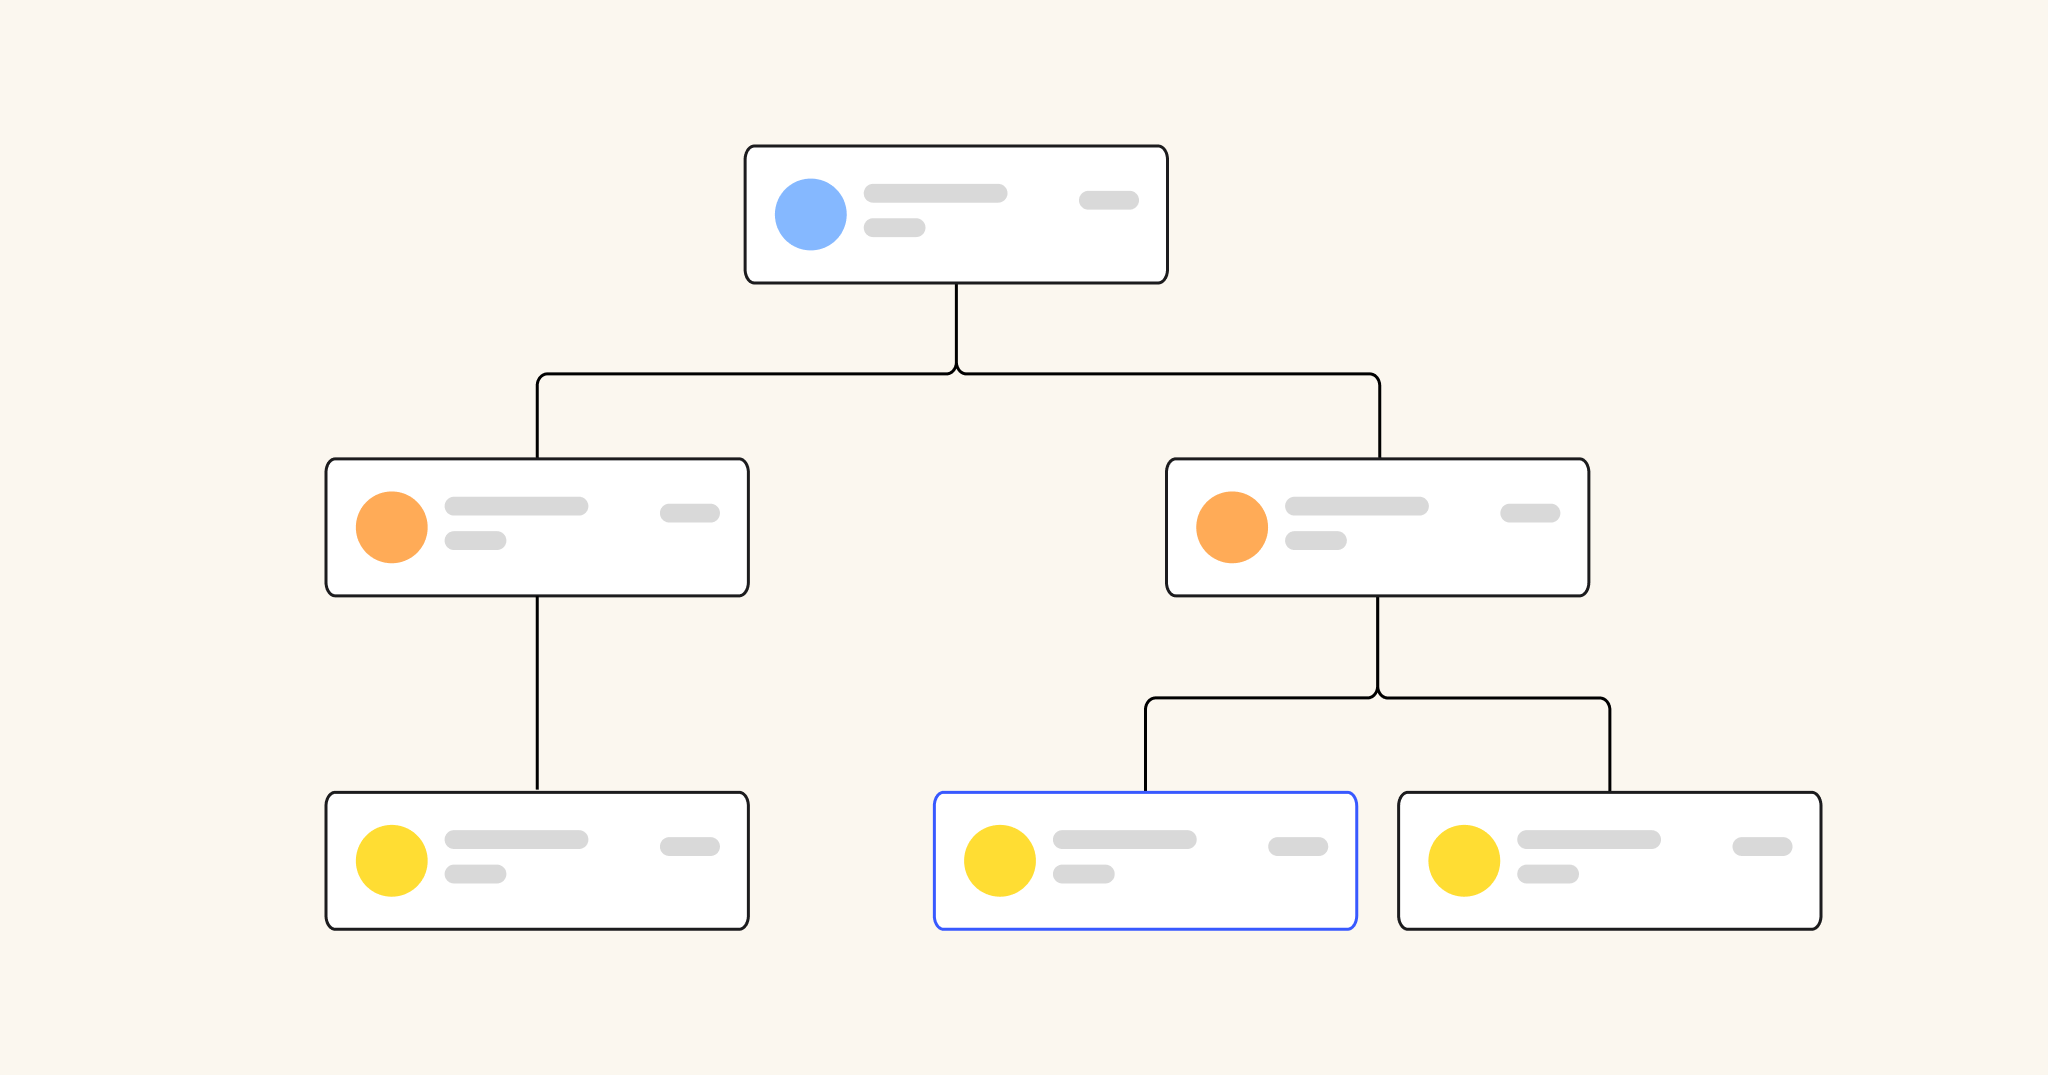
Here’s an example of a flowchart depicting steps in an on-premise to cloud migration project. This shows sub-projects, split between development teams, and how they interact together to ensure a stable migration and post-launch system.
Before starting any flowchart, you should first determine what you’re trying to accomplish, what you’re visualizing, how your work will be used, and who will be using it. This will help you determine the scope of the flowchart, and the level of detail that needs to be included.
Identify the steps in your programming process
Once you’ve determined the purpose of your flowchart, now you need to figure out the key steps in the process or workflow, and the symbols you’ll use to visually represent them.
Start by identifying the main steps in your process. These should include all mission-critical stages or tasks in a sequence or project.
If you’re unsure if you need to include a certain step, ask yourself if it’s necessary for the process or workflow to be completed successfully. If it is, add it to your list of actions to include in the flowchart.
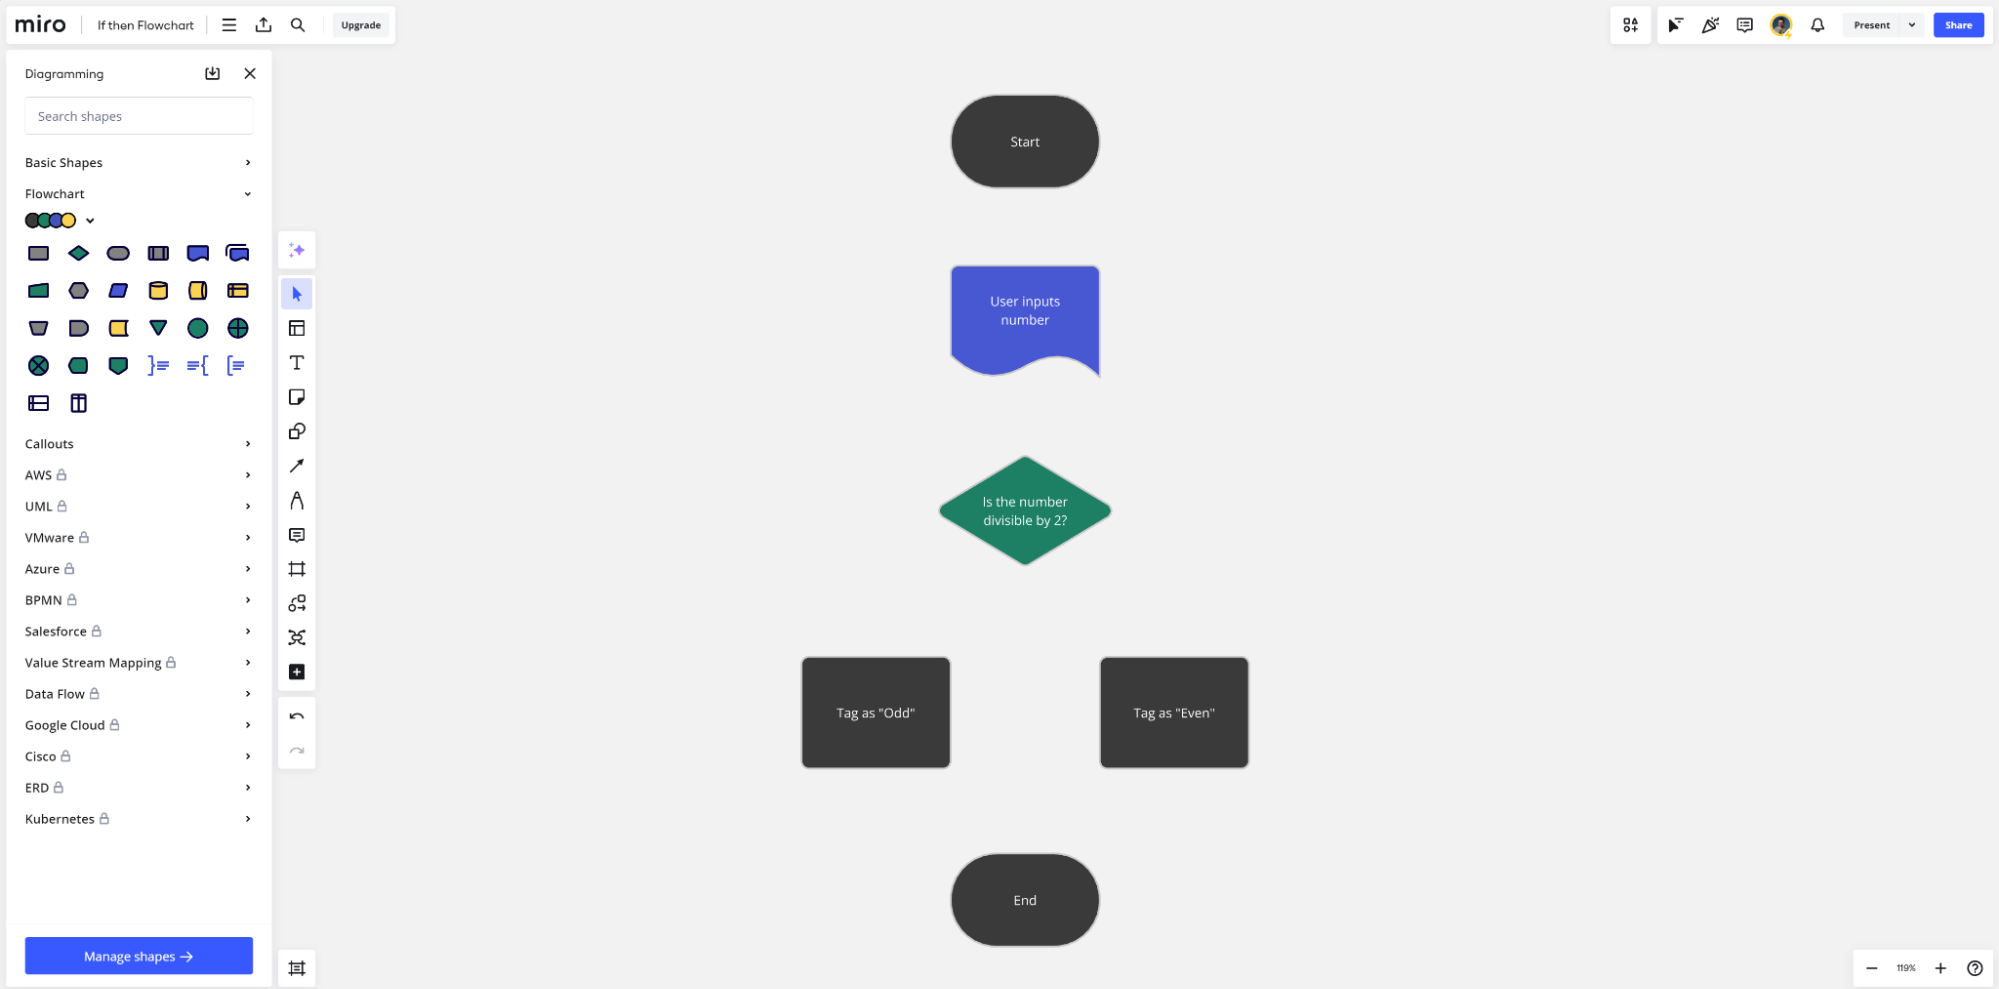
Let’s use the most basic algorithm you might create in a programming project — determining if a number is odd or even, and then categorizing it accordingly. The list of actions in this sequence would be as follows:
- Start of the process
- Input operation—user inputs a number that needs to be checked
- Decision point—checks if the number is divisible by two
- Diamond—a decision between two actions based on the results of the user input
- Action—if “Yes” then the number is given an “even” tag
- Action—if “No” then the number is given an “odd” tag
- End of sequence
With that scope of actions, you can then turn to specifying the visuals you’ll need to map the flowchart.
Choose the symbols for your flowchart
There are many different symbols that can be used in a flowchart, each with their own meaning.
Some of the most common flow symbols include:
- Ovals represent the start or end of a process.
- Rectangles represent a step in the process flow, such as a task, activity, or operation.
- Arrows show the direction and order of the process. They’re known as the connector symbol because they connect the various symbols in the flowchart.
- Parallelograms represent an input or output operation, such as reading data or printing results.
- Diamonds represent a decision point in the process flow.
- Circles are used to connect different parts of a flowchart, and can be used to represent jumps in the flow.
Start by listing all of your actions or tasks in order of completion, and then match them to a symbol based on the criteria above. Here’s how that would look for our odd or even algorithm example.
Did you know?
Miro’s flowchart maker includes dozens of common flowchart symbols and connectors to help you map your processes or workflows.
Determine the flow of your process
Once you’ve assigned symbols to your tasks or actions, you can now determine the flow of the process. Listing each item in order of occurrence is the best way to do this, but it starts to get tricky when you have decision points, if/then trees, and other spots that depend on inputs or defined outcomes.
To help, lay all of your symbols out onto a digital canvas like Miro and arrange them visually in the order by which they occur. Align decision points horizontally so that you start to create a tree layout that maps various paths through the flowchart.
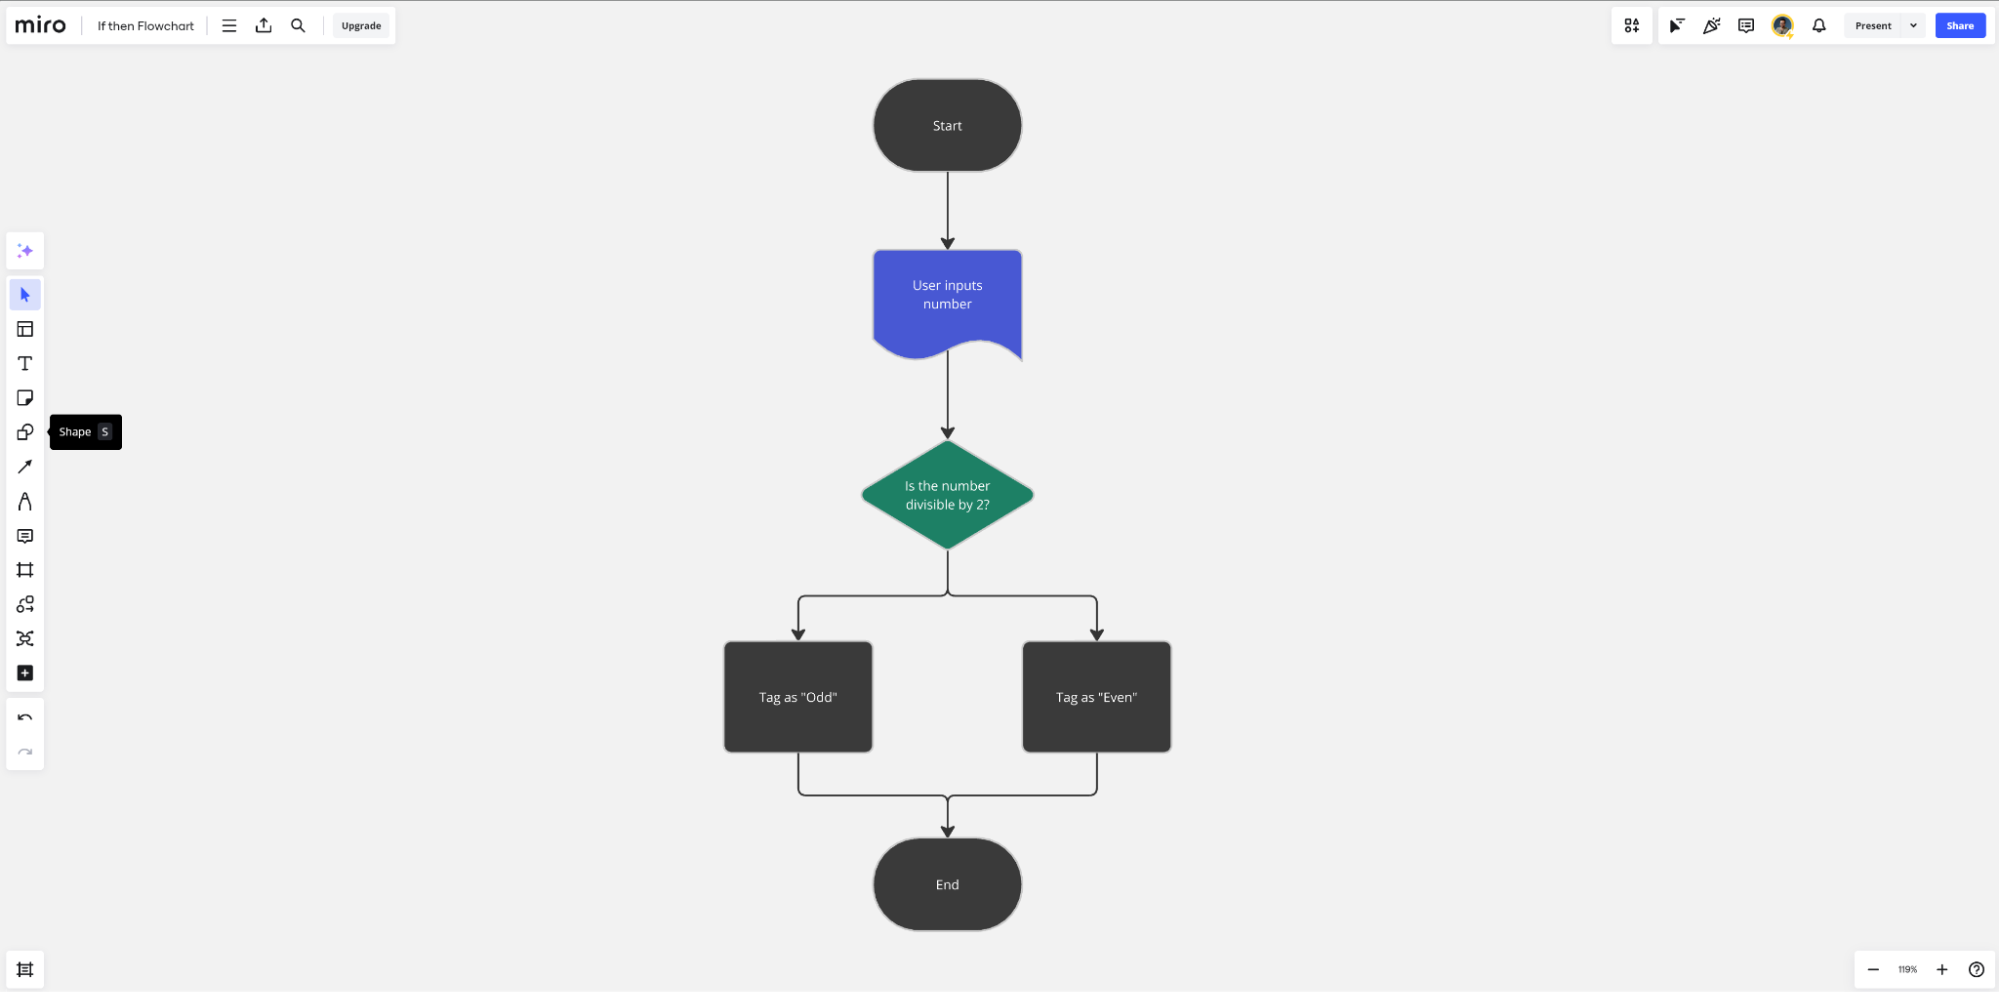
Connect the symbols in your flowchart
All that’s left now is to start connecting each of these symbols using arrows and lines to visually depict the flow through the process or workflow.
Begin adding connection lines and arrows between each step. You can add labels to these lines to explain what happens between each action, or to provide more context about a decision point. Move elements around and readjust the lines as needed to create a logical flow from start to finish.
Make sure the arrow direction is consistent throughout the flowchart. This is what depicts the direction of the workflow or sequence through the action list. Depending on the flowchart, you can also use a combination of solid arrows — to depict a main line through the process — or a dotted line — to depict an optional or dependent side path. Experiment with different line types based on the complexity of your flowchart.
Here’s how that looks in our odd and even number algorithm flowchart.
Use Miro to create your programming flowcharts
The tool you use to create flowcharts is just as important as understanding the process itself. Miro’s flowchart maker enables users to create simple and complex diagrams from scratch or from dozens of pre-existing templates.
Capture the key actions and steps in your sequence collaboratively as a team, and then move into flowchart making mode, all within the same platform. When you’re done, share completed flowcharts with team members within your organization, and collaborate in real-time or async on implementation.
Programming is complex on a good day. Flowcharts are a secret weapon for any programmer, helping you to better plan and understand your applications and networks. This leads to more efficient projects, less time spent on troubleshooting, and an overall better product for end users.