About the Strategy Map Template
The Strategy Map Template provides a clear visual guide to how various elements work together, including financial, customer, internal, and growth perspectives of your business or organization. The strategy map helps you communicate your overall business goals to better align teams and managers.
What is a strategy map?
A strategy map is a visual way to present your organization's strategy and objectives. It is designed to lay out your entire strategy on a single, easily digestible page.
Strategy maps help align various team goals with the overall organization strategy and mission for teams and individual contributors. Teams can create an action plan, using action plan templates, and set actionable, relevant KPIs with it in place.
Strategy mapping is often considered part of the balanced scorecard (BSC) methodology, a strategic planning tool for setting overall team goals.
3 benefits of creating a Strategy Map
A Strategy Map helps align your team and organization on your big-picture strategy, goals, and the steps you’re taking to achieve them. The simplicity of a strategy map allows you to review it quickly and is a great way to keep in check with the top priorities.
Organization
One of the significant benefits of creating a strategy map is that it allows you to organize different perspectives, duties, and goals into a single, easily interpreted visualization of your business strategy. Often, these goals remain unstated or informal; by putting them in a strategy map, you are forced to clarify and lay out ways to accomplish them.
Communication
With your goals and objectives established, a strategy map also services the critical function of communicating these goals to various stakeholders and team members. This will make sure everyone understands what you’re trying to accomplish.
Mission-alignment
Finally, a strategy map is a helpful tool for ensuring each team and team member understands how their own goals and objectives align with overall business goals and objectives. For each team member to stay committed, they need to be able to draw a specific connection between their efforts and overall team efforts. Strategy maps help accomplish this.
How do you use a Strategy Map template?
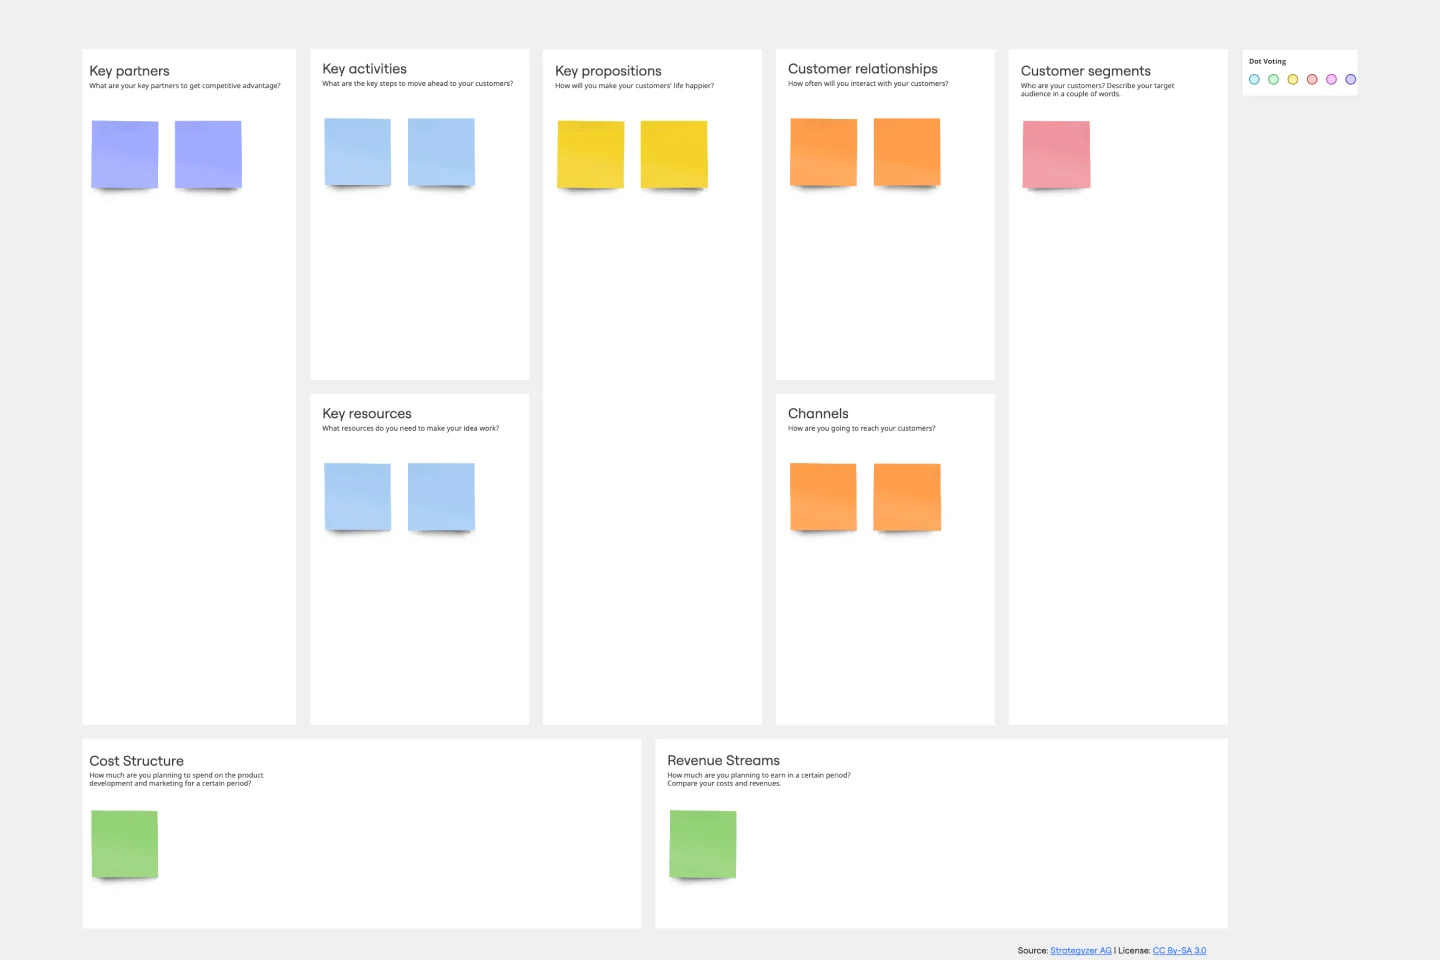
There is no set rule on creating your strategy map, but there are some key components that need to be there. For example, Miro’s Strategy Map Template contains financial, customer, internal, and growth perspectives, so you can assess your strategy against all of these areas.
Below, you will find how to define these perspectives and fill your Strategy Map Template.
Step 1:
Decide on your productivity and growth perspectives
From a financial standpoint, how are these two strategies aligned? The main question here is how can you expand your business but still keep costs down?
Set a plan and trackable objectives; they shouldn't be more than two or three, otherwise, it is difficult to keep track and even communicate it to stakeholders.
Make a list of your goals and get buy-in from your collaborators. Once you have decided on your goals, add them to the respective field on your strategy map.
Step 2:
Customer perspective: product attributes, relationship, and image
Here is a space dedicated to fully adopting your customer's perspective and how they perceive aspects of your product or service. What can you offer that is not already on the market? How different is your product from the competition?
Analyze the key differentiators and how they can help and impact your most important person: your customer.
Step 3:
Internal perspective: operations and innovation
The internal perspective is a deep dive into your internal operations, including everything from customer management to regulatory processes. This is a great opportunity to tackle internal flows' efficiency and how your business is working to reach absolute customer satisfaction.
Step 4:
Growth perspective: resources
How are you going to achieve what you proposed? What’s missing in the picture regarding team development, resources, and process improvement?
Take time to reflect on how you can bring your team up to speed and ensure everyone has the skills and technology to grow.
You can use your strategy map to answer stakeholders’ questions about their roles and responsibilities or when you need to hold a strategic planning meeting. You might also use the map when building a strategy for the next quarter or year. Remember, strategy maps are constructive starting points for brainstorming sessions, collaboration, training, and feedback.
Discover more marketing strategy templates and jumpstart your success!
FAQ about the Strategy Map template
What are the four perspectives in a Strategy Map?
The four perspectives in a strategy map are: financial, customer, internal, and growth perspectives. Each of these key components analyses a different aspect of your strategy, and because they are divided this way, it’s easier for each team or department to see their role in it.