About the Risk Matrix Template
The risk matrix template is a strategic tool designed for professionals to visually assess and prioritize risks. It's a great way to identify and confront potential challenges. This tool characterizes risks based on their probability of occurrence and potential impact, which will help your team pinpoint the most significant risks. By doing so, you can focus your efforts on minimizing their impact. It's a way to optimize your team's productivity and ensure the best possible results.
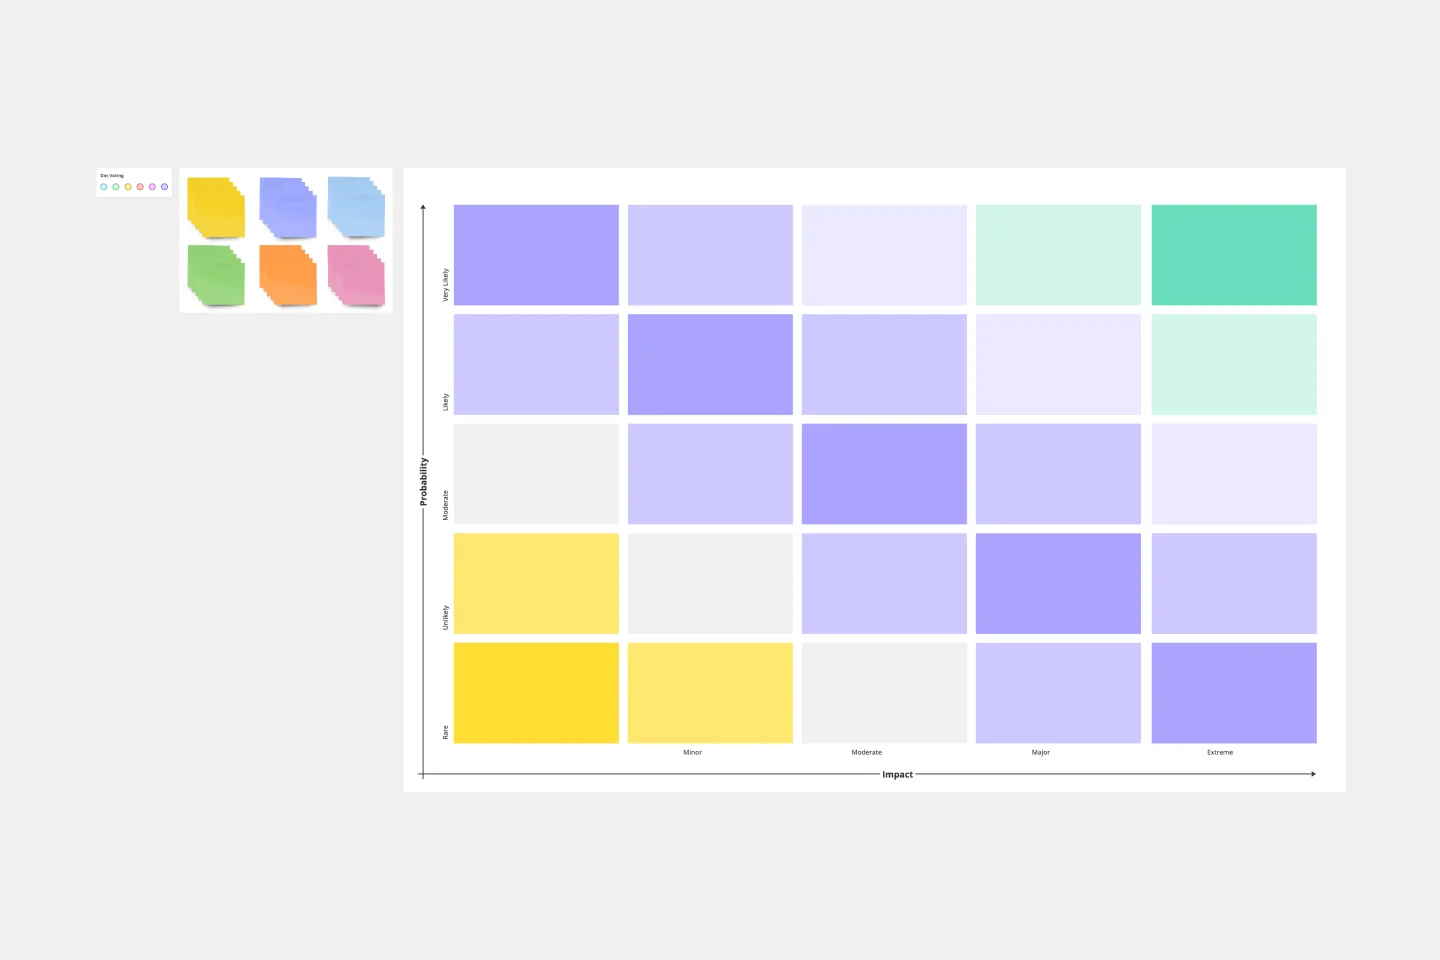
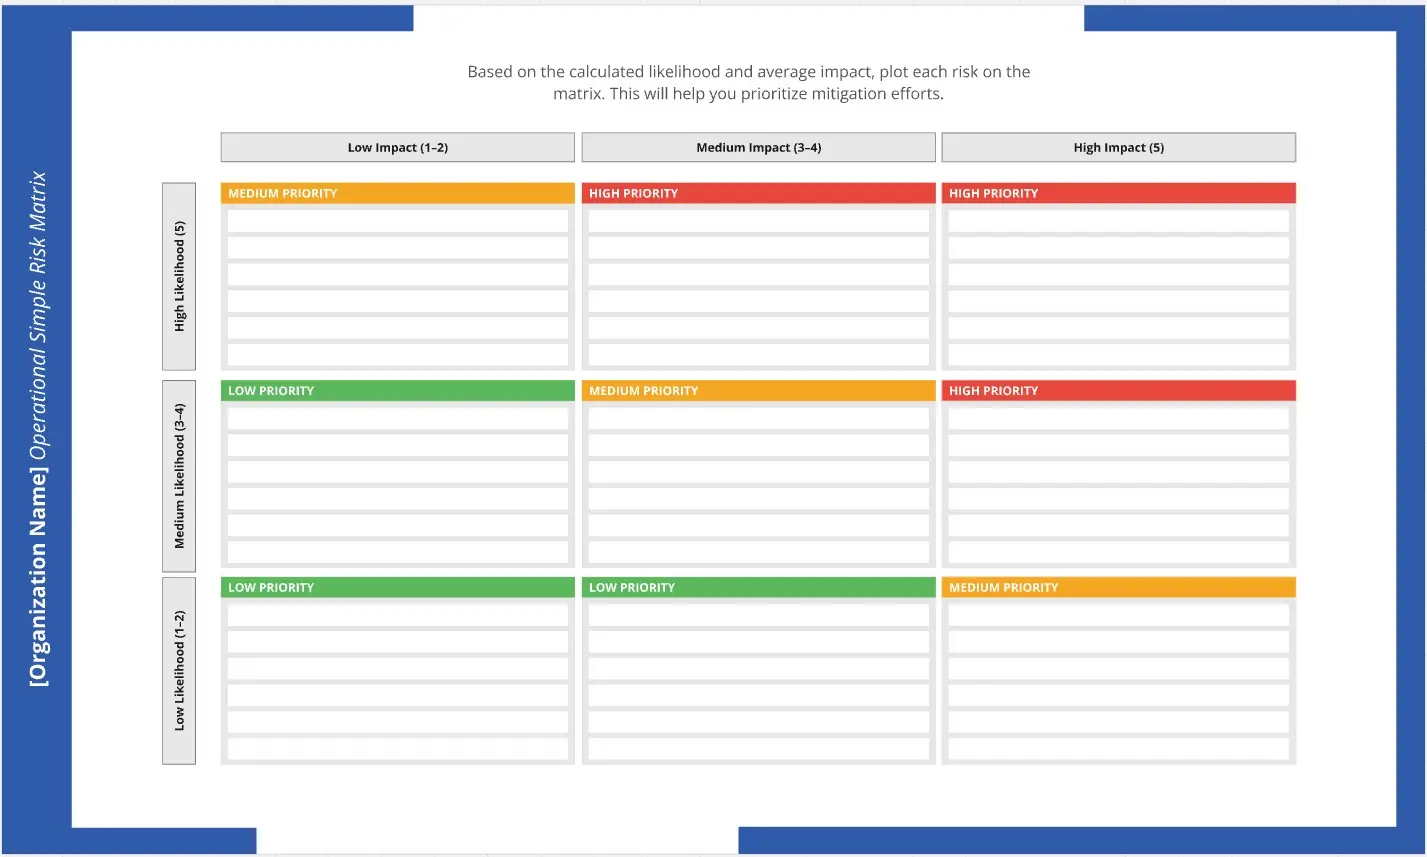
The template is structured around two pivotal axes:
Probability Axis:
Rare: Risks that are least likely to occur.
Unlikely: Risks that have a low chance of materializing.
Moderate: Risks with a balanced or average chance of occurring.
Likely: Risks that are more probable to transpire.
Very Likely: Risks that have a high likelihood of taking place.
Impact Axis:
Trivial: Risks that, even if they occur, will have negligible consequences.
Minor: Risks that may result in small setbacks.
Moderate: Risks that could lead to noticeable challenges but are manageable.
Major: Risks that can significantly disrupt the project or process.
Extreme: Risks that could lead to critical failures or severe consequences.
Each intersection on the matrix defines a risk's severity based on probability and impact, enabling teams to evaluate and strategize their response comprehensively.
How to use the risk matrix template
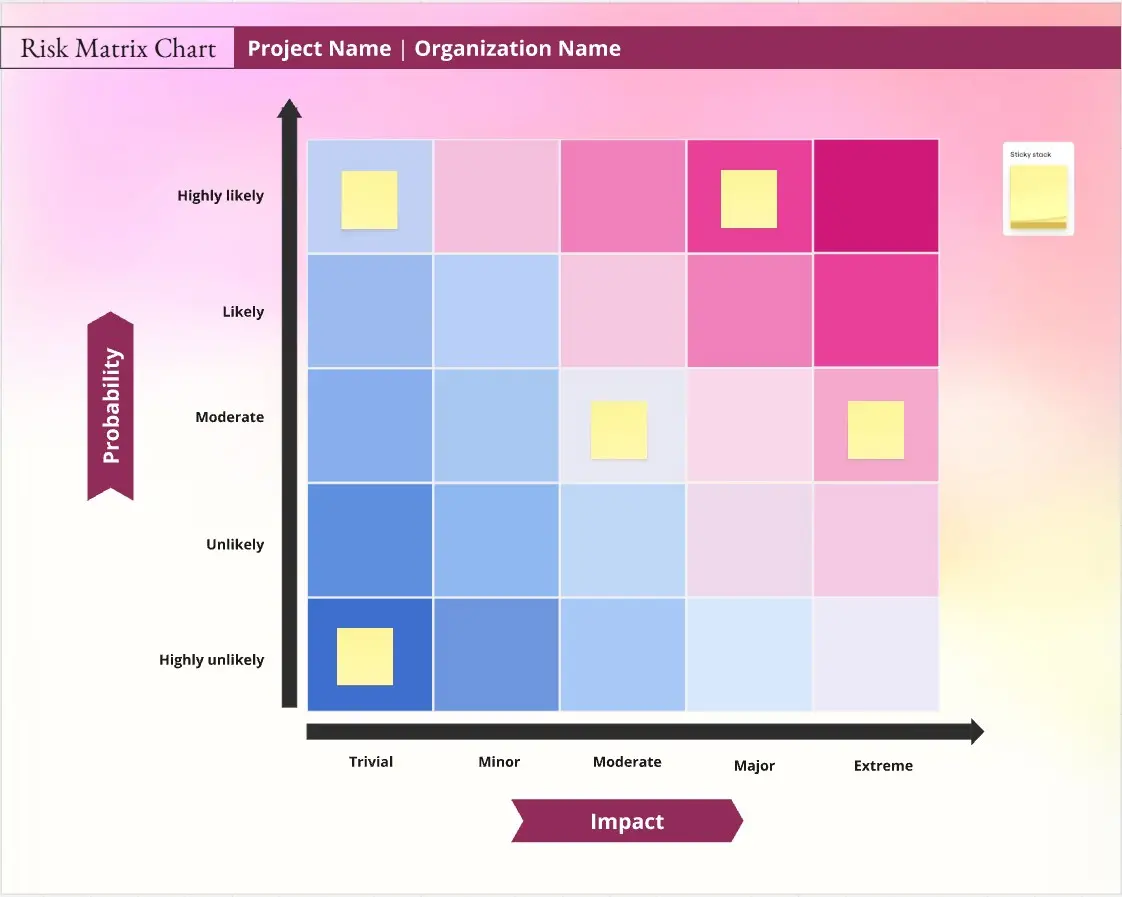
Customization made simple: After placing the template on your board, it's easy to change its size, color, or labels with just a few clicks.
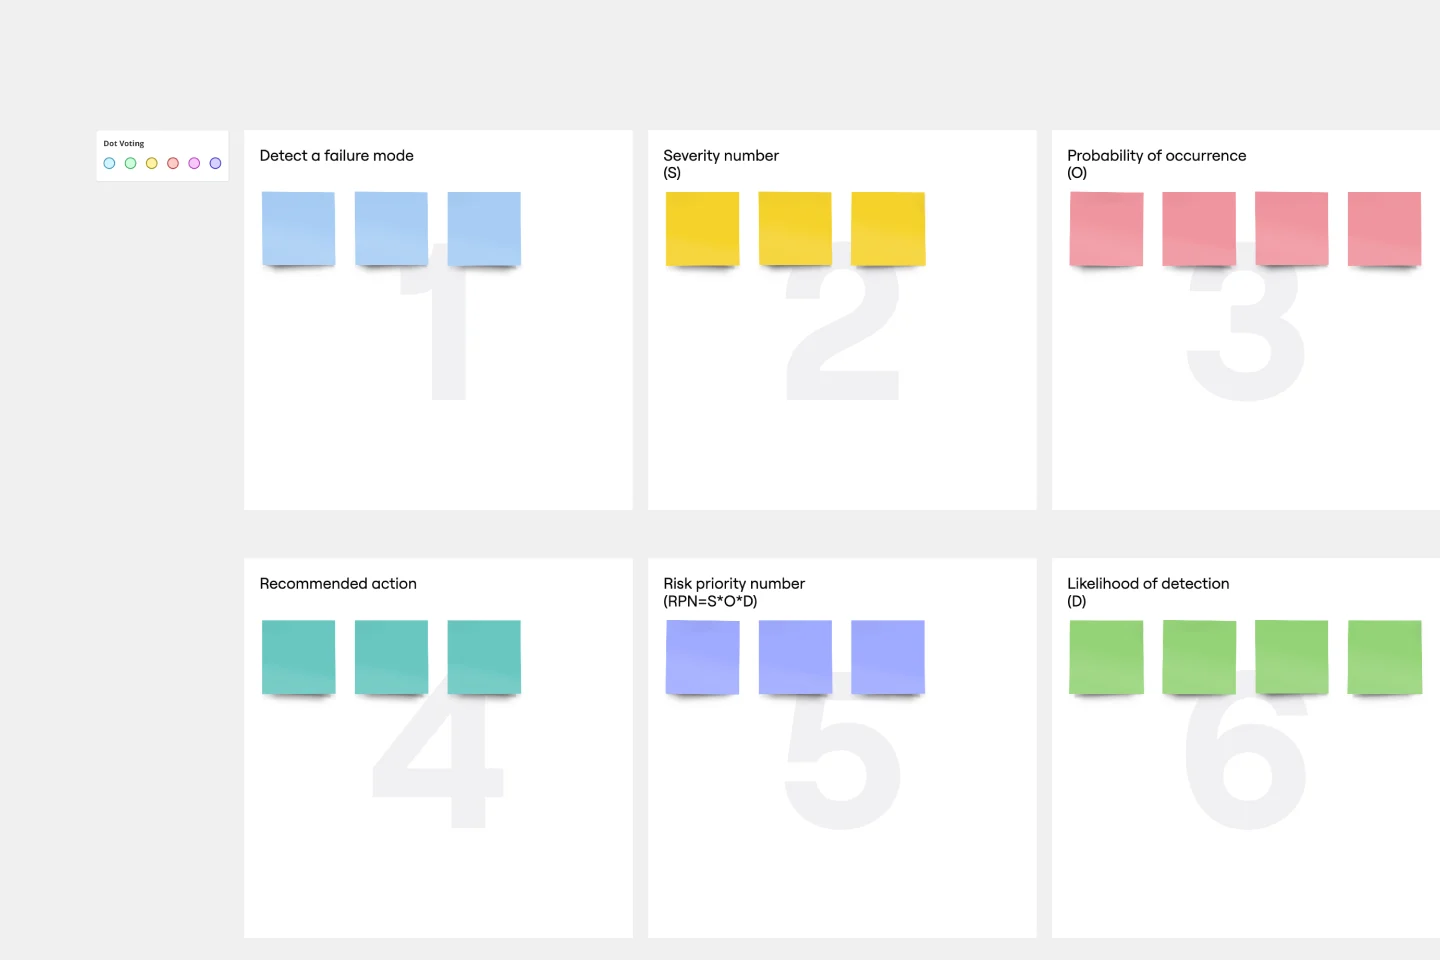
Plotting risks with sticky notes: Add sticky notes to represent different risks, briefly describing them and placing them in the appropriate quadrant based on their likelihood and impact. These notes serve as a dynamic tool that can be easily moved or edited as insights evolve.
Embed contextual artifacts: For a more in-depth analysis and strategic planning, you can add other artifacts onto the board. This might include images, links, or other pertinent resources alongside the sticky notes to provide comprehensive context.
Why should you use the risk matrix template?
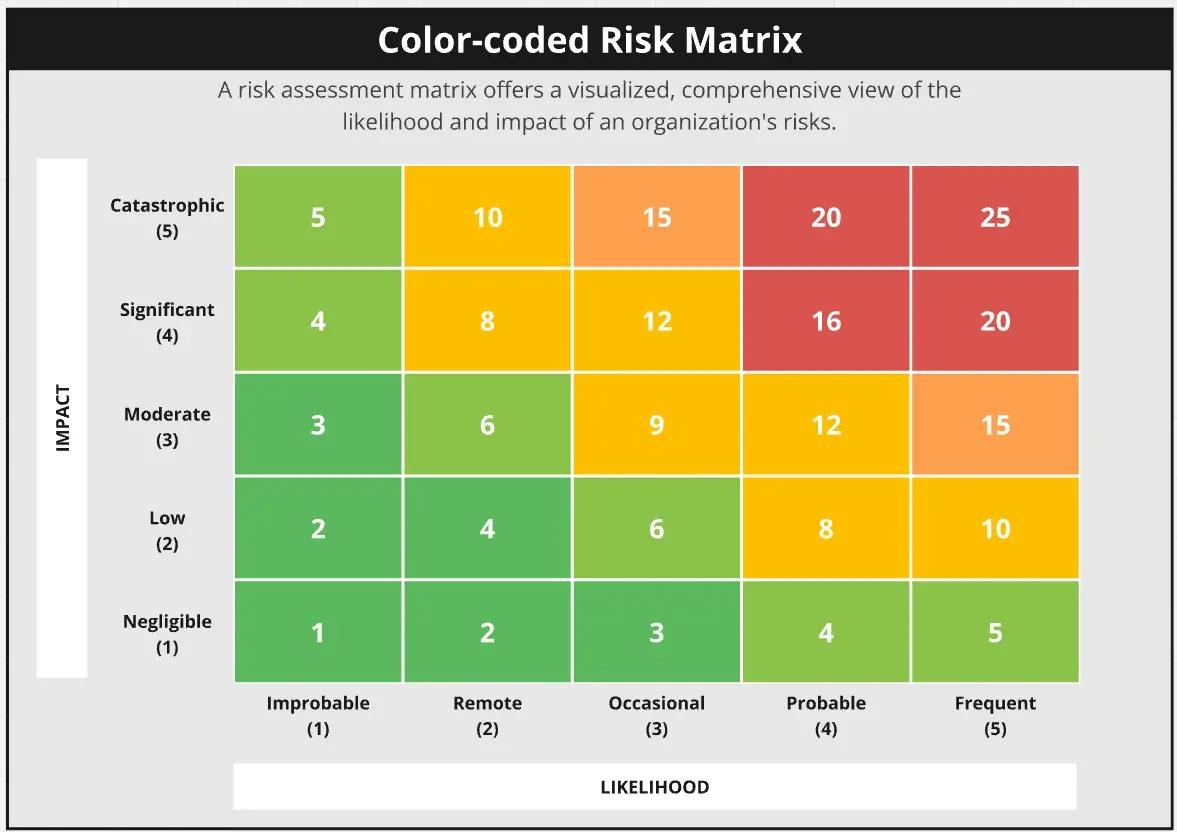
Enhanced visual representation: By categorizing risks on both the probability and impact axes, the risk matrix offers a clear, intuitive visualization, making risks immediately identifiable and communicable to all stakeholders.
Flexibility and personalization: With easy customization options and the ability to add sticky notes for dynamic adjustments, the template is tailored to fit the specific nuances of your project or process.
Holistic analysis: Beyond plotting risks, including artifacts, links, and images, it provides a richer context, ensuring a well-rounded risk analysis.
Collaborative engagement: The interactive nature of the template, especially with sticky notes, fosters team discussions and brainstorming. Multiple members can contribute, adjust, and comment in real time, nurturing a shared understanding of the challenges ahead.
Efficiency and time-saving: Starting with a comprehensive template streamlines the risk assessment process, eliminating the need to create a matrix from scratch and allowing teams to focus on the core risk evaluation.
Discover more gap analysis template examples for effective planning.
Risk Matrix Template FAQs
Can I personalize the labels or categories on the matrix?
Yes, the template is designed for adaptability. You can rename, add, or remove categories based on your project's needs.
How can I add more context to the risks plotted on the matrix?
Beyond using sticky notes for risks, you can embed links, attach documents, images, or connect to other boards. This allows for a comprehensive and layered analysis of each risk.
Is real-time collaboration supported on the template?
Absolutely. The risk matrix template is interactive and supports real-time collaboration. This means team members can simultaneously contribute, move sticky notes, comment, and make adjustments, promoting collective insights and strategies.
With the inclusion of sticky notes, how can I ensure the matrix remains organized?
Sticky notes are adaptable and can be easily resized, recolored, or grouped to maintain clarity. Additionally, their dynamic nature means they can be swiftly moved or edited as insights evolve, ensuring the matrix remains coherent and actionable.