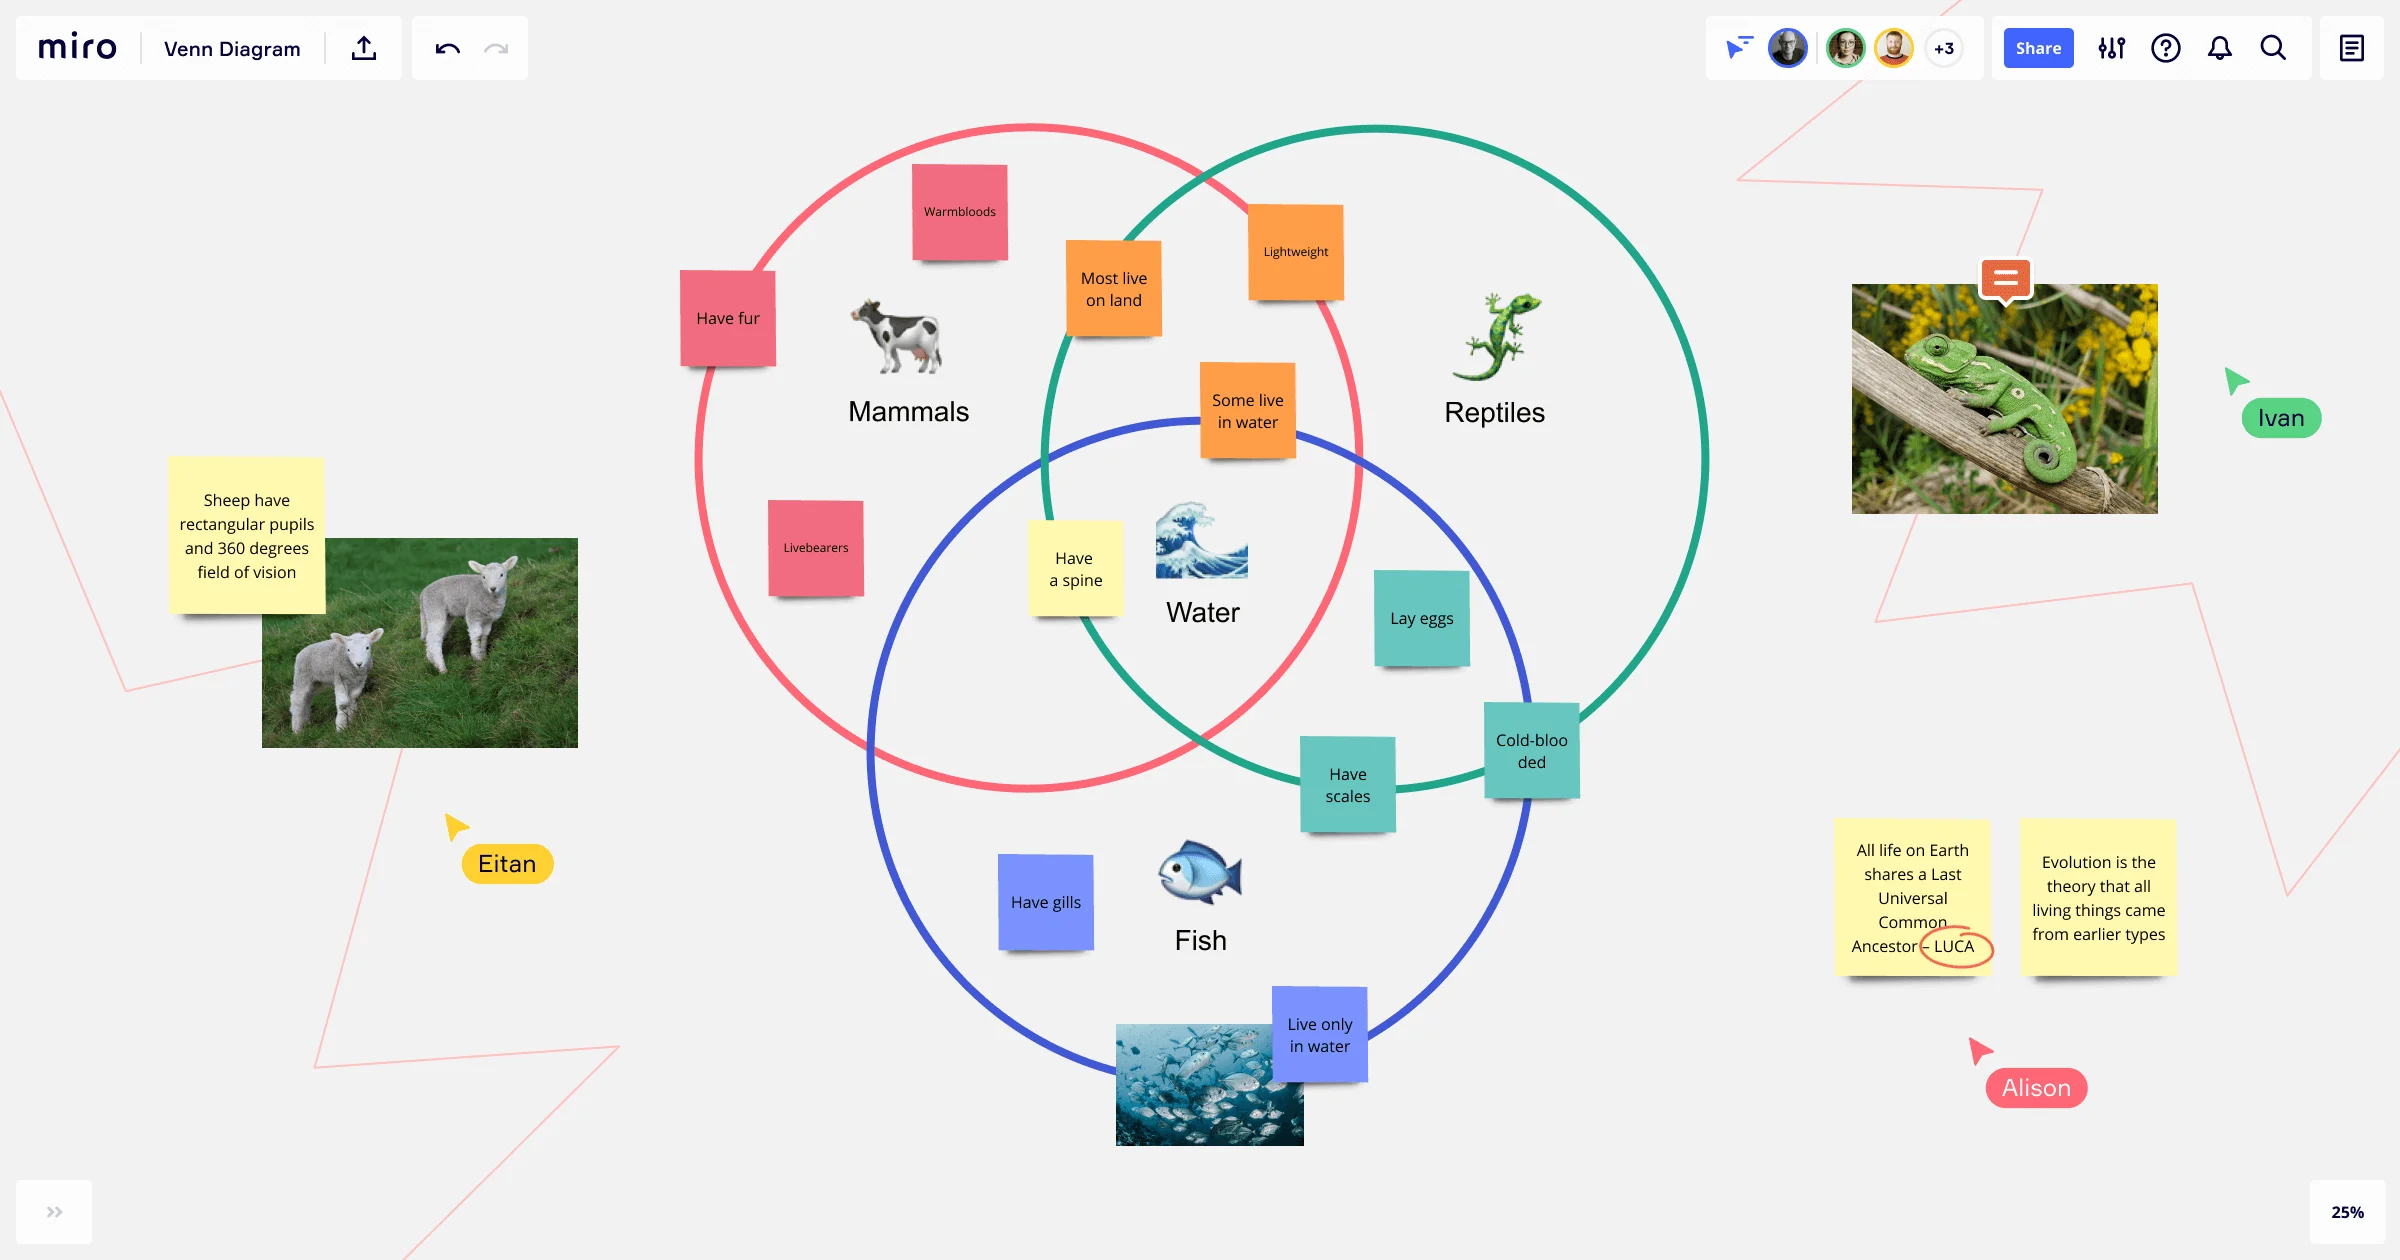
Venn Diagram Symbols Tutorial

Summary
In this guide, you will learn:
- Core Venn diagram symbols: universal set (rectangle), individual sets (circles), intersection (∩), union (∪), complement (A’), and empty set (∅)
- How to create Venn diagrams: define universal set, choose circle count, place elements based on shared/unique traits
- Customizing Venn diagrams: use colors, labels, fonts, and shapes for clarity and visual appeal
- Using Miro’s Venn Diagram maker: easily add, edit, and overlap circles for concepts or data
- Available templates: 2-circle and 3-circle Venn diagrams, including common intersections and Reuleaux triangle
- Sharing and integration: options to share, download, and embed Miro Venn diagrams into presentations or documentation
Try Miro now
Join thousands of teams using Miro to do their best work yet.
Venn diagrams are a critical tool in the analytical arsenal, used to illustrate the logical relationships between different sets. The symbols used in these diagrams—circles, intersections, and more—provide a structured means of representing complex concepts and data sets with precision and simplicity.
This guide is designed to cover the symbols that form the basis of Venn diagrams, enabling users from a range of disciplines to understand and apply them effectively. We will dissect the meaning behind each symbol, how they come together to form a Venn diagram, and the significance of their placement and interaction.
Whether your interest lies in the theoretical underpinnings of set theory, the practical applications in statistical analysis, or the strategic implementations in business scenarios, understanding Venn diagram symbols is fundamental. Through this exploration, both beginners and experts will gain the necessary insights to utilize these diagrams to their full potential, enhancing both clarity and efficacy in their work.
The Basics of Venn Diagram Construction
Circles – The Foundation of Venn Diagrams
The circles in a Venn diagram are the foundation upon which relationships are built. Each circle typically represents a set in the diagram. When circles intersect, they visually represent the common elements between sets, and when they don't intersect, they indicate that the sets have no common elements.
Overlapping Areas – The Intersection
The overlapping regions of circles are critical—they depict the intersection of sets, which is the set of elements common to all overlapping sets. For instance, if one circle represents 'people who like apples' and another 'people who like bananas,' the overlap shows 'people who like both apples and bananas.'
Non-Overlapping Areas – The Difference
Areas that do not overlap represent elements that are unique to a particular set, known as the difference. These are the elements that belong to one set but not to the other. Understanding this concept is crucial when distinguishing between exclusive and shared characteristics.

Core Symbols in Venn Diagrams
Universal Set Symbol and Its Representation
The universal set is the 'big picture' space in which all other sets reside. It is often depicted as a rectangle that encloses all the other elements and sets within the Venn diagram. This concept is paramount as it establishes the full context for the analysis.
Individual Set Symbols (A, B, C, etc.)
Each individual set within a Venn diagram is usually represented by a circle or an oval and is labeled with an uppercase letter. These labels help differentiate between the sets when describing the relationships and operations performed on them.
Intersection Symbol (∩)
The intersection symbol '∩' is vital in understanding shared characteristics. It is used between set names to indicate elements that appear in both sets, such as A ∩ B, which reads as "the intersection of set A and set B."
Union Symbol (∪)
The union symbol '∪' signifies the combination of all elements from the sets involved, without duplication. It represents the total elements that are in set A, set B, or both.
Complement Symbol (A’)
The complement symbol (A’) represents the elements that are not in the specified set but are in the universal set. This concept is especially important when considering what is excluded from a set.
Empty Set Symbol (∅)
The empty set symbol '∅' denotes a set with no elements. It is an important concept in set theory, representing the idea of nothingness or the absence of elements.
Advanced Symbols and Notations in Venn Diagrams
Conditional Relationships
Venn diagrams can express conditional relationships, indicating scenarios where the existence of one element may depend on another. This is often used in logic to express if-then statements.
Disjoint Sets and Their Symbols
Disjoint sets have no elements in common, and in a Venn diagram, this is represented by non-overlapping circles. Understanding this helps in identifying completely separate categories.
Subset and Superset Symbols
The subset symbol '⊆' shows that all elements of one set are contained within another, while the superset symbol '⊇' indicates the reverse. Grasping these concepts is crucial for understanding hierarchical relationships between sets.
Cartesian Product in Venn Diagrams
The Cartesian product, represented by '×', is not typically shown in Venn diagrams but is a related concept. It represents all possible ordered pairs that can be made from two sets, which is foundational in probability and other mathematical disciplines.
Creating Venn Diagrams
Creating a Venn diagram as a visual representation can be very straightforward. Miro, with its infinite workspace space and collaboration features, is the perfect Venn diagram tool to create a Venn diagram from scratch.
Selecting the Right Number of Sets
The number of sets you choose to represent in a Venn diagram should reflect the complexity and requirements of the problem or data you are analyzing. More sets allow for a more detailed analysis but also increase complexity.

Get started with a Venn Diagram template
Miro also has a range of ready-to-use Venn diagram templates that you can tailor to your needs:
2 Circle Venn Diagram Template
3 Circle Venn Diagram Template
4 Circle Venn Diagram Template
5 Circle Venn Diagram Template
Check all Venn Diagram templates made by Miro and our community.
Analyzing the Diagram
Once constructed, a Venn diagram serves as a tool for analysis. By examining the relationships among the sets, one can derive conclusions about the data or the logical structure presented. Miro’s collaborative platform provides a perfect platform for analysis with others, whether in person, remote, or hybrid settings.
Applications of Venn Diagram Symbols
Mathematics and Logic
Venn diagrams are widely used in mathematics and logic to illustrate set theory and to solve problems involving sets.
Statistics and Probability
In statistics and probability, Venn diagrams help in understanding concepts like mutually exclusive events and probabilities of combined events.
Computer Science
Venn diagrams are utilized in computer science for database querying, algorithm design, and understanding logical structures.
Linguistics and Categorization
These diagrams assist in linguistic studies and categorization by visually structuring language relationships and classifications.
Final thoughts on Venn diagram symbols
In conclusion, Venn diagrams are more than just intersecting circles—they are a fundamental tool in set theory and logic, providing a visual representation of complex relationships.
Understanding the symbols and their correct usage is essential for anyone looking to explore the realms of mathematics, logic, or data organization. Whether you're a beginner or an expert, mastering Venn diagrams can greatly enhance your analytical and reasoning skills.
Author: Miro Team
Last update: October 10, 2025