About the Miro Flowchart Template Collection
Efficiency isn't just about drawing lines; it’s about identifying bottlenecks before they stall your growth. Miro’s flowchart templates provide a high-fidelity environment for mapping complex logic, from technical system architecture to cross-functional business operations.
Why Teams Standardize on Miro Flowcharts
While basic tools create static images, Miro builds living documentation. Our flowchart templates are the bridge between a messy brainstorm and a rigorous process.
Intelligent Diagramming (Miro AI): Generate complex logic in seconds. Use Miro AI to transform natural language prompts into structured UML, ERD, or process flowchart templates, bypassing the "blank canvas" fatigue.
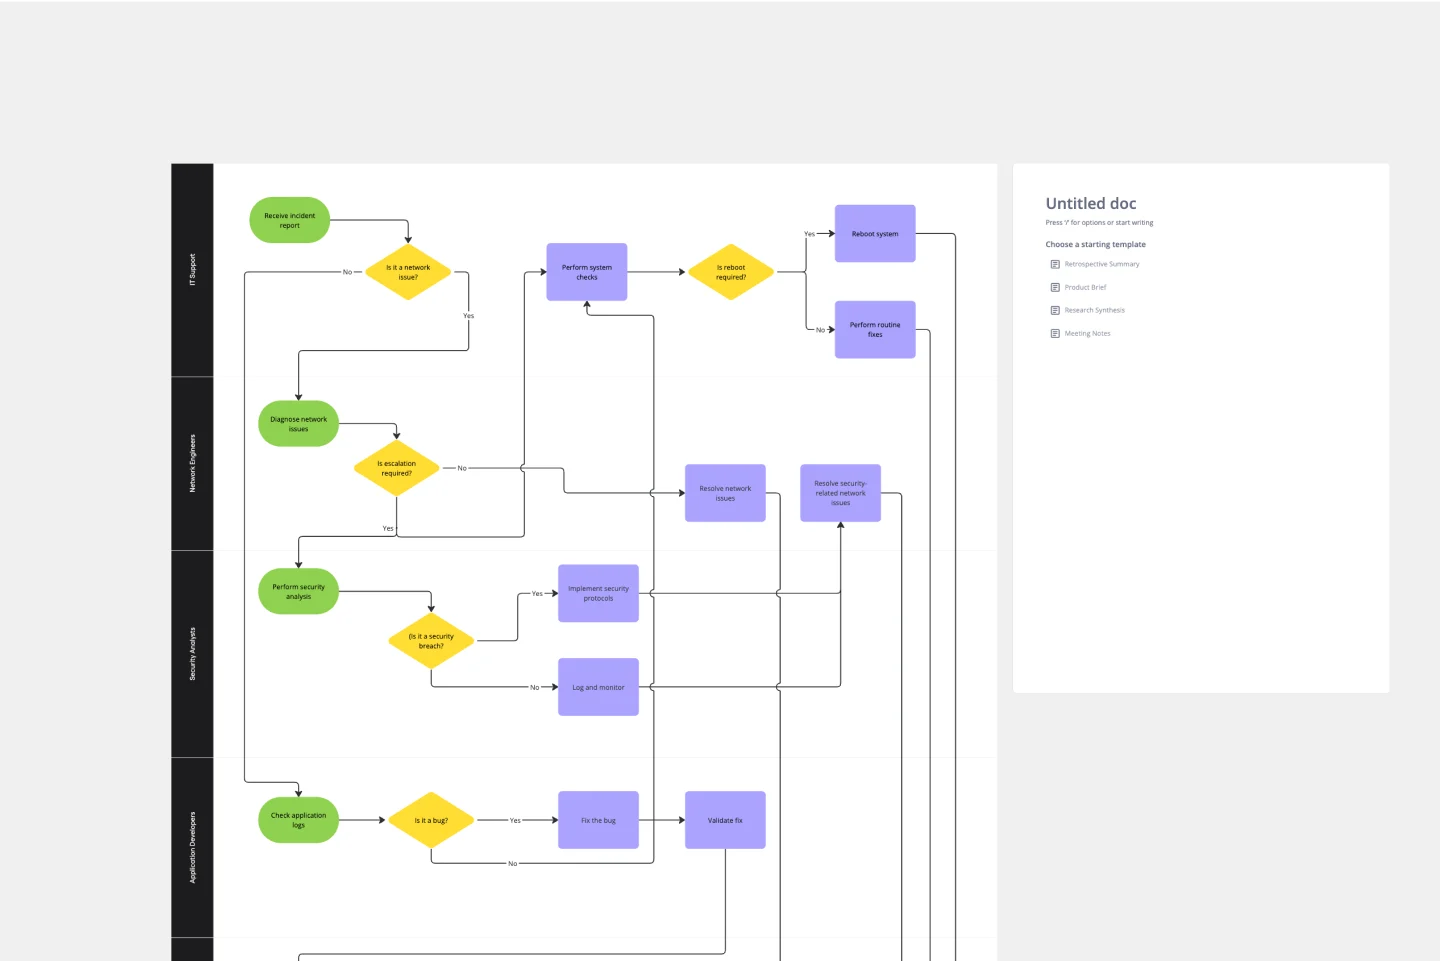
Mastering Flowchart Symbols Beyond the Basics: Miro offers an extensive library of industry-standard flowchart symbols from Terminals and Process steps to Decisions (diamonds) and Data connectors. Our intuitive interface ensures you're not just drawing shapes, but accurately representing actions, inputs, and outputs with their correct semantic meaning.
Smart Containers & Auto-Layout: Focus on the logic, not the alignment. Our flowchart templates feature auto-layout capabilities that keep your diagrams professional and readable, regardless of how many steps you add.
Ecosystem Integration: Bring your processes where work actually happens. Embed your flowchart templates into Jira for developers, or push updates to Slack to keep stakeholders informed of process changes.
Enterprise-Grade Customization: Move beyond basic boxes. Utilize specialized shapes, metadata layers, and smart connectors within our flowchart templates to meet industry-specific compliance and documentation standards.
Strategic Use Cases: How to Use Flowchart Templates Beyond Basic Process Mapping
To truly optimize your organization, use our flowchart templates to drive these high-value outcomes:
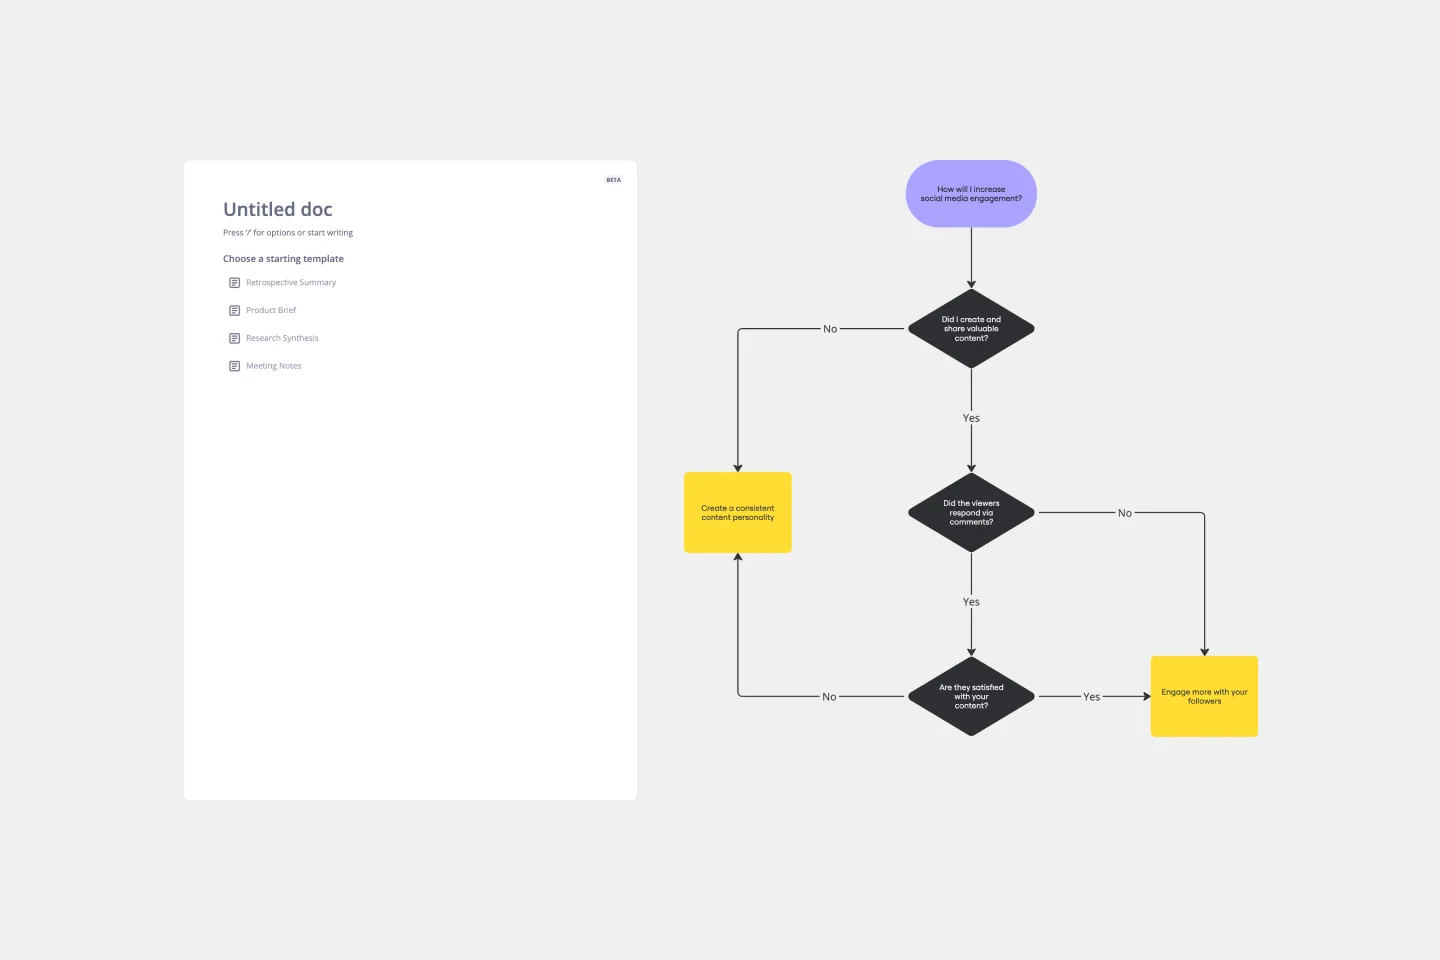
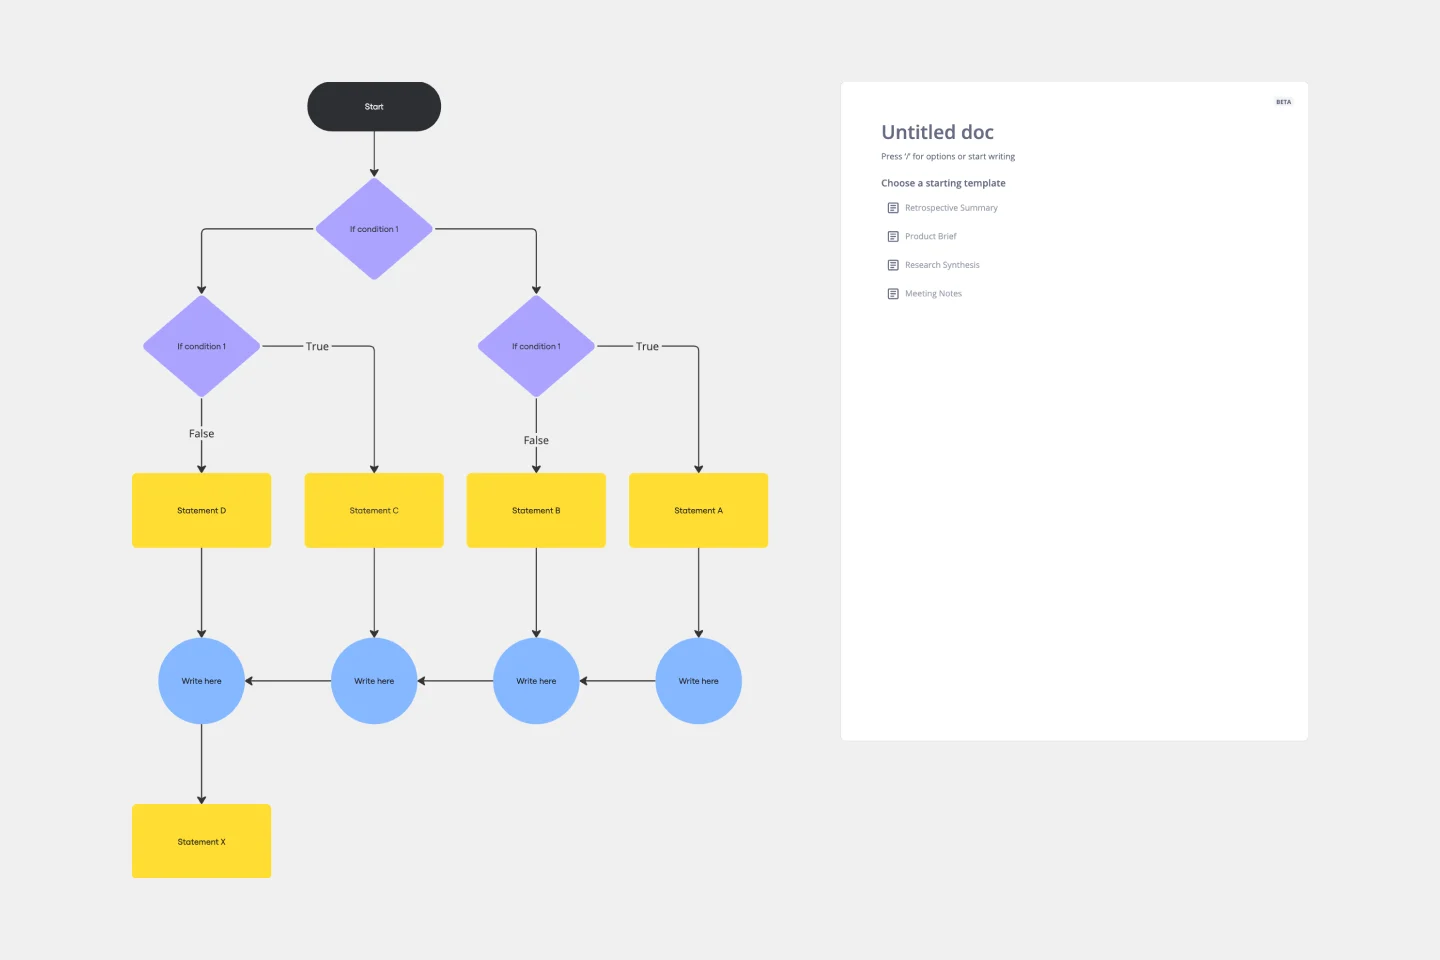
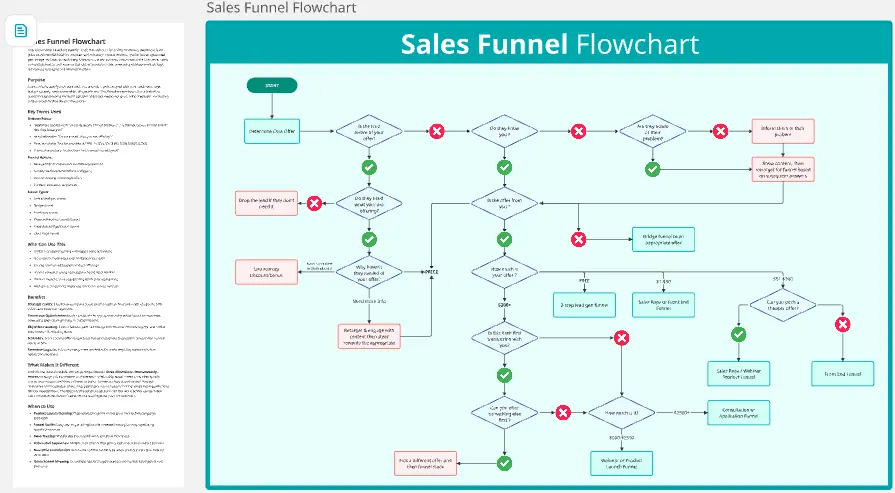
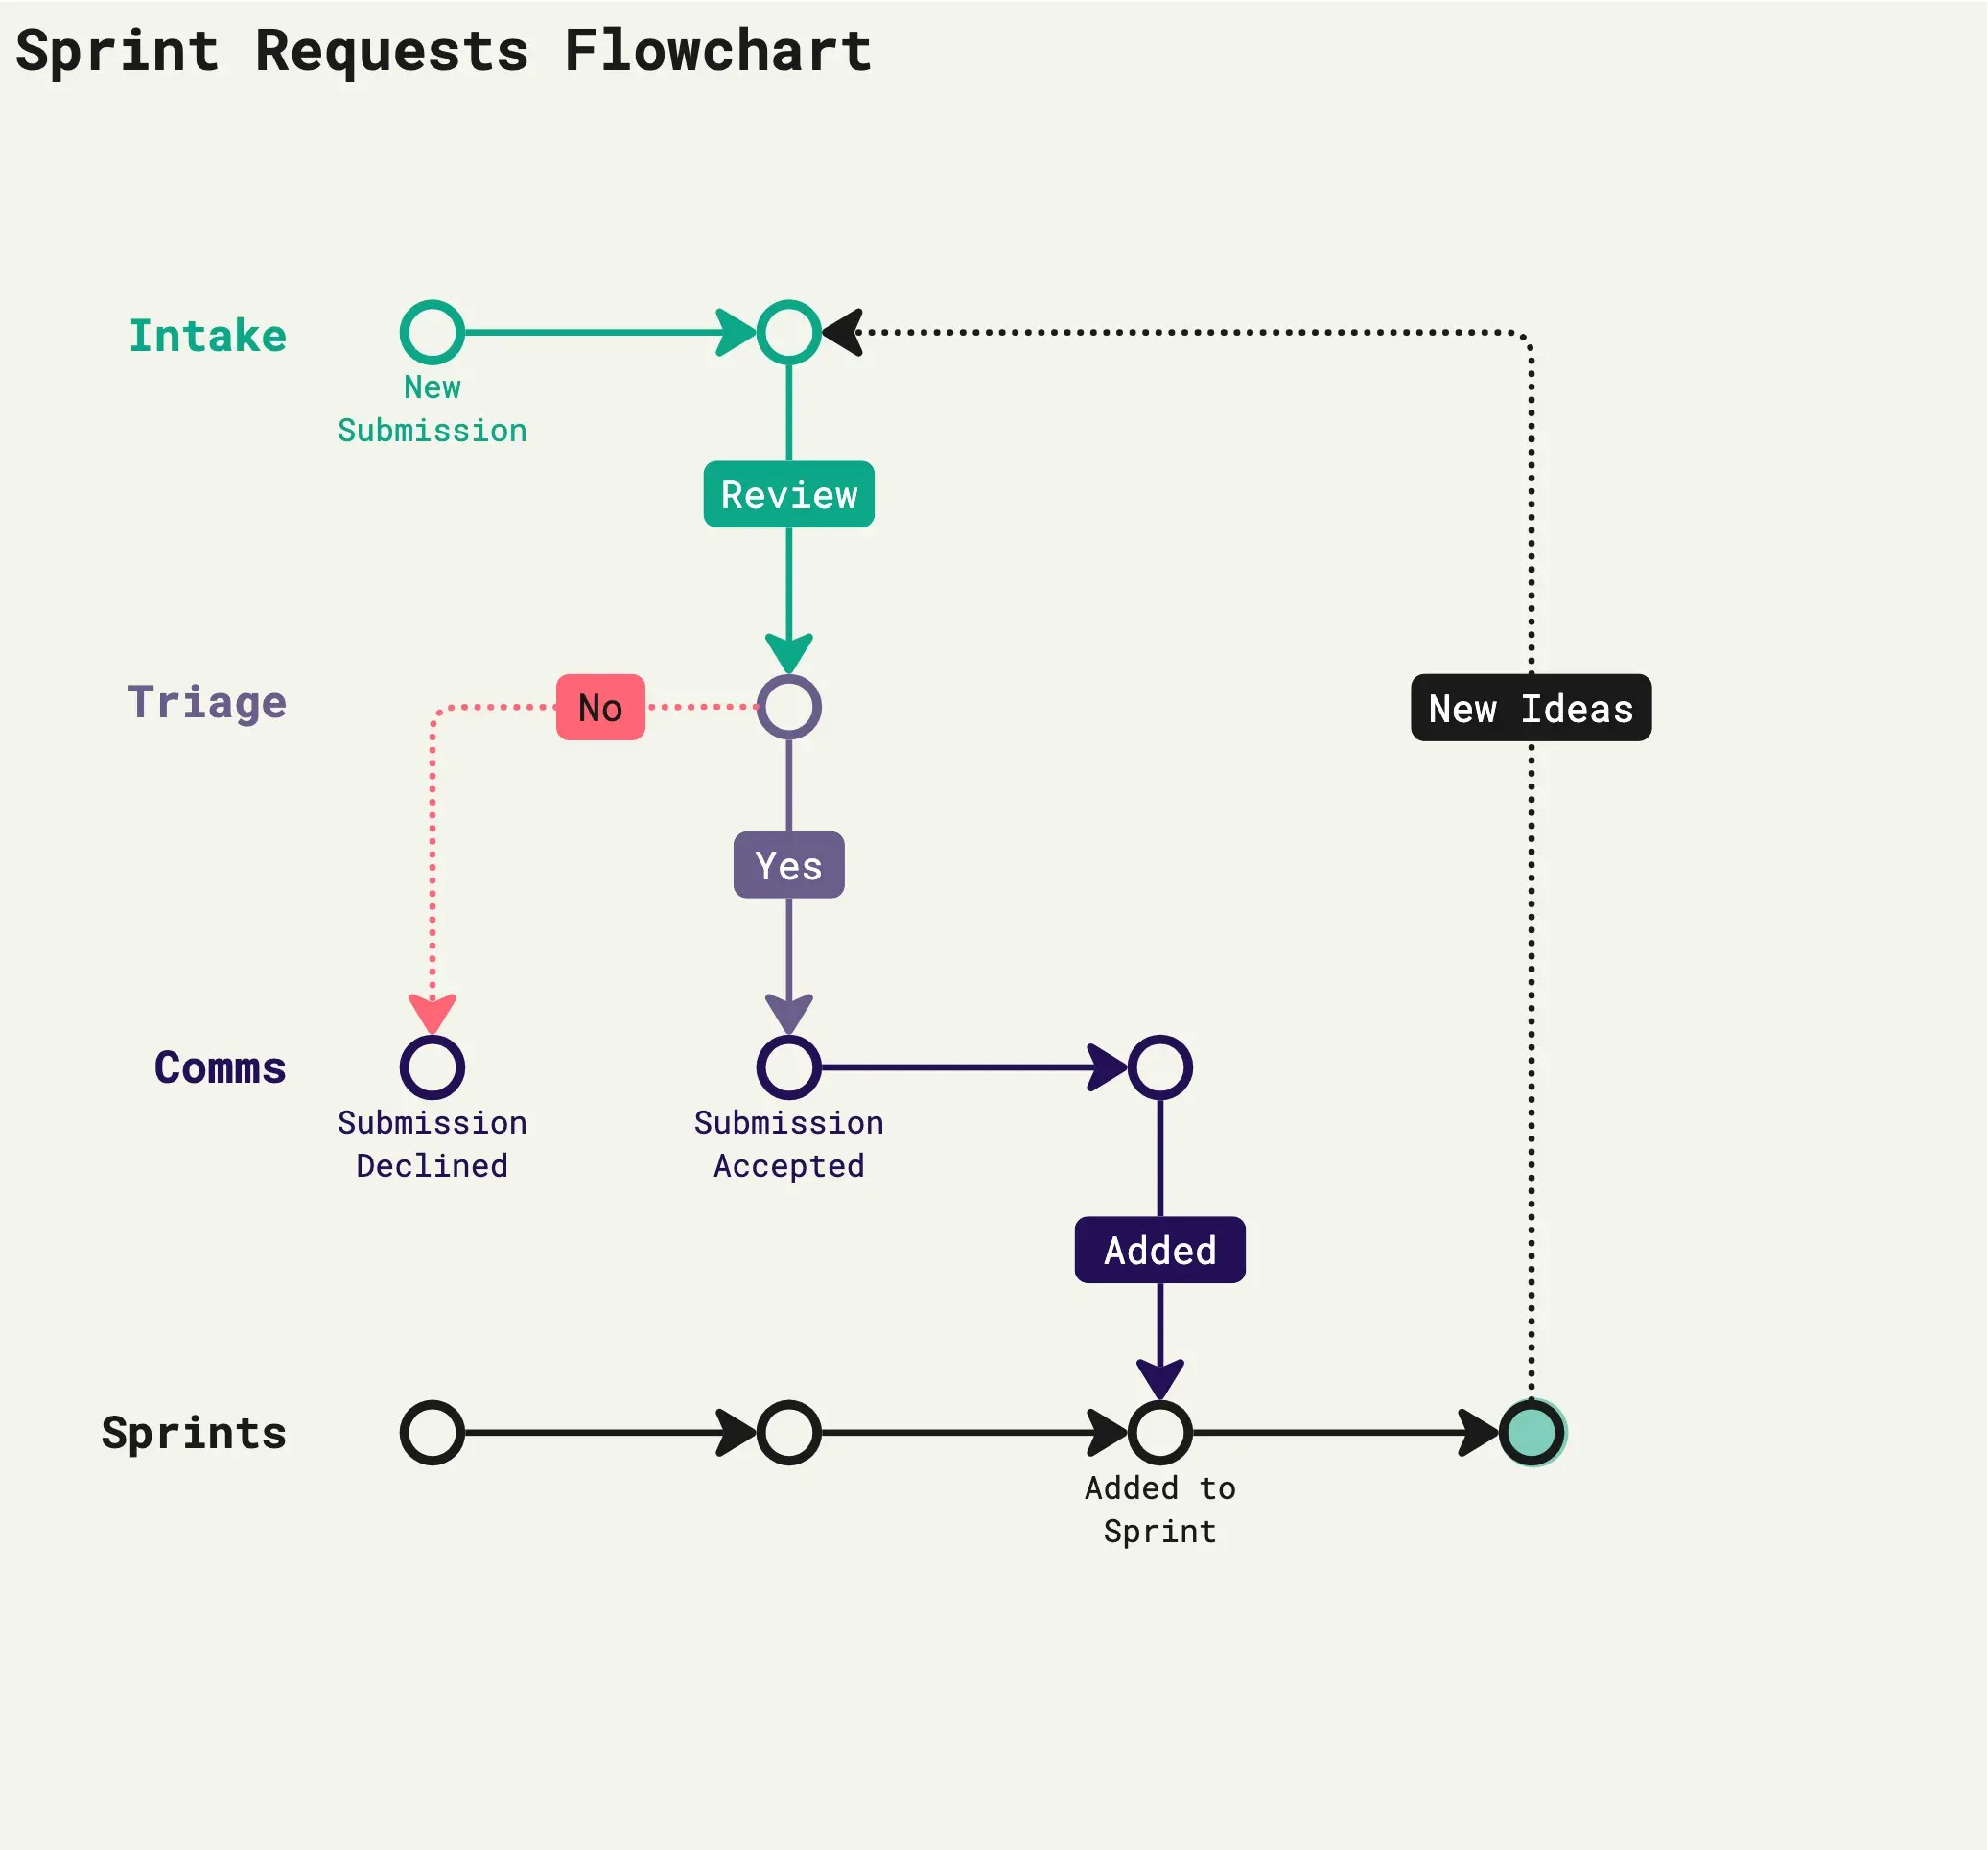
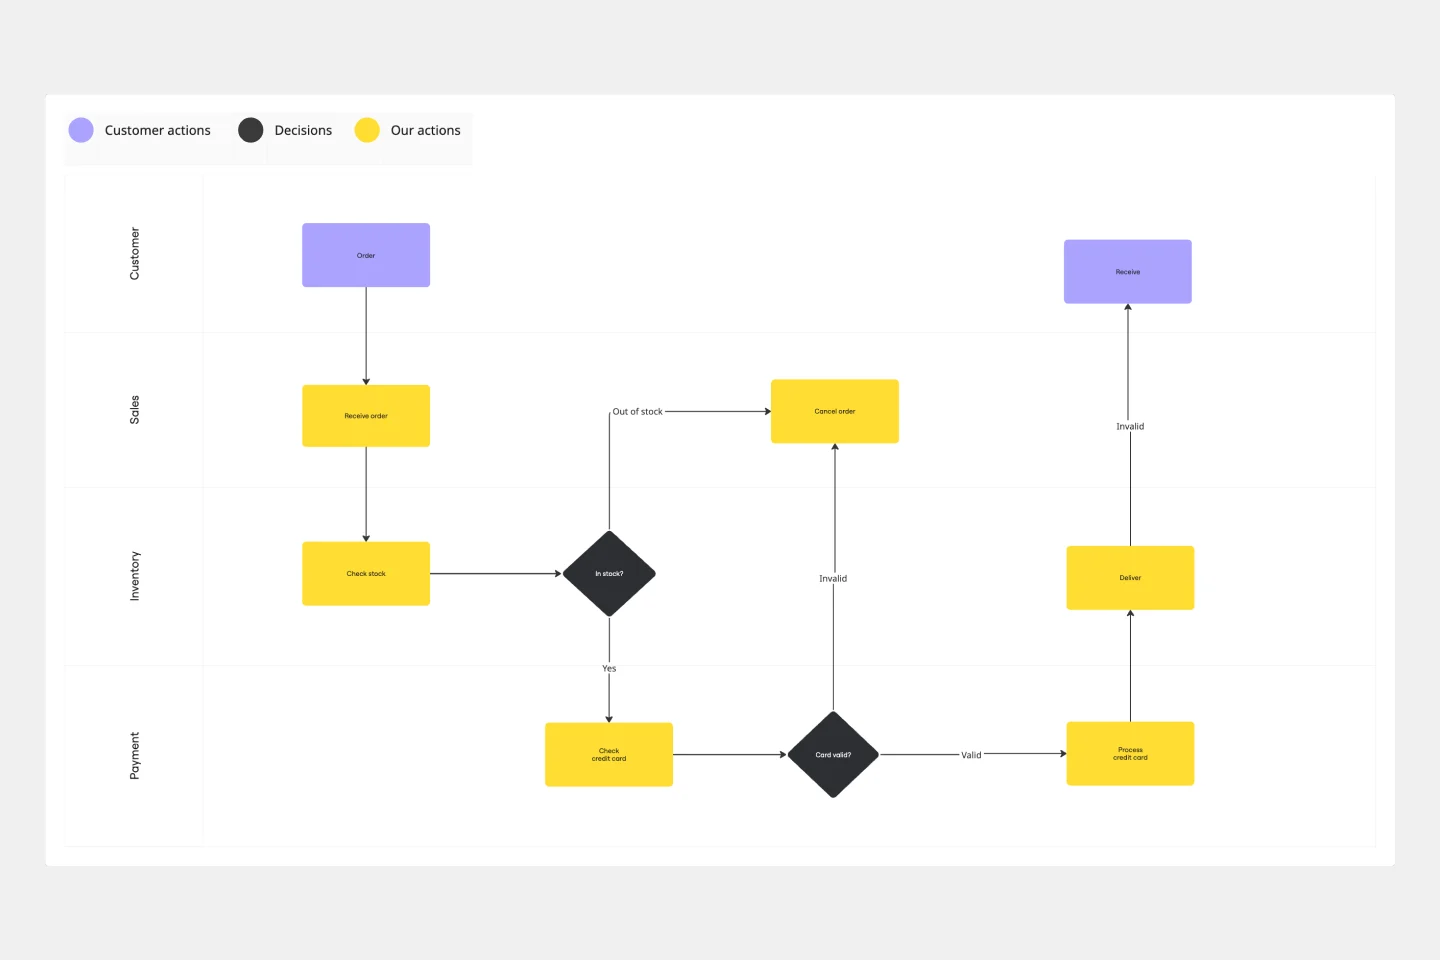
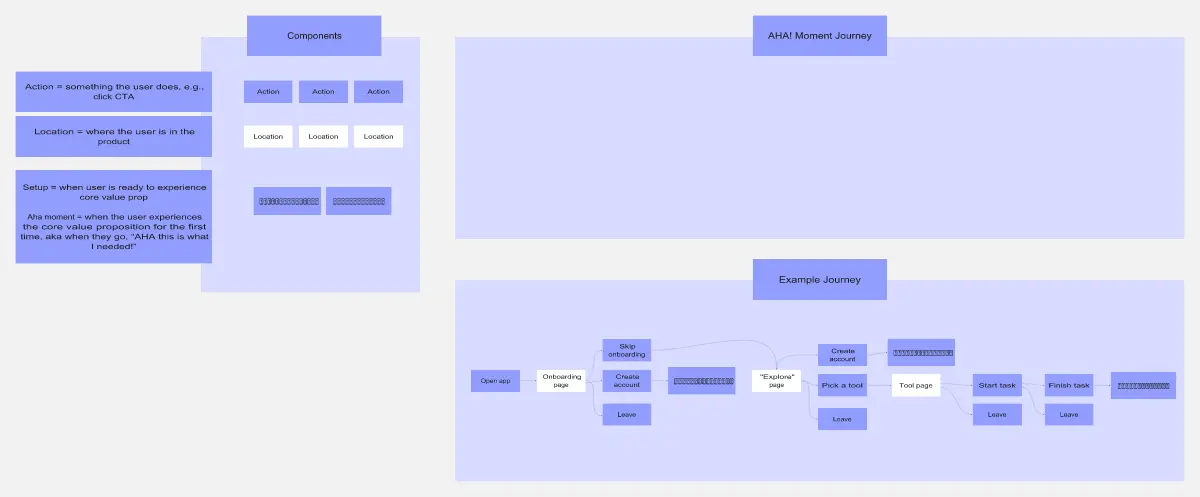
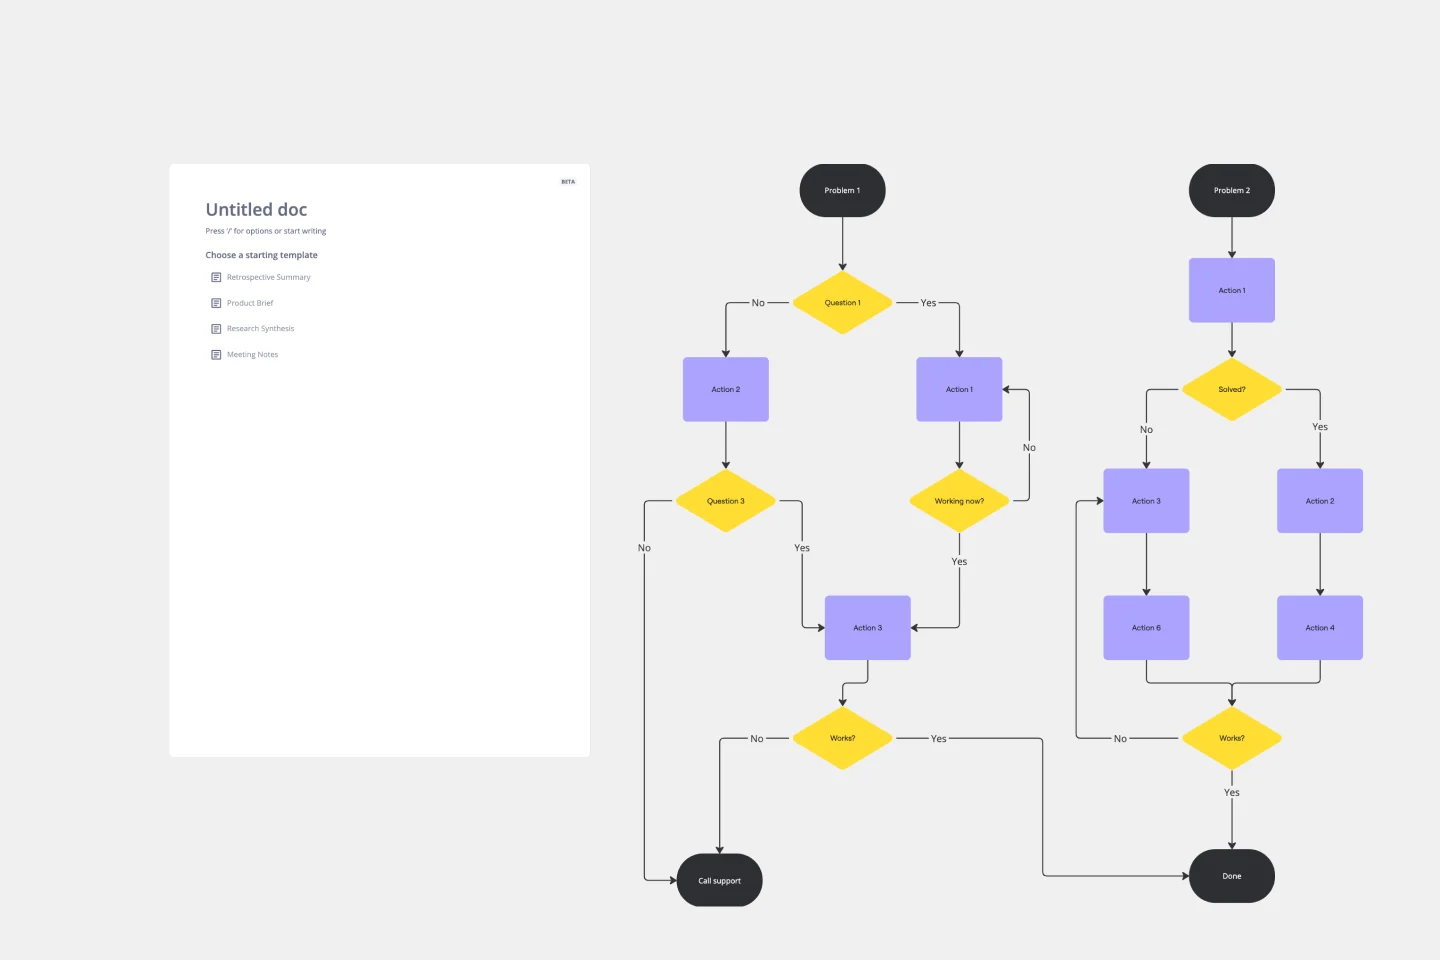
Logic Stress-Testing: Use a workflow chart template to simulate "if/then" scenarios in your customer journey. Identifying a logic gap in a flowchart is significantly cheaper than fixing a broken user experience post-launch.
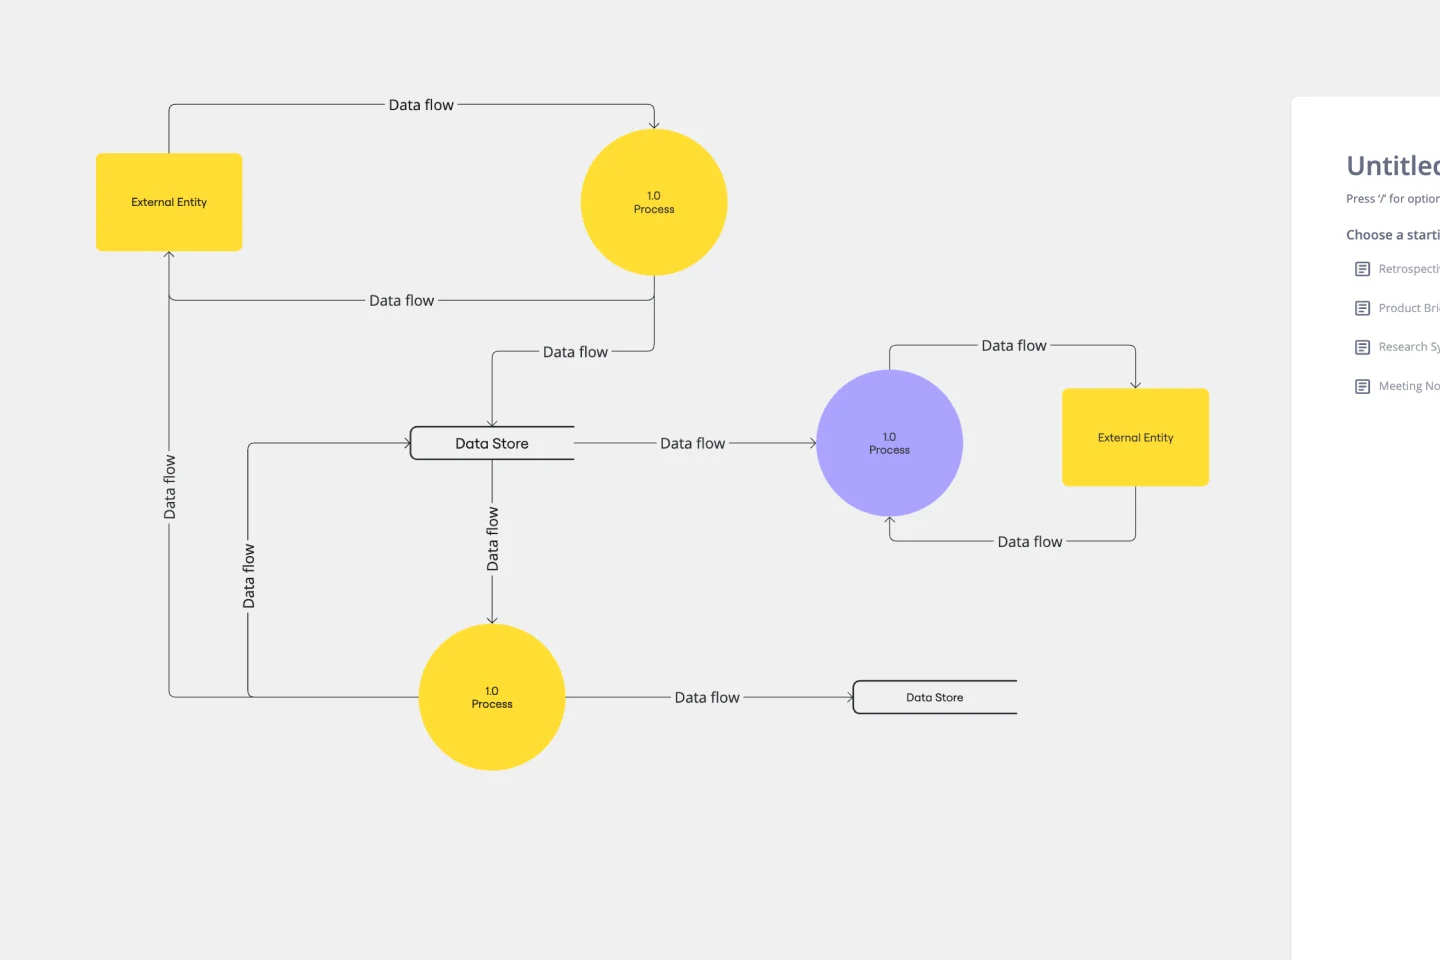
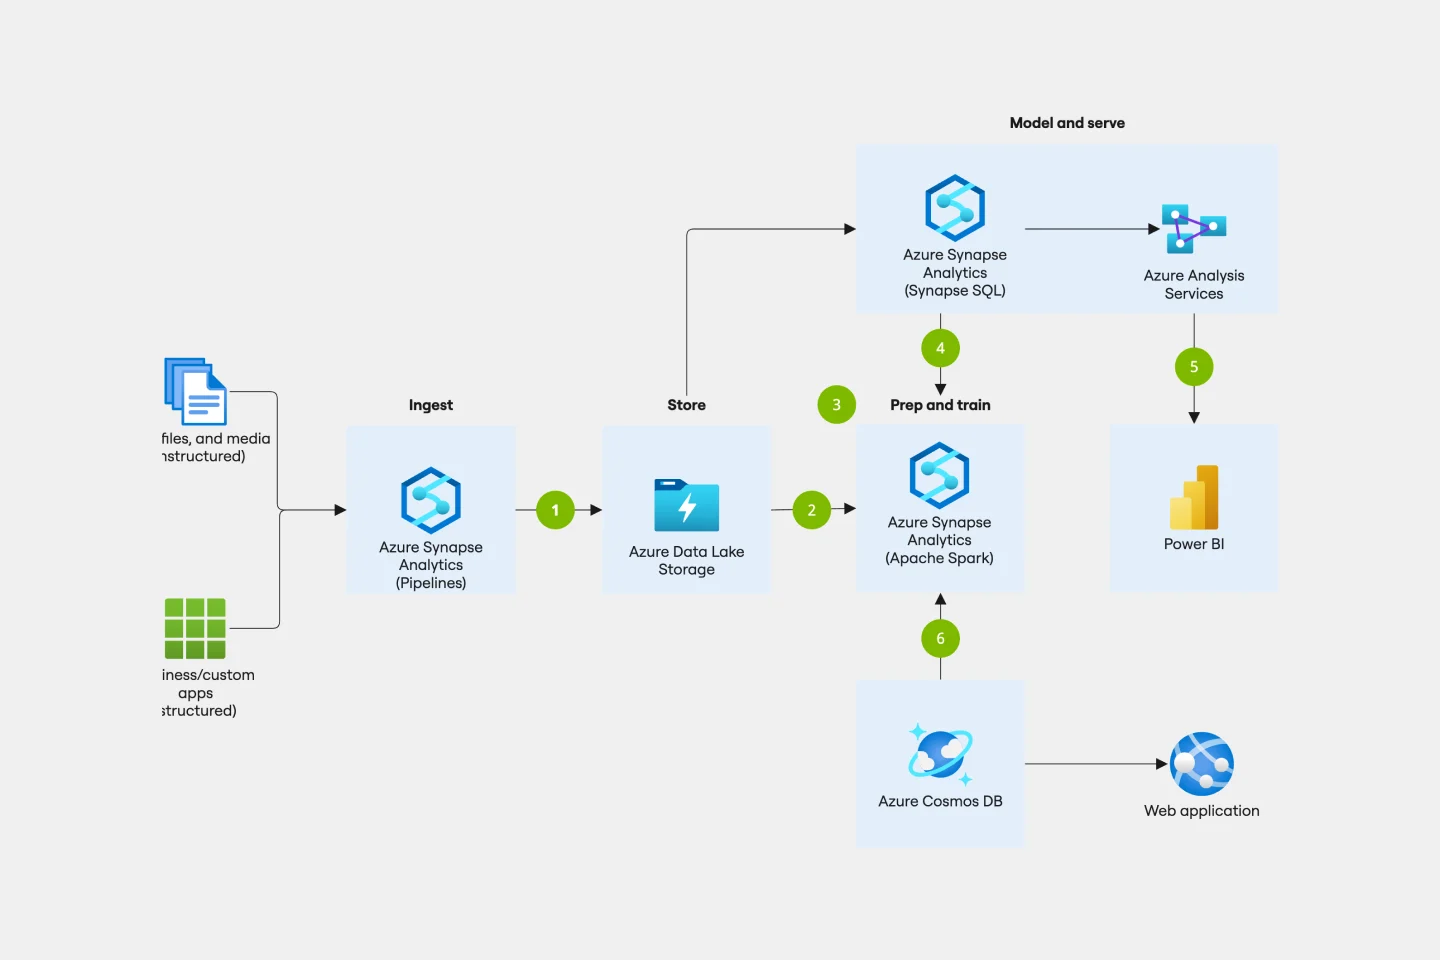
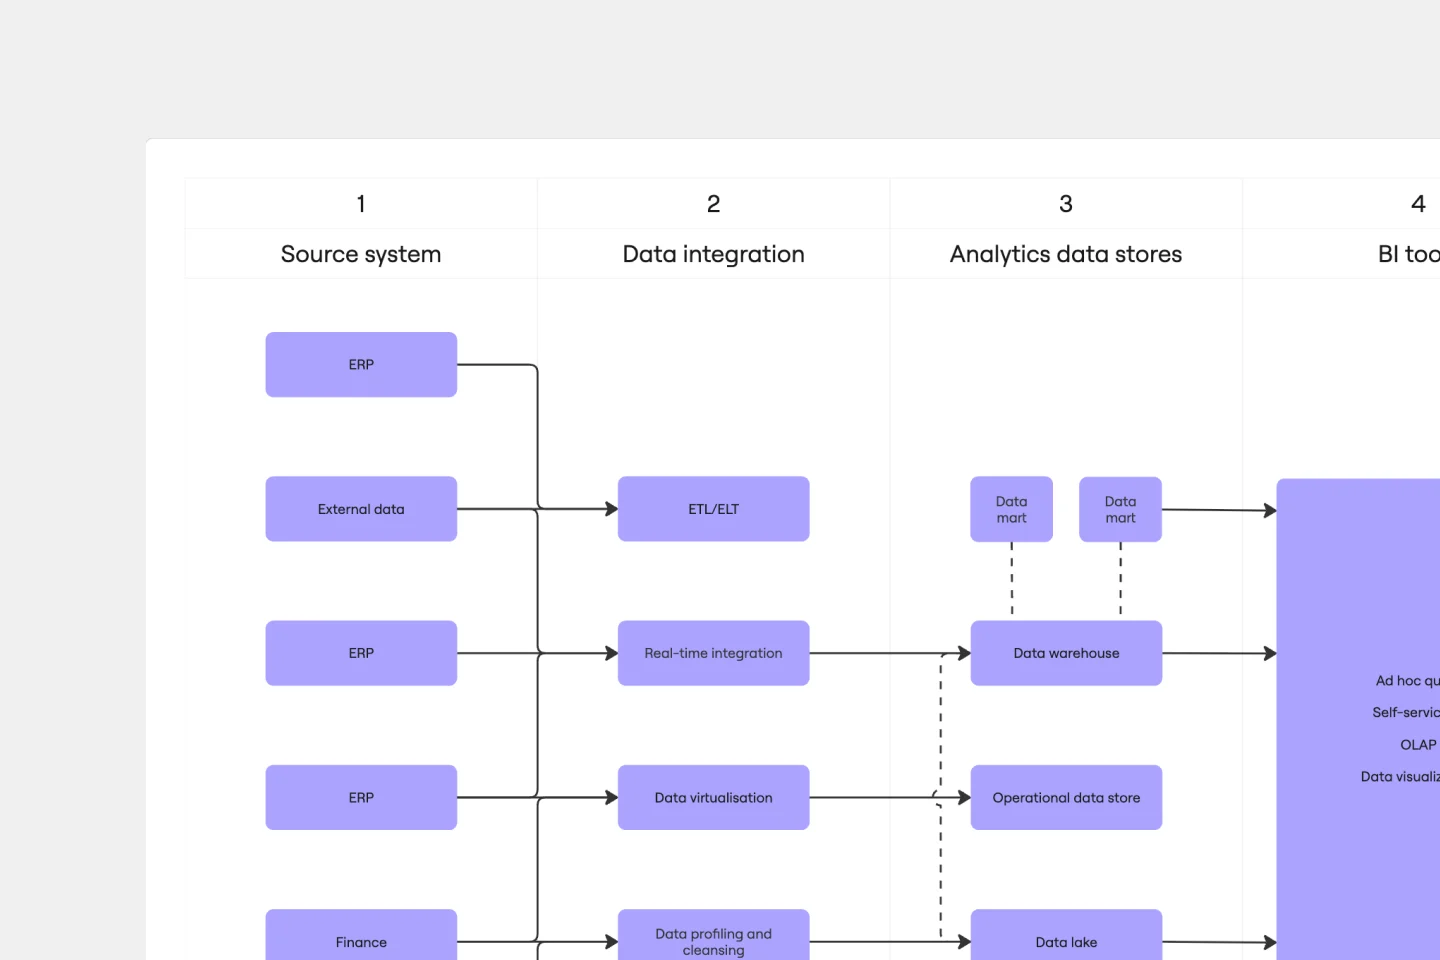
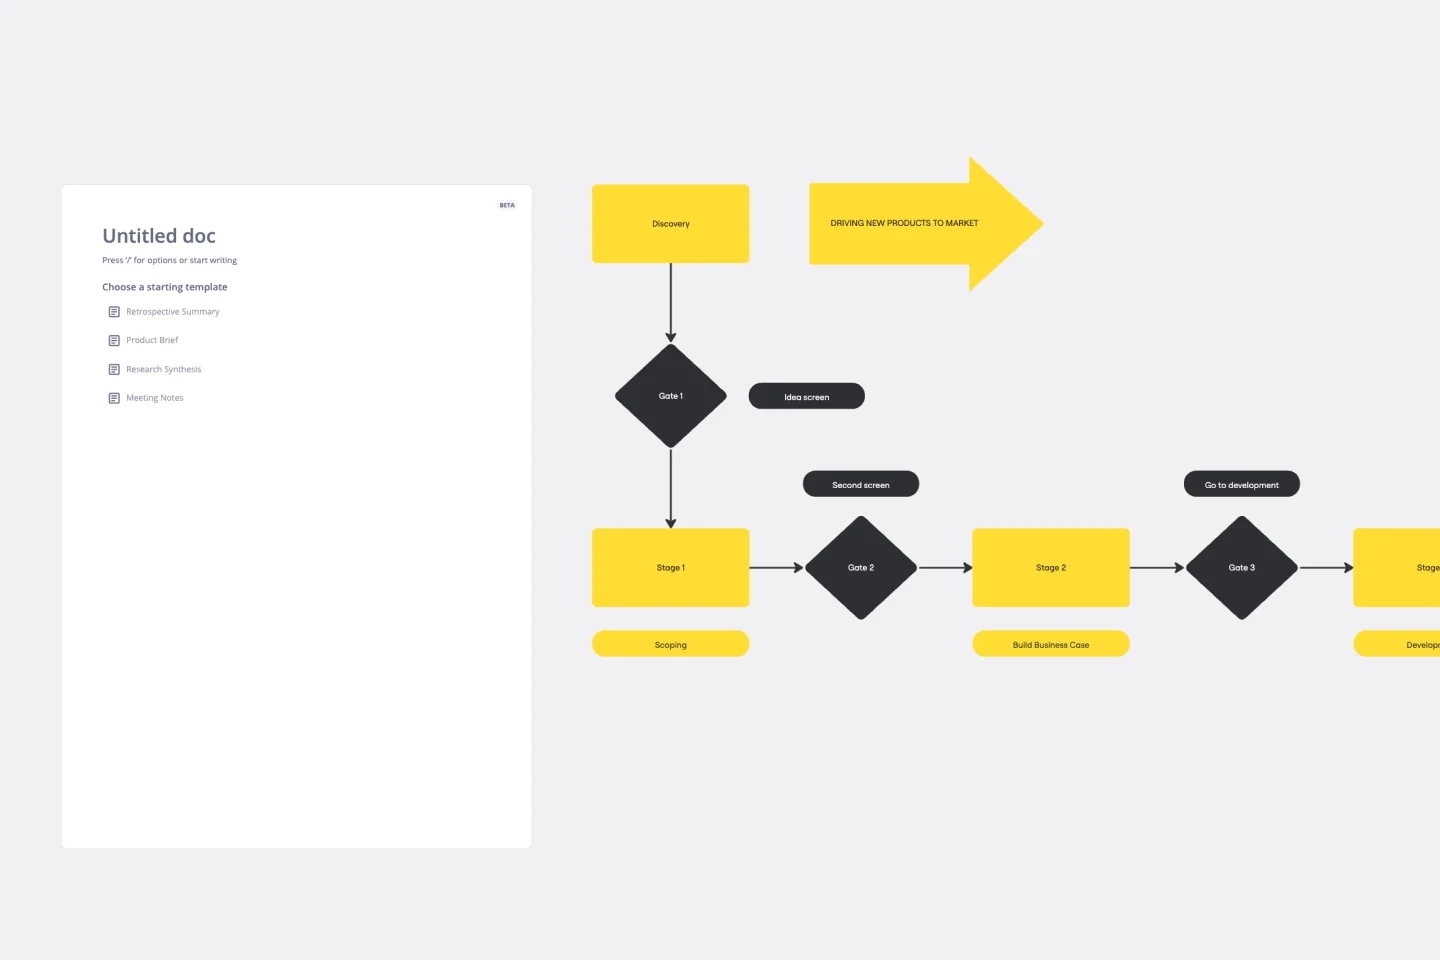
Technical Debt Visualization: Map your current state vs. your future state. Use flowchart templates to visualize legacy system dependencies, helping your engineering team prioritize refactoring efforts.
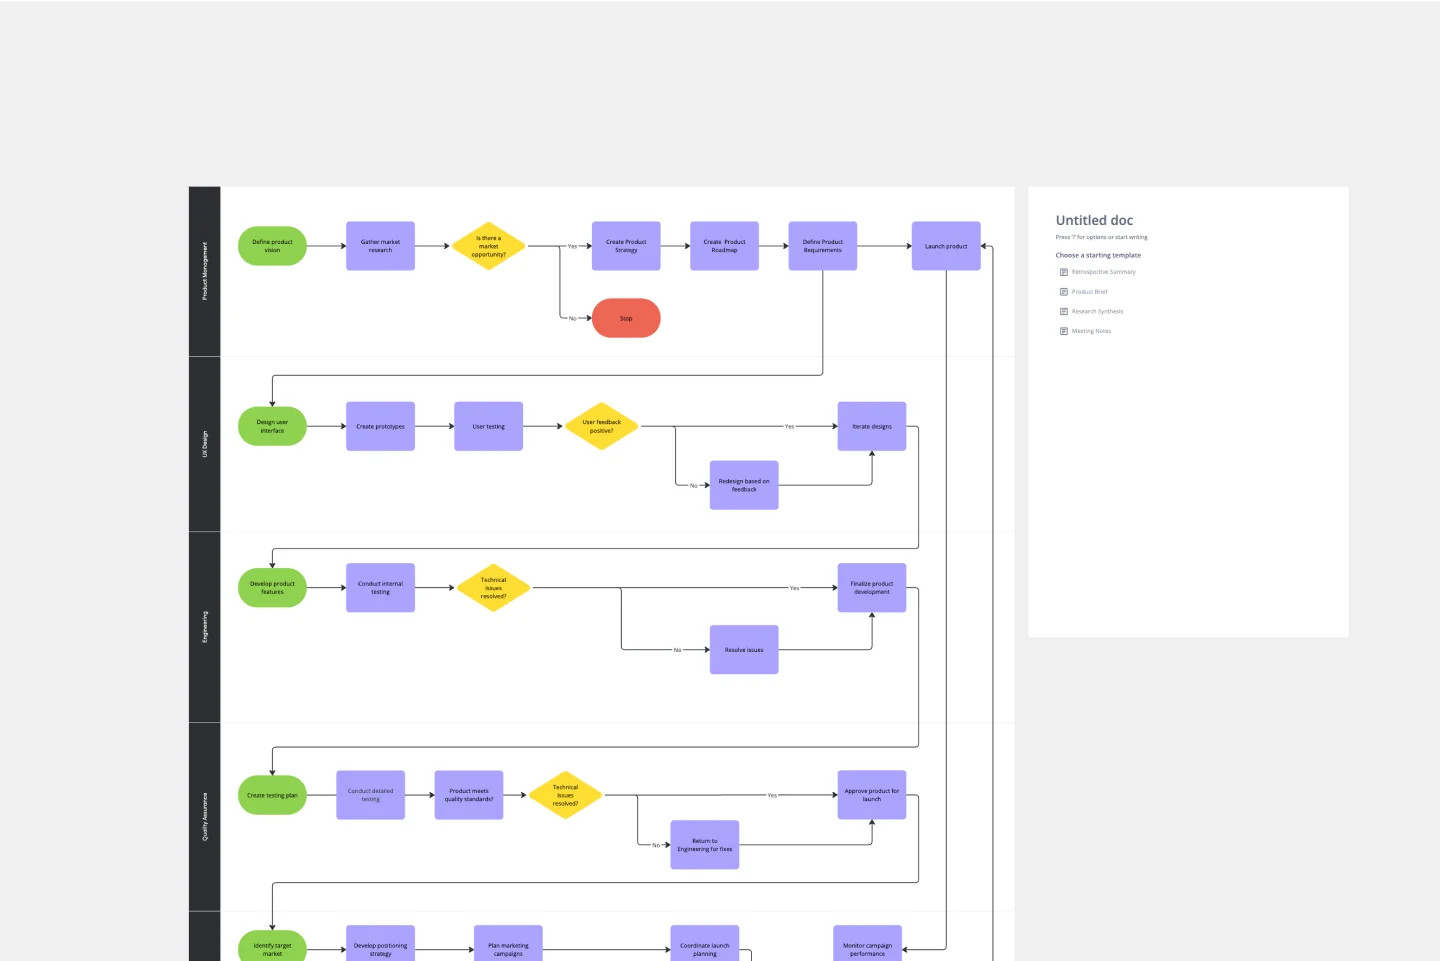
Compliance & Audit Readiness: Create a single source of truth for standard operating procedures (SOPs). Our flowchart templates serve as "audit-ready" documentation that ensures every team member follows the same verified path.
How to Architect Your Flowcharts in Miro
Whether you're defining a simple process or a complex system, our flowchart templates streamline your efforts:
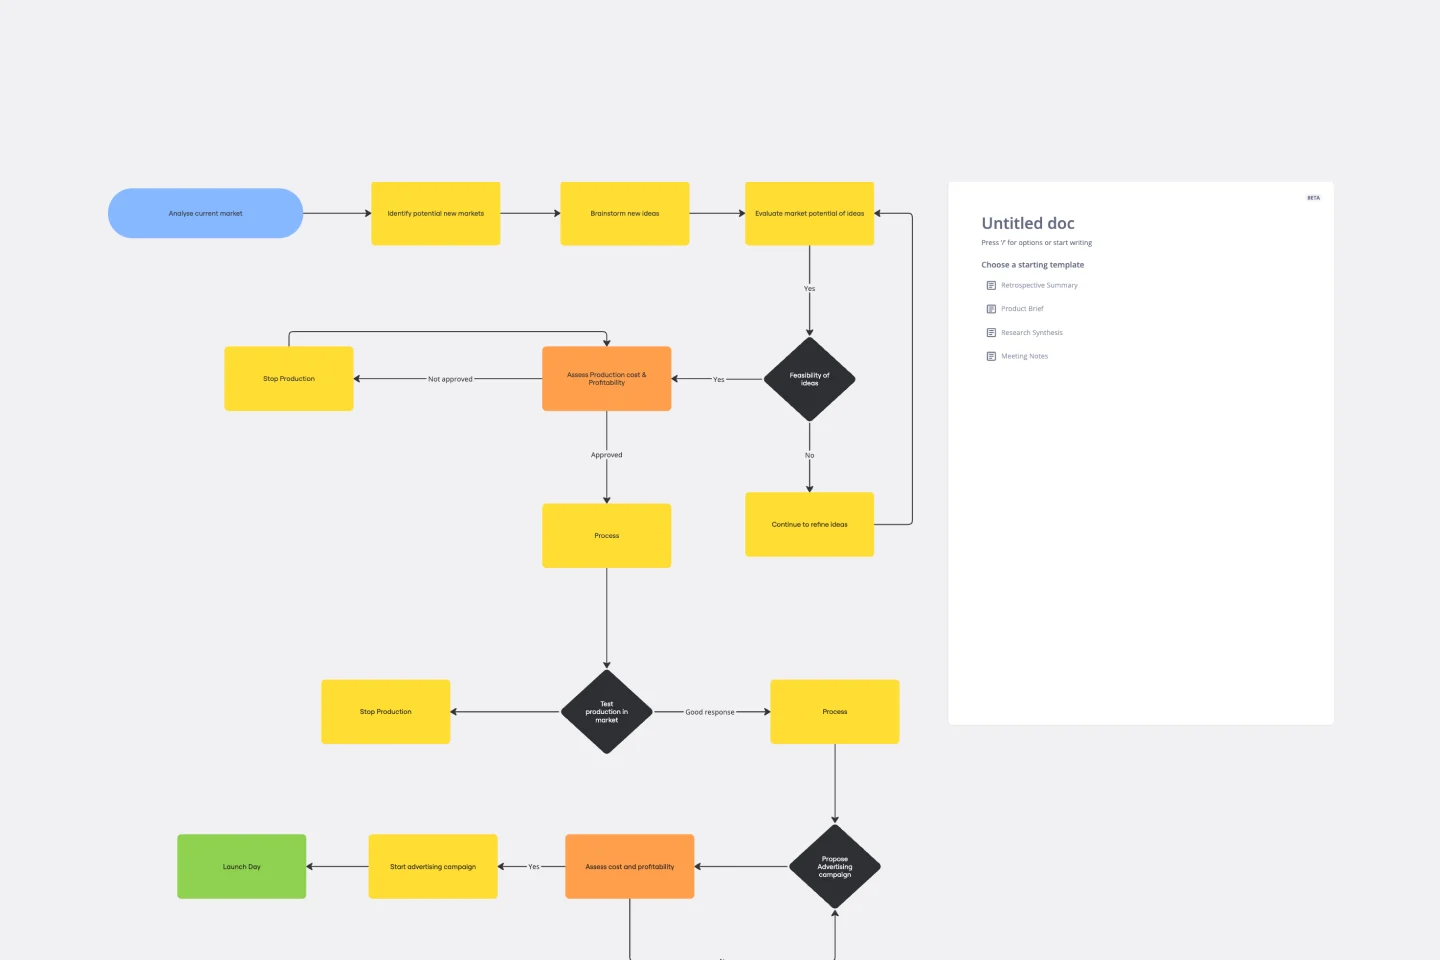
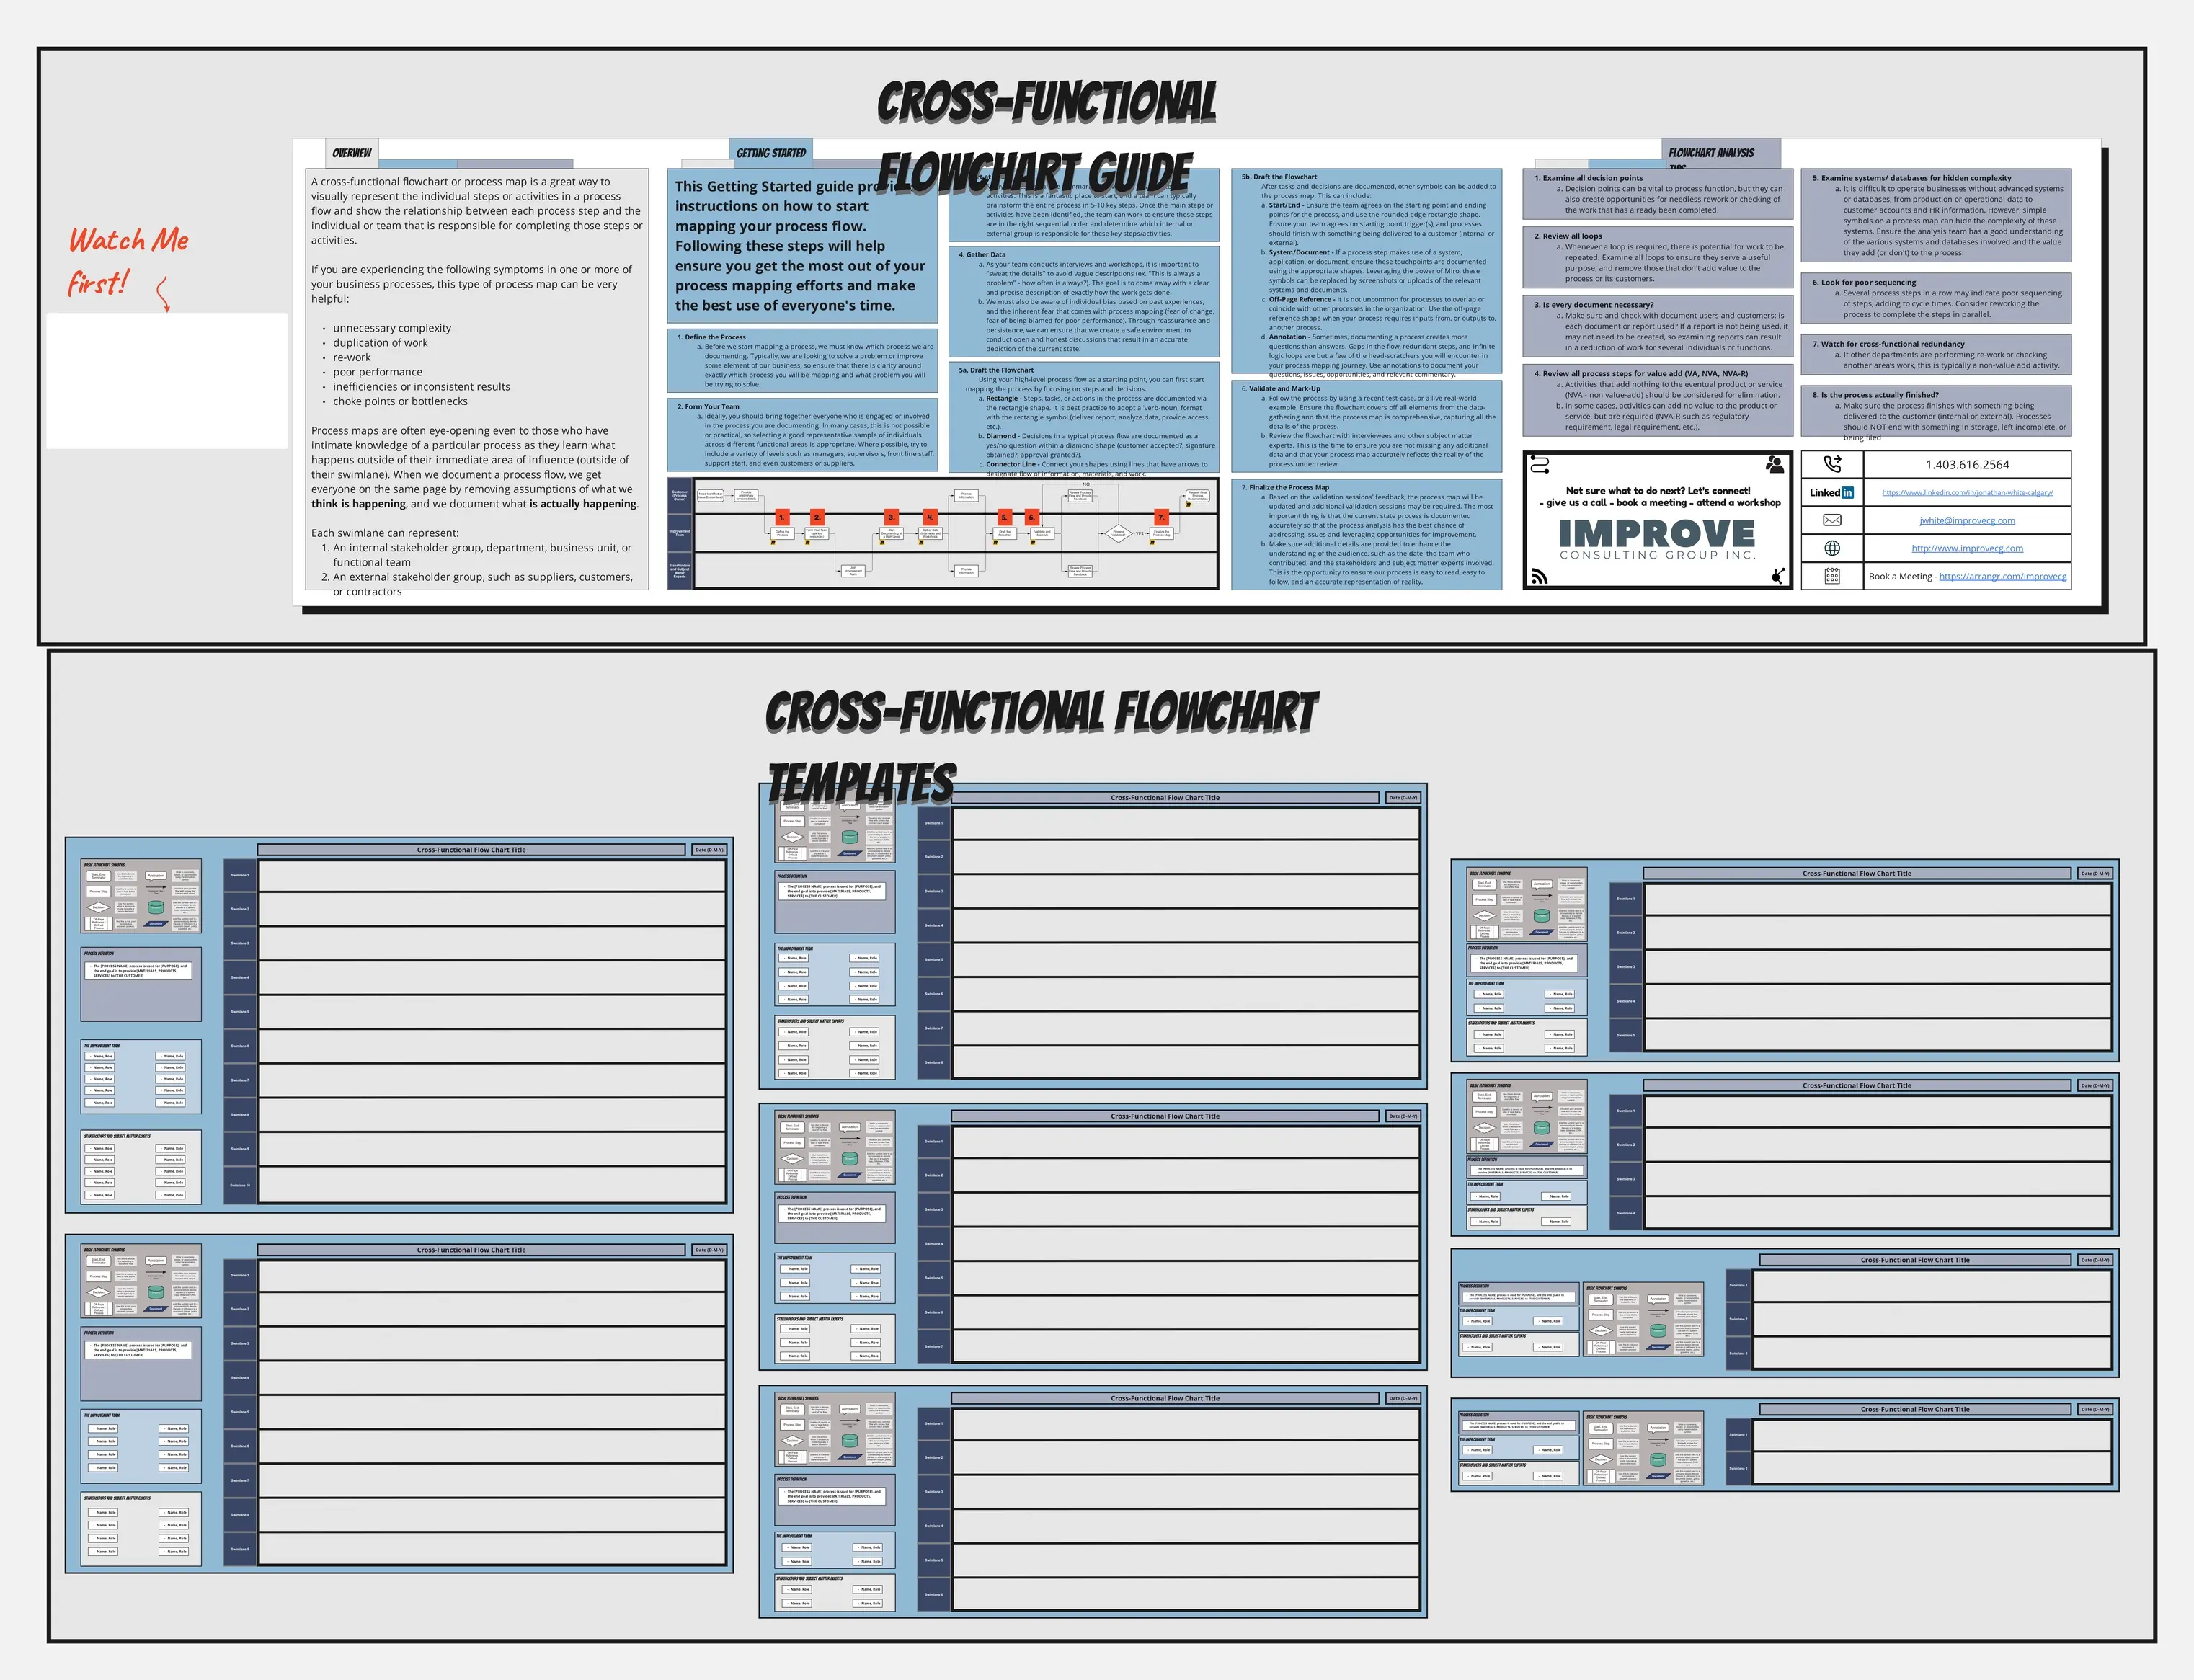
Define Your Process Goal: Before selecting a flowchart template, clearly articulate the start and end points. What problem does this process solve, or what outcome does it achieve? This clarity guides your symbol usage.
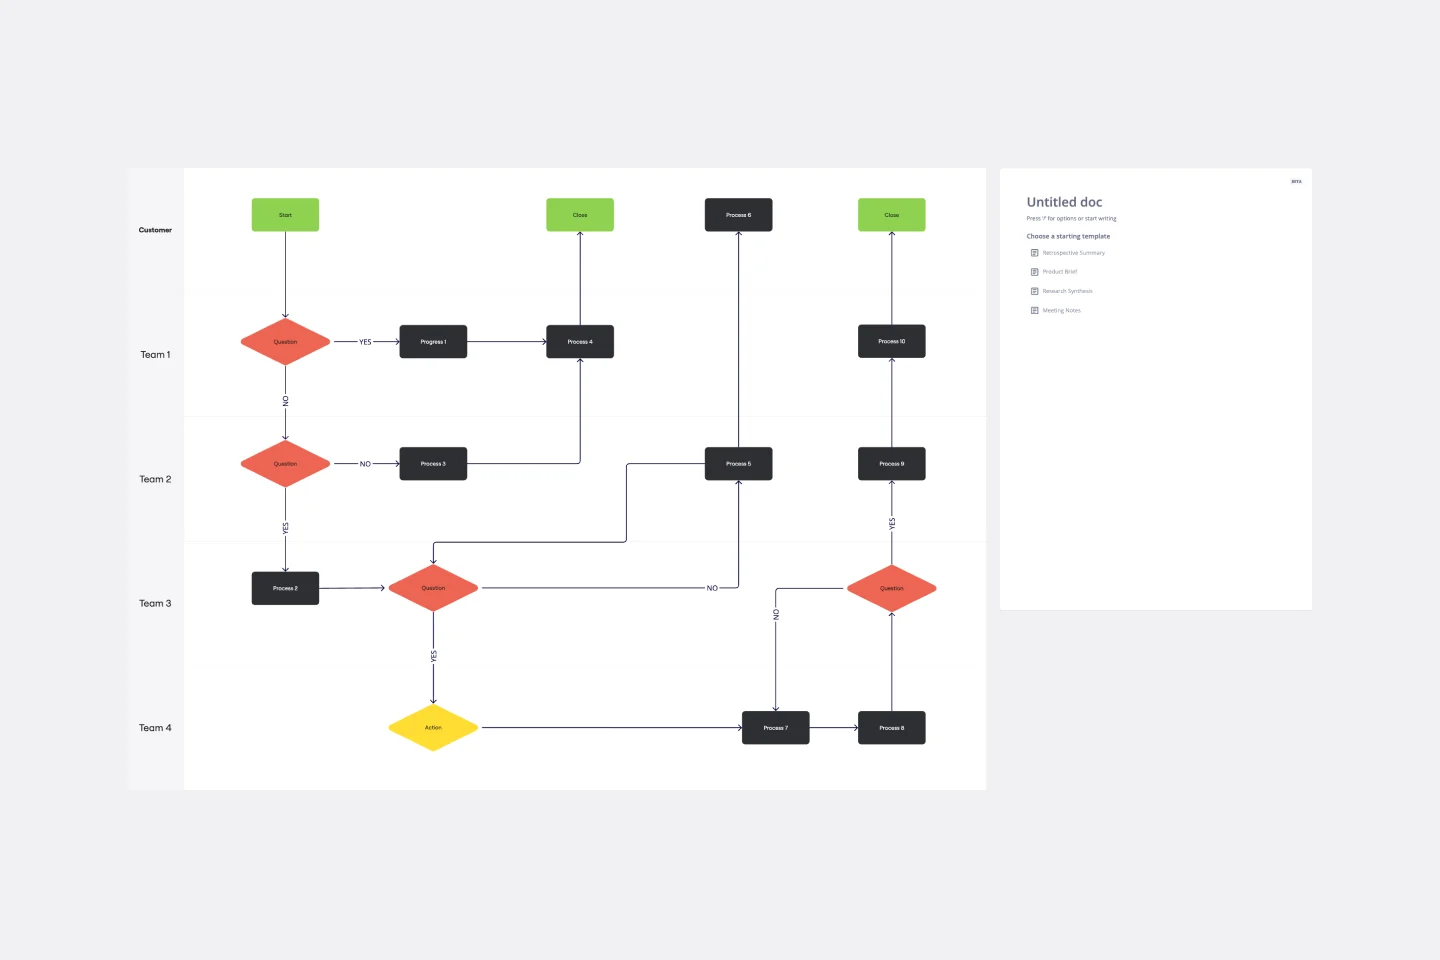
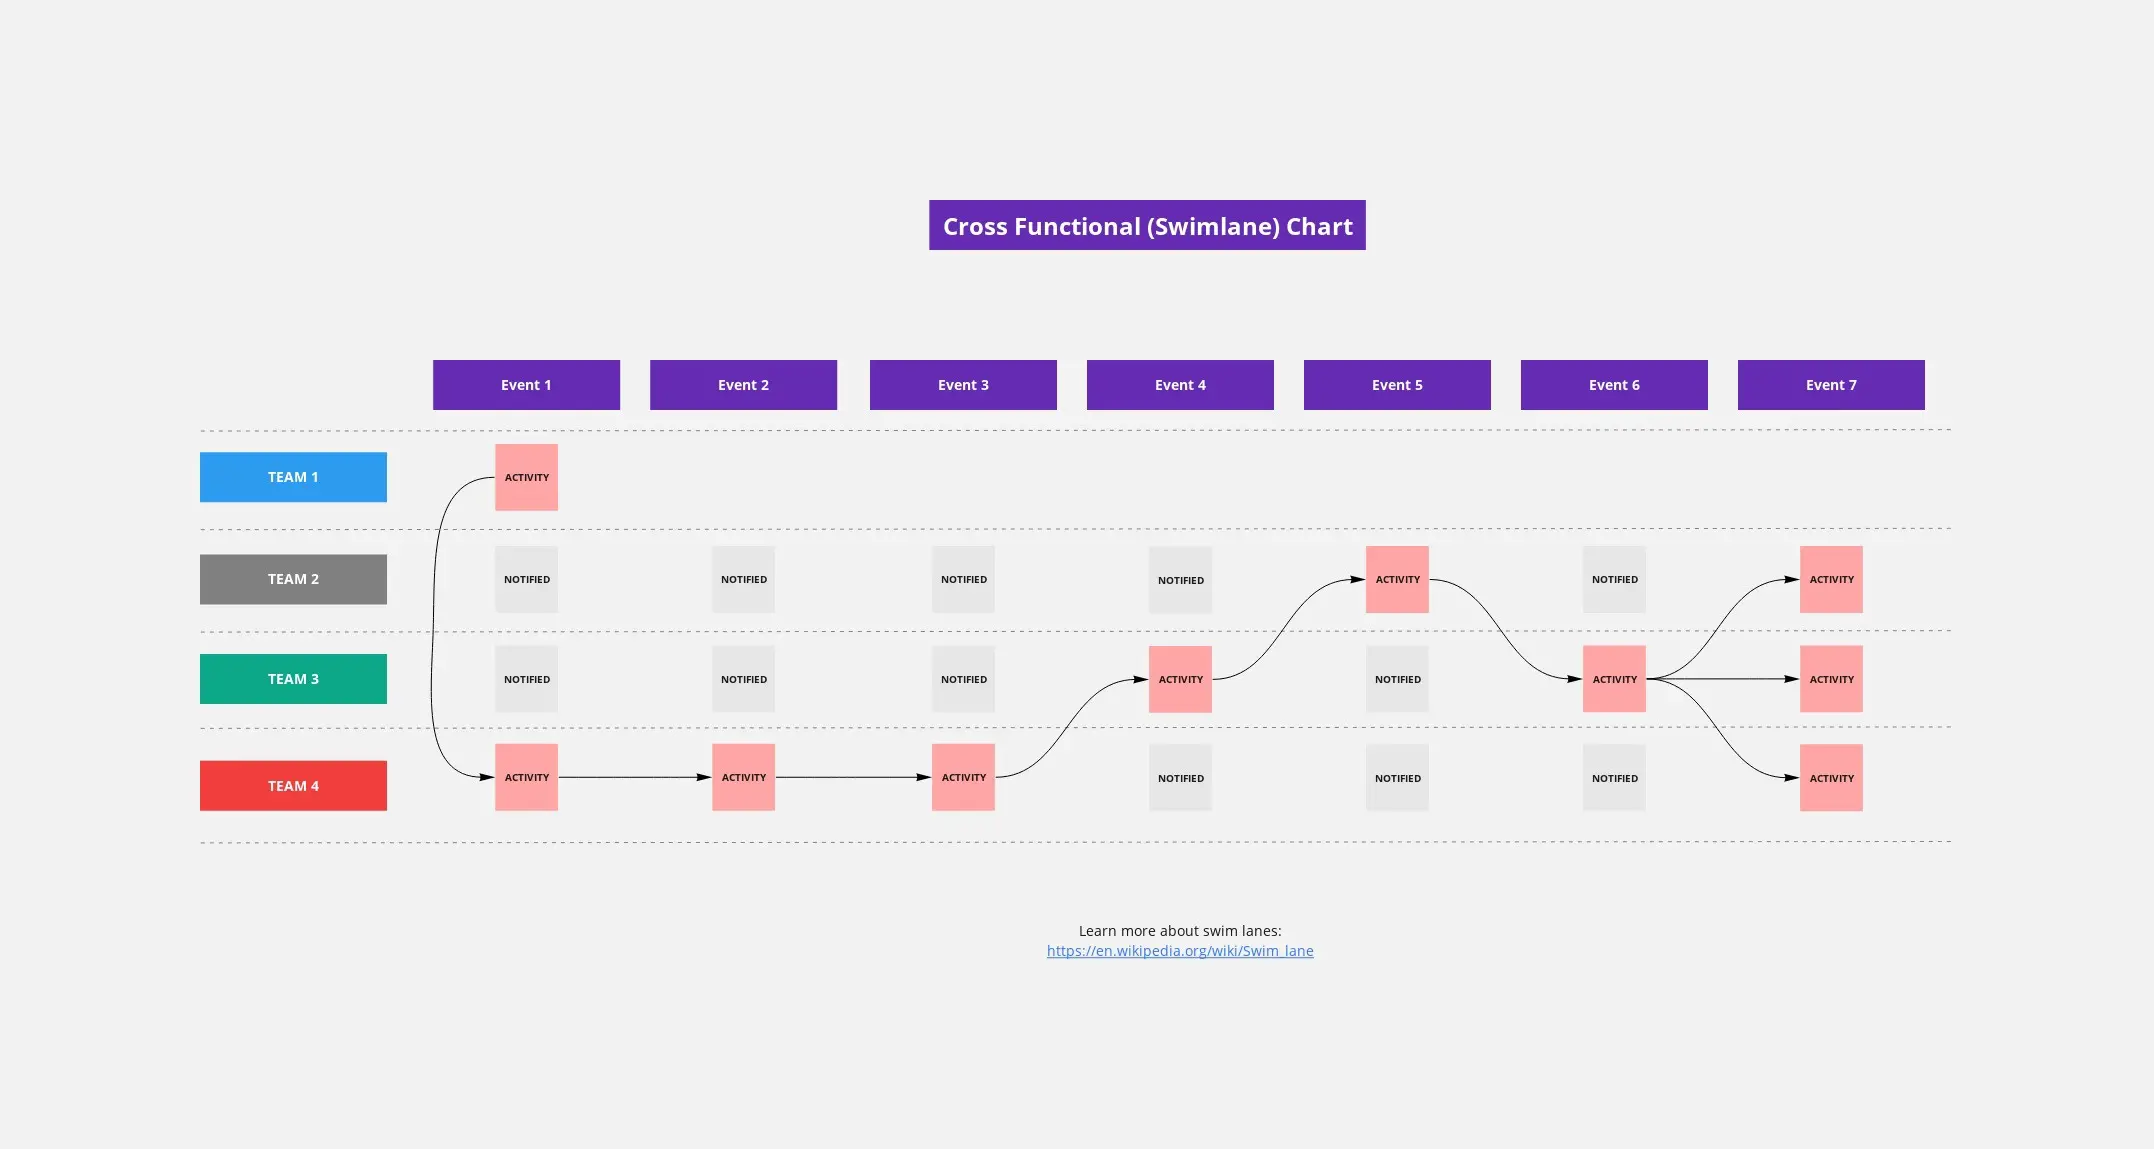
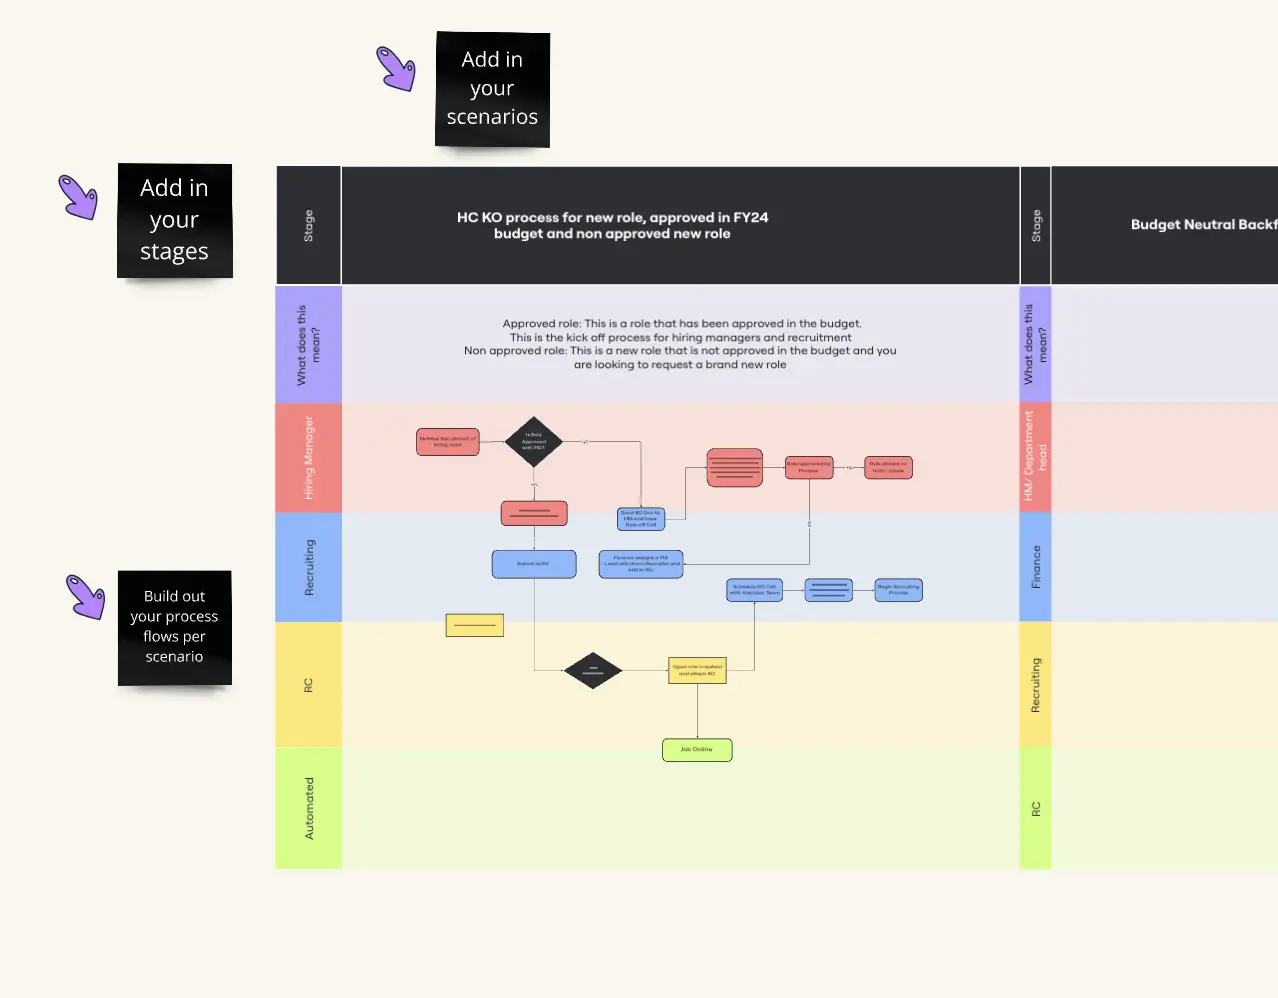
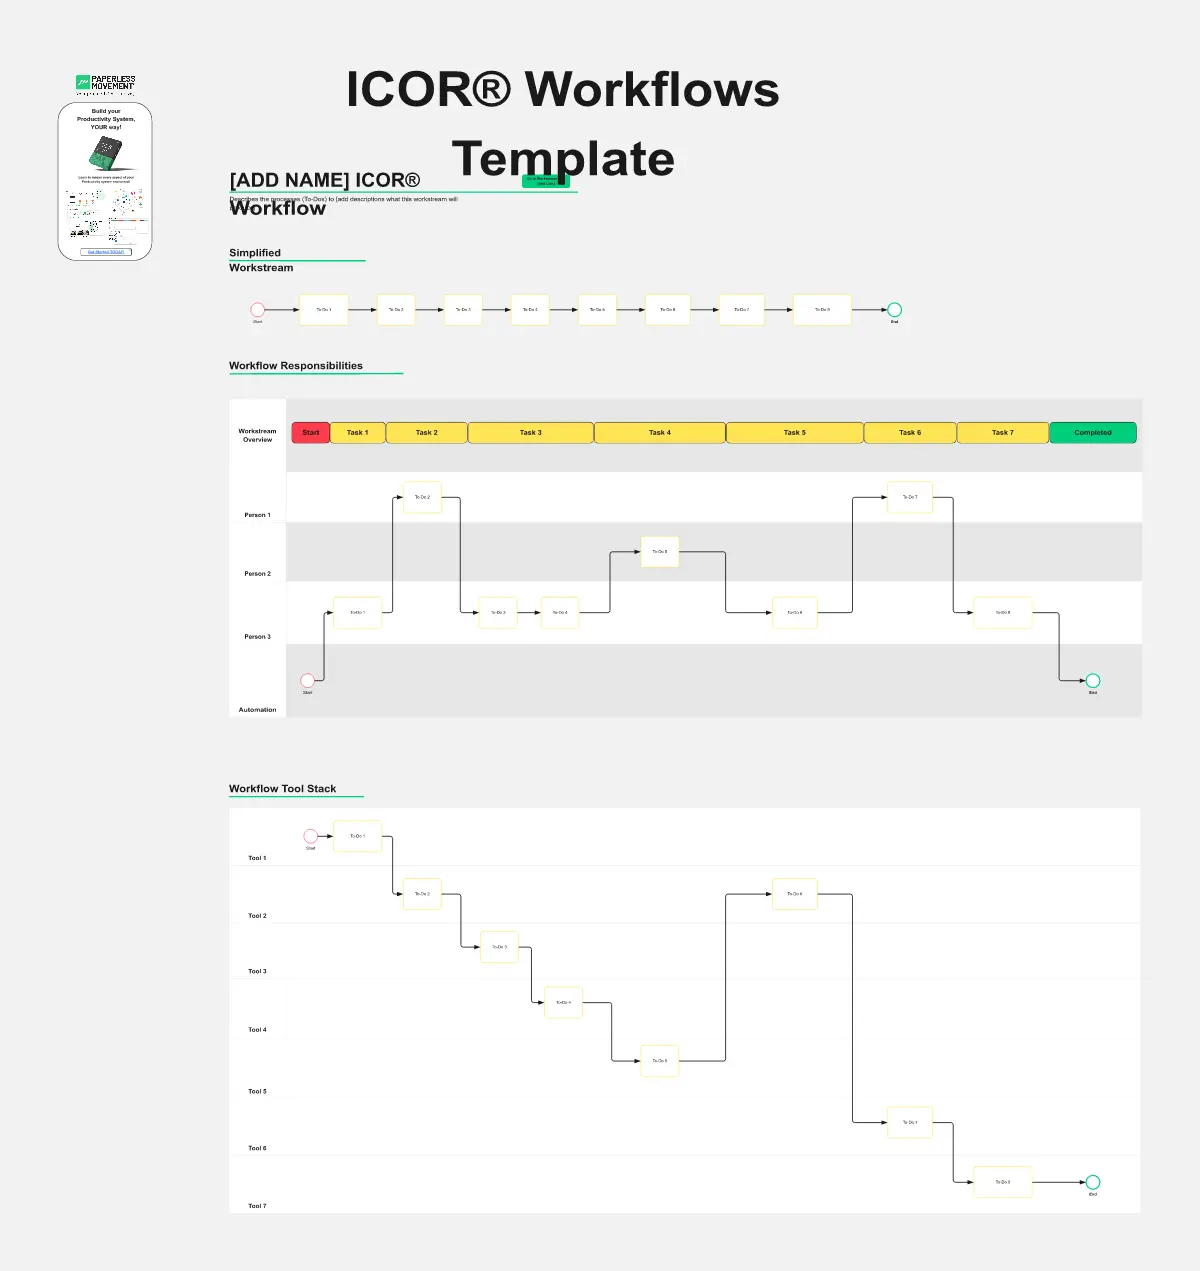
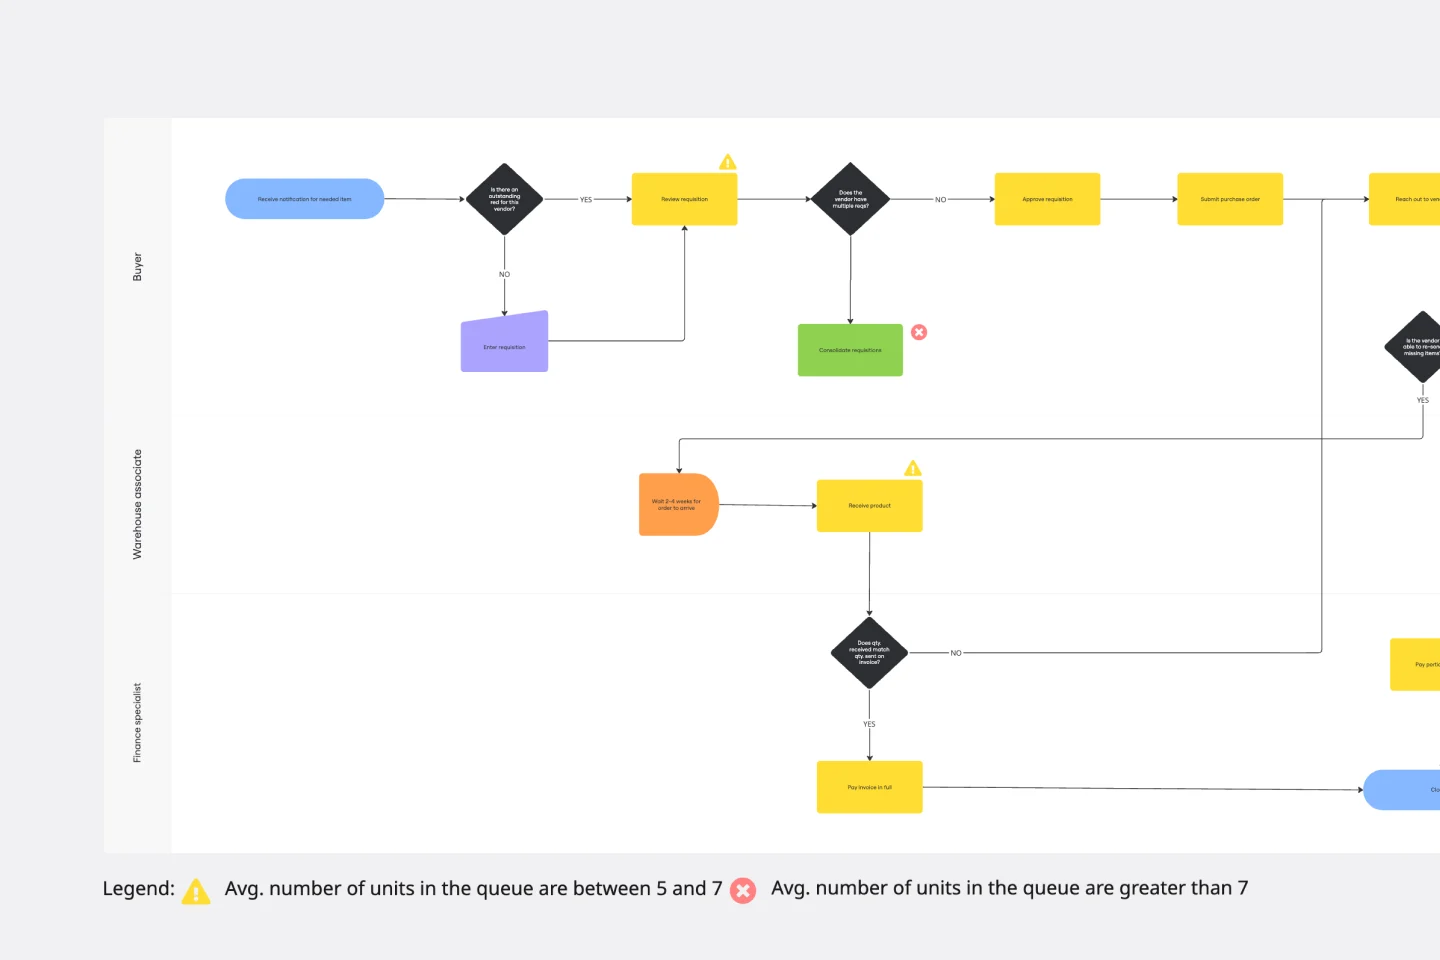
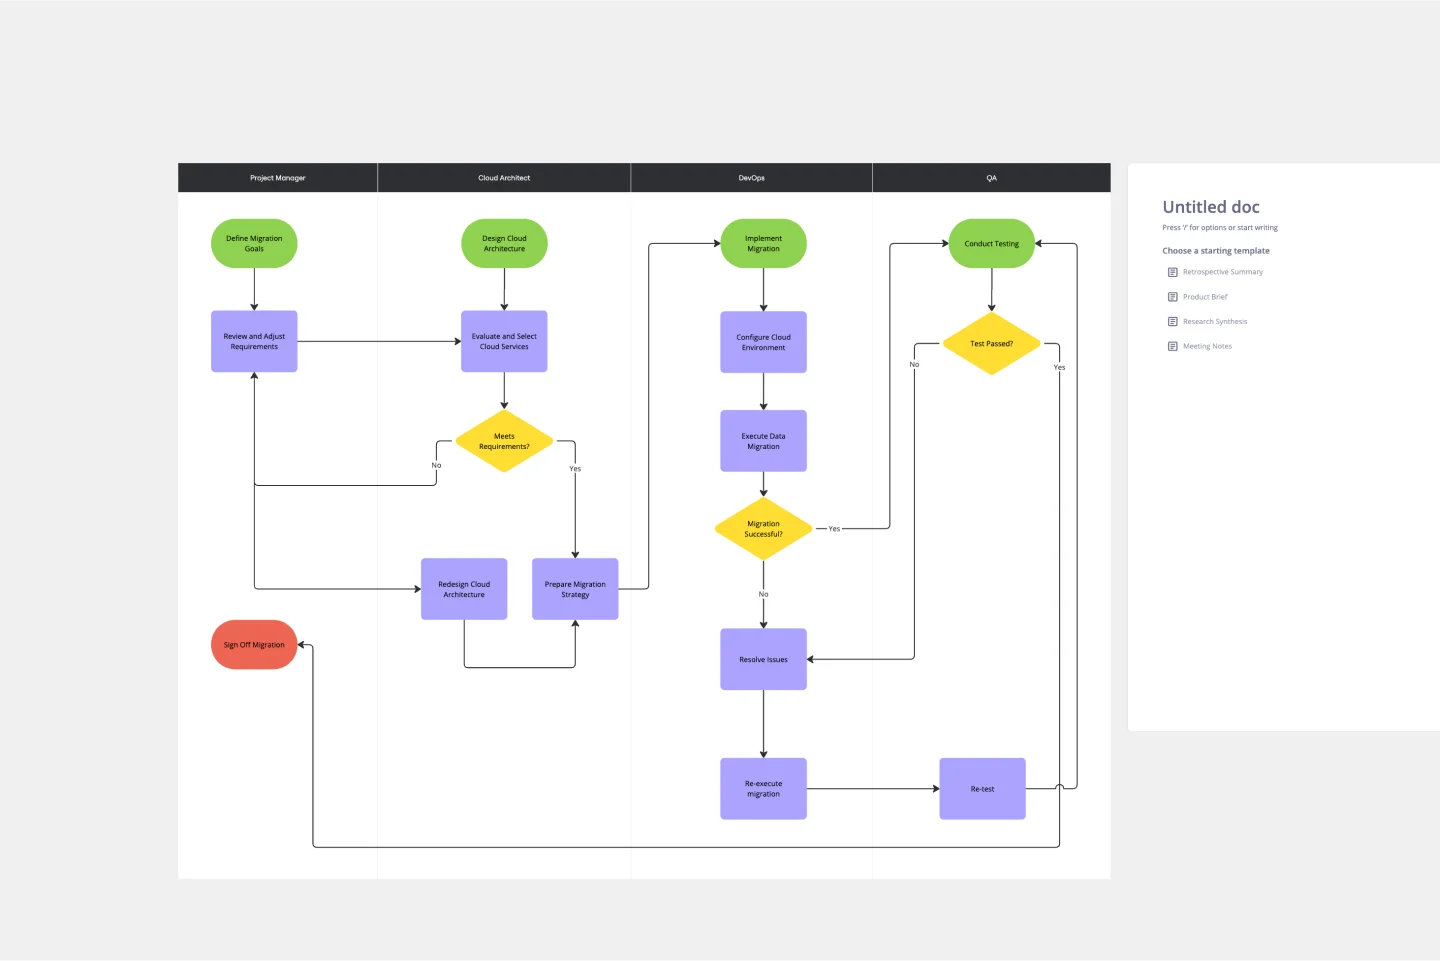
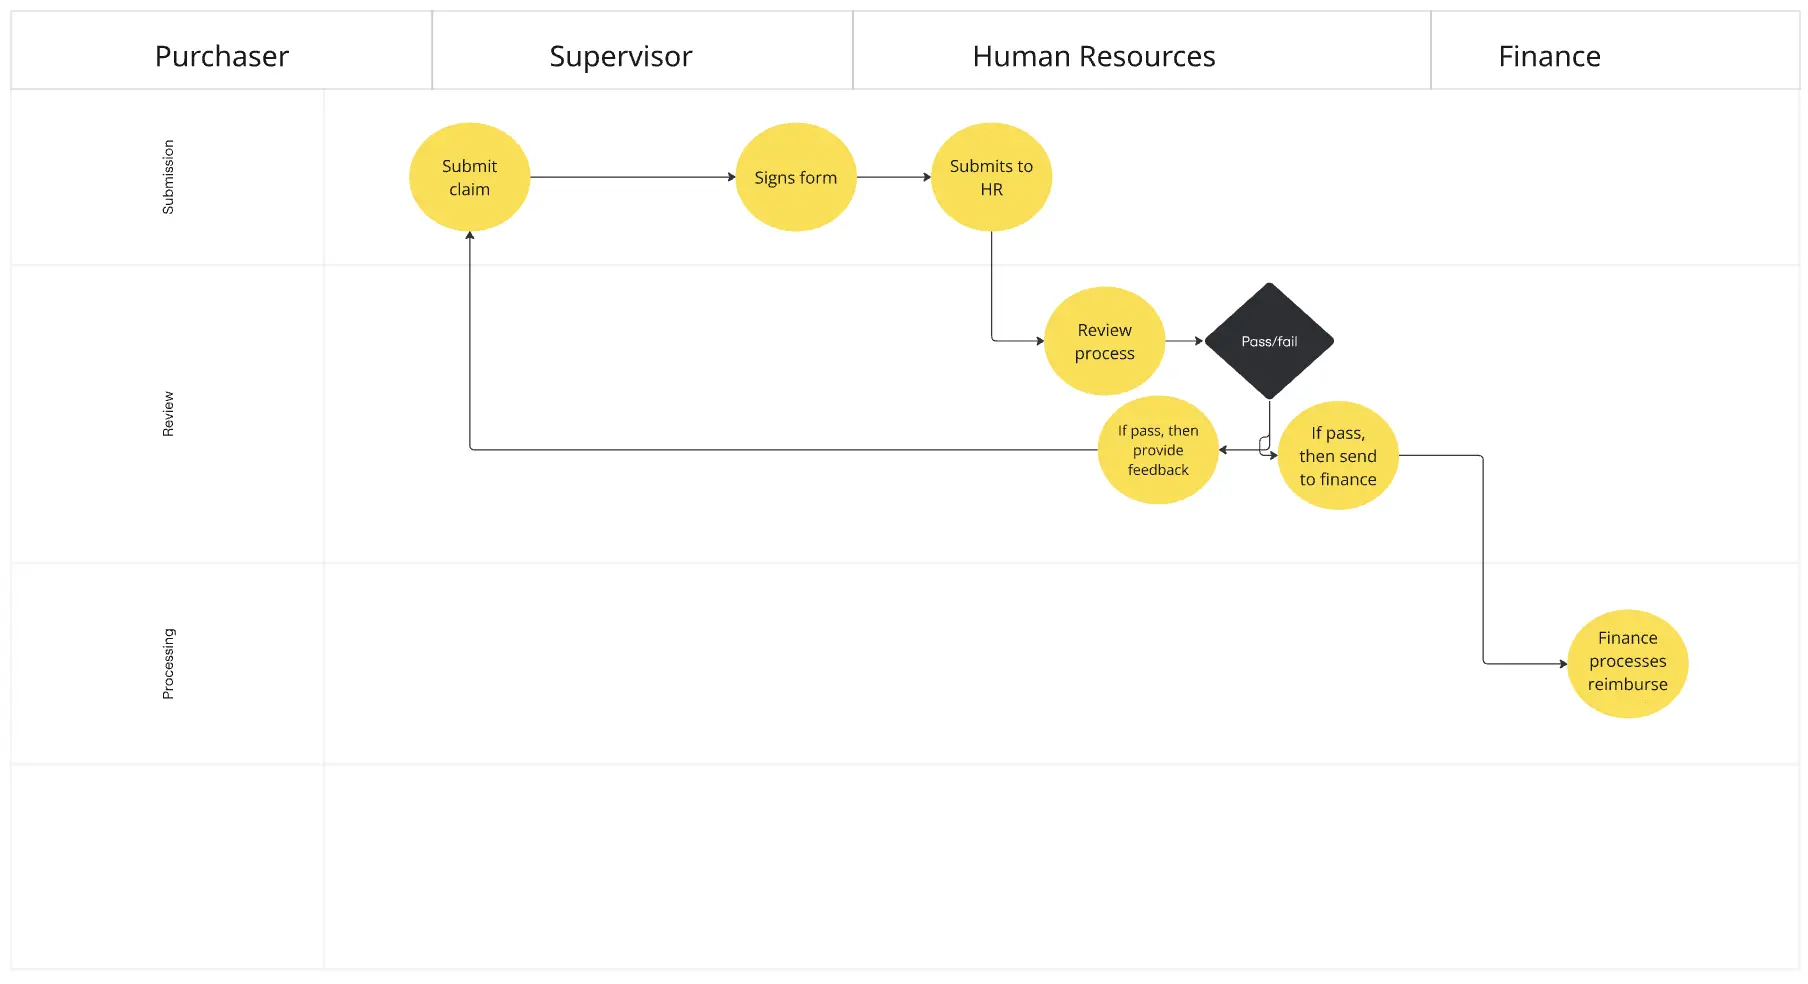
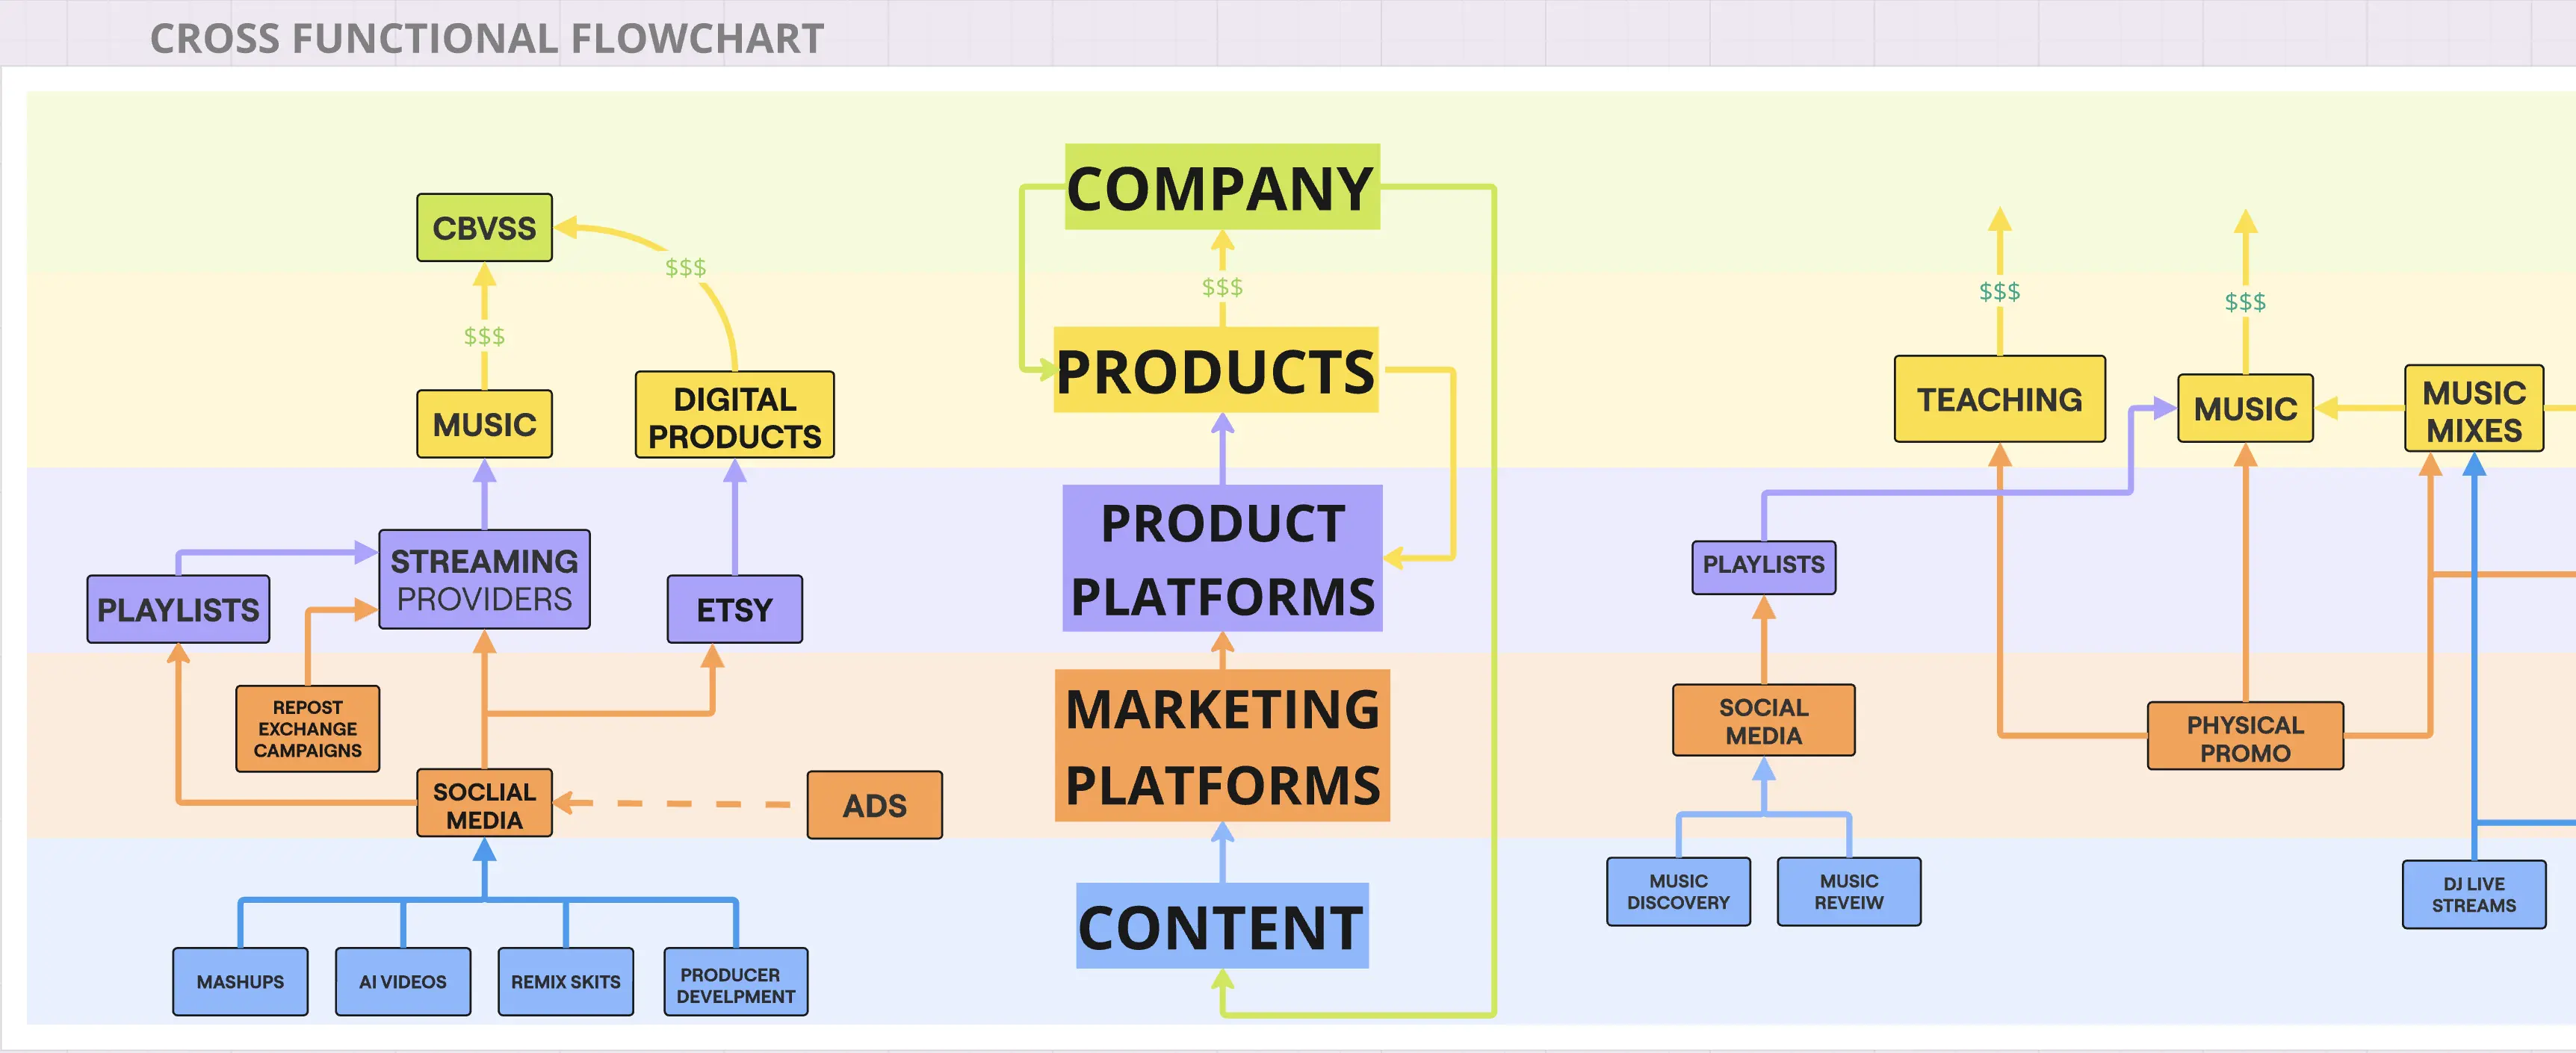
Select a Template & Initial Setup: Choose from a wide array of workflow chart templates – from basic linear flows to complex cross-functional swimlanes. Leverage Miro AI to generate a preliminary draft from a simple text description, jumpstarting your diagram.
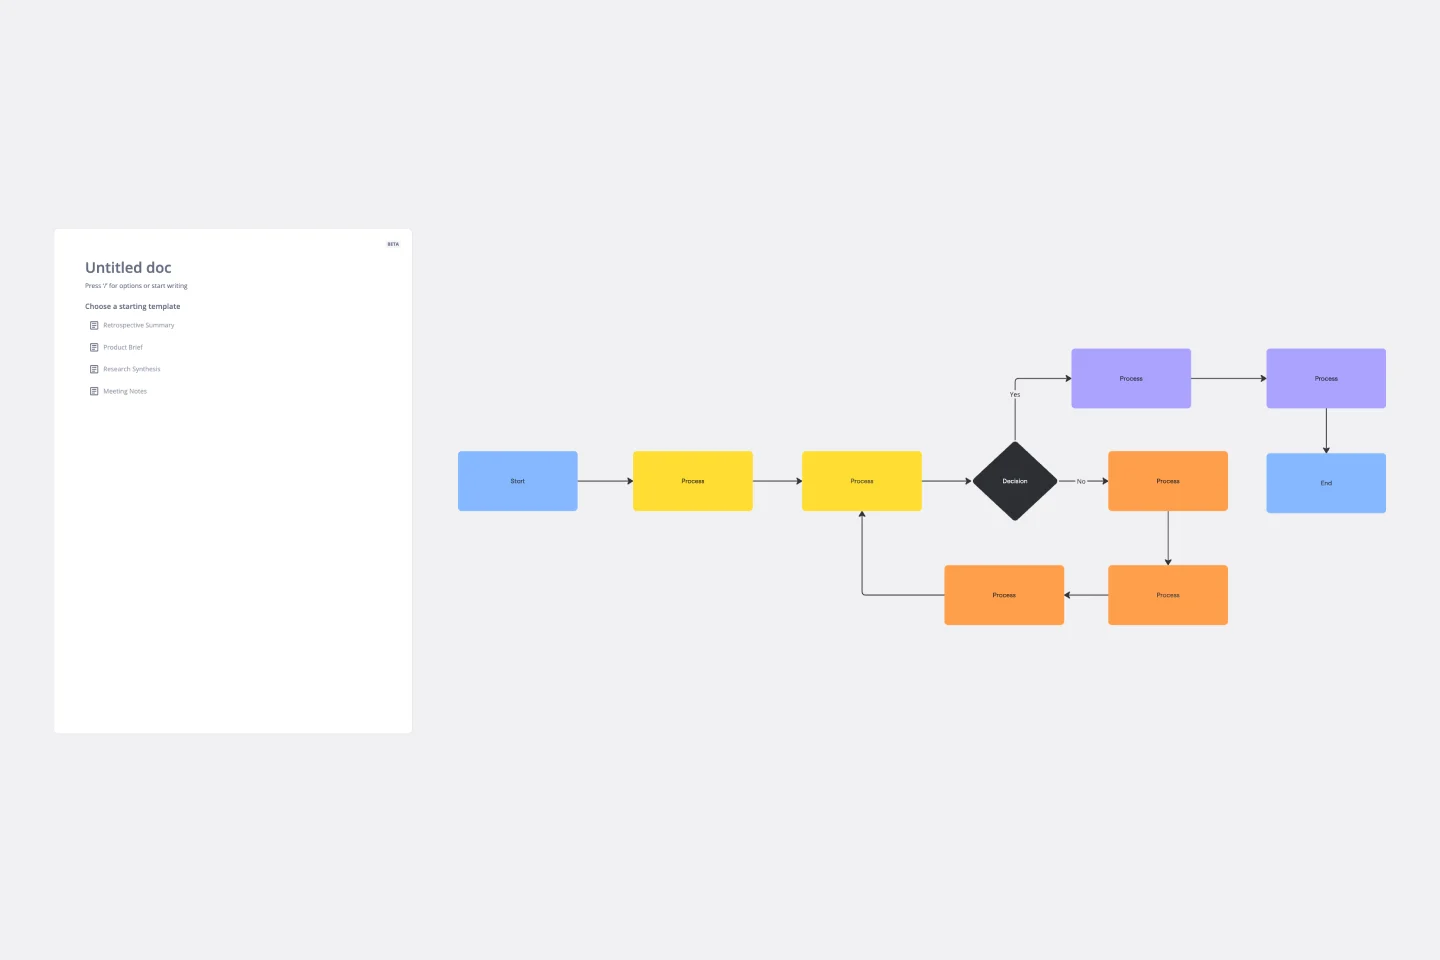
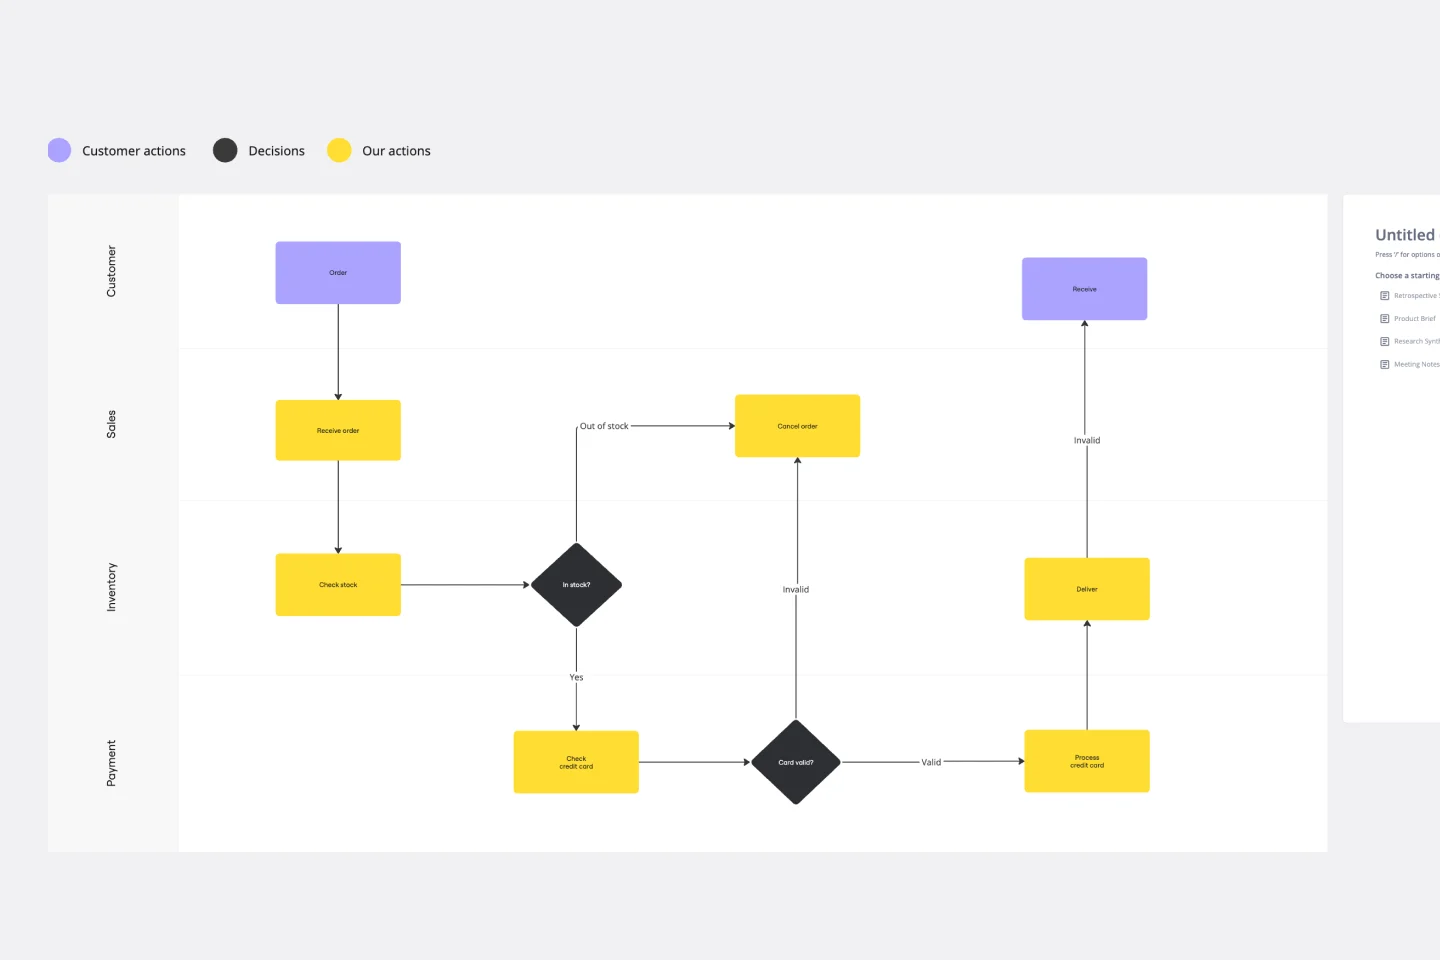
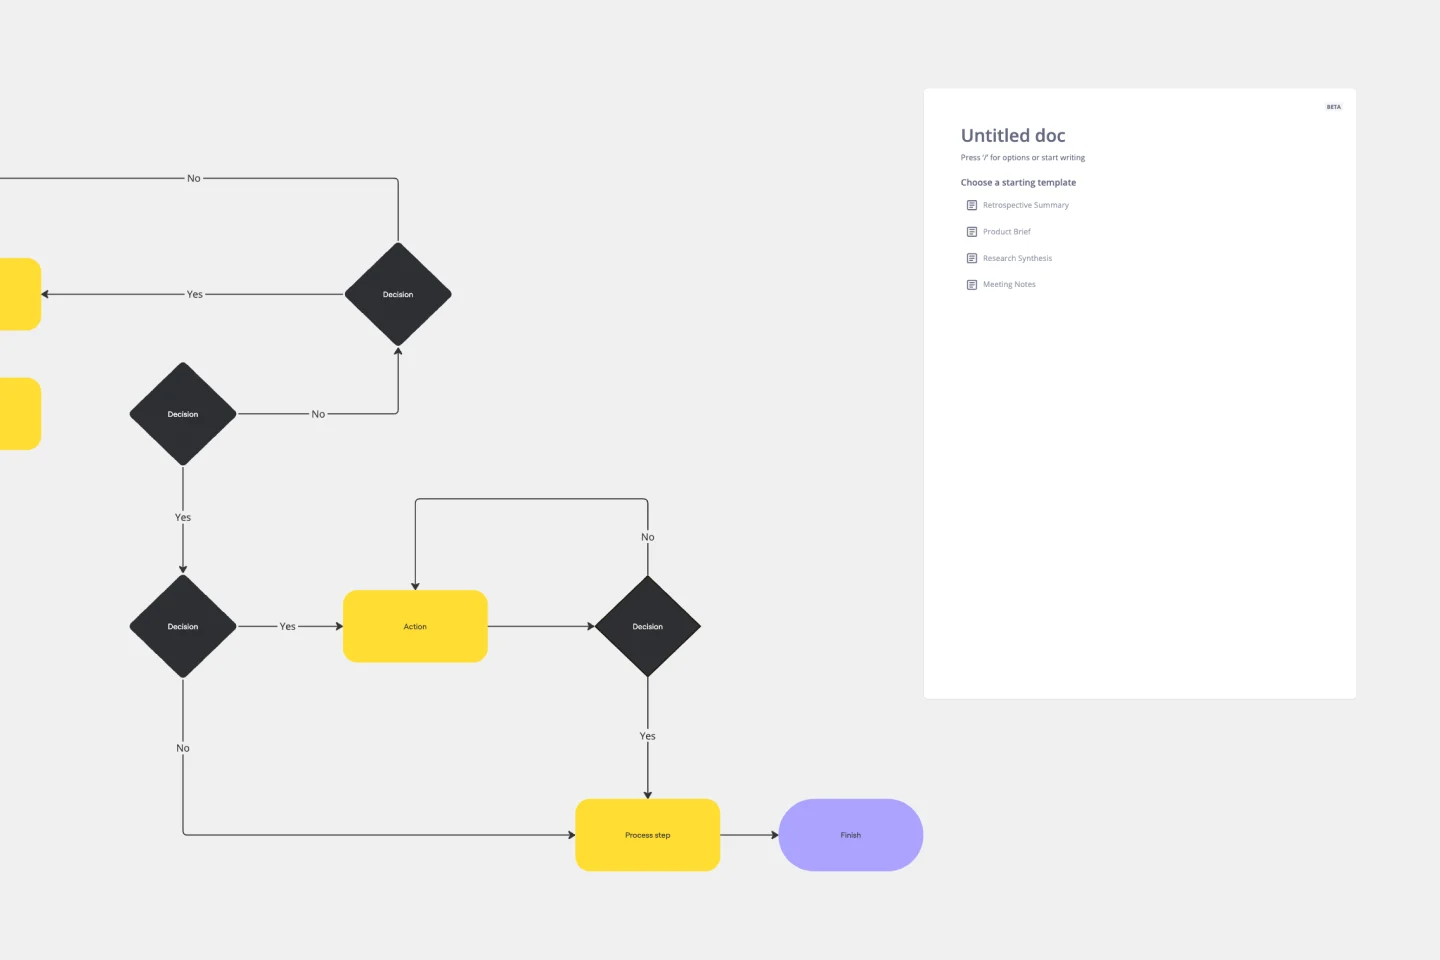
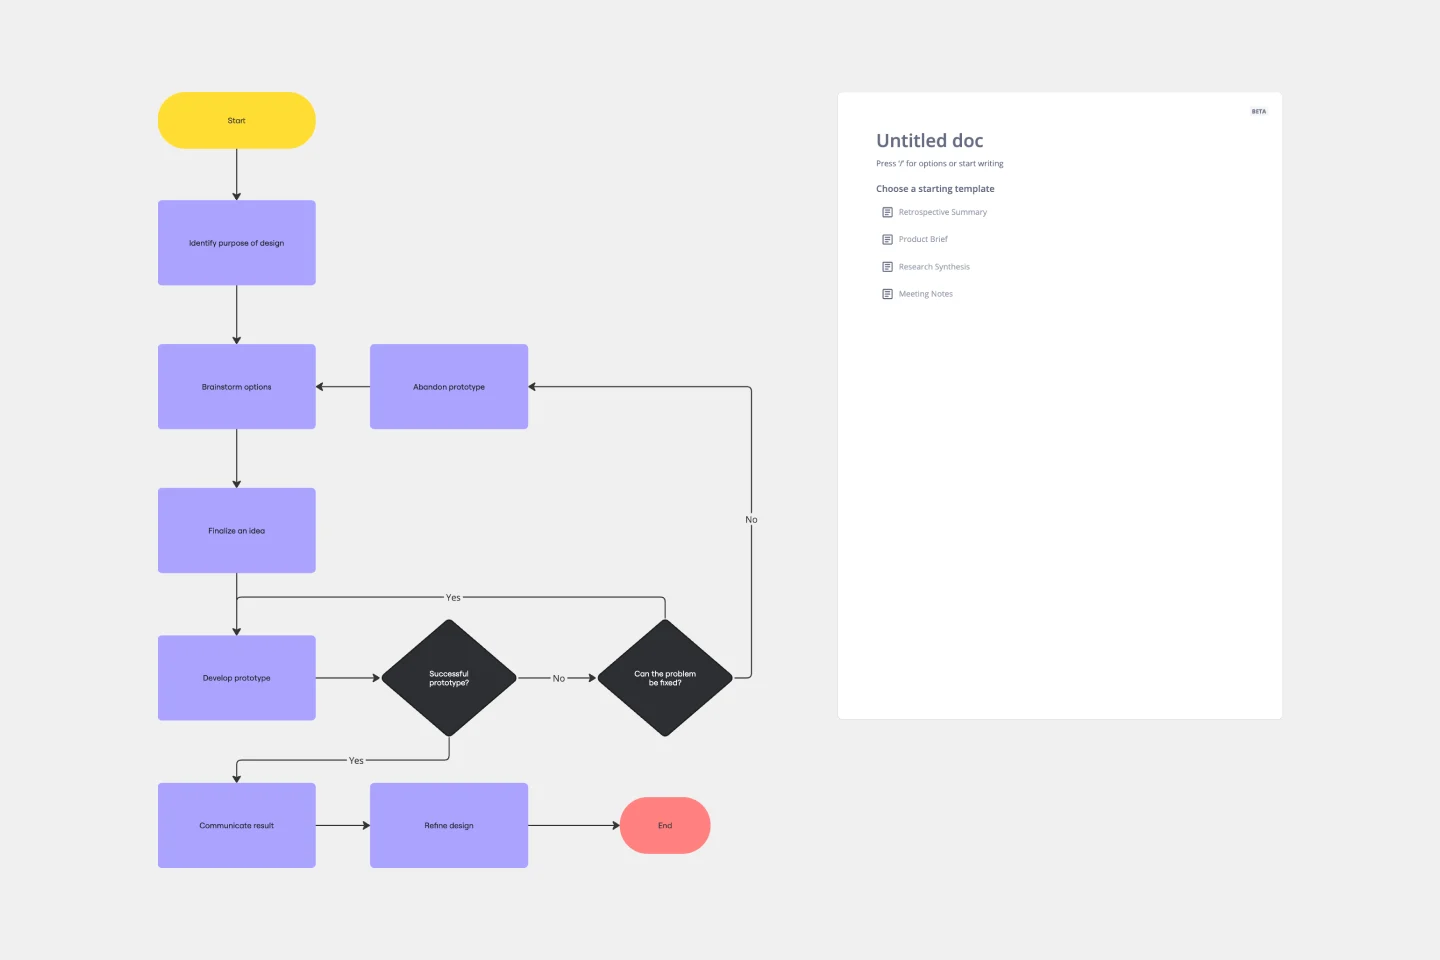
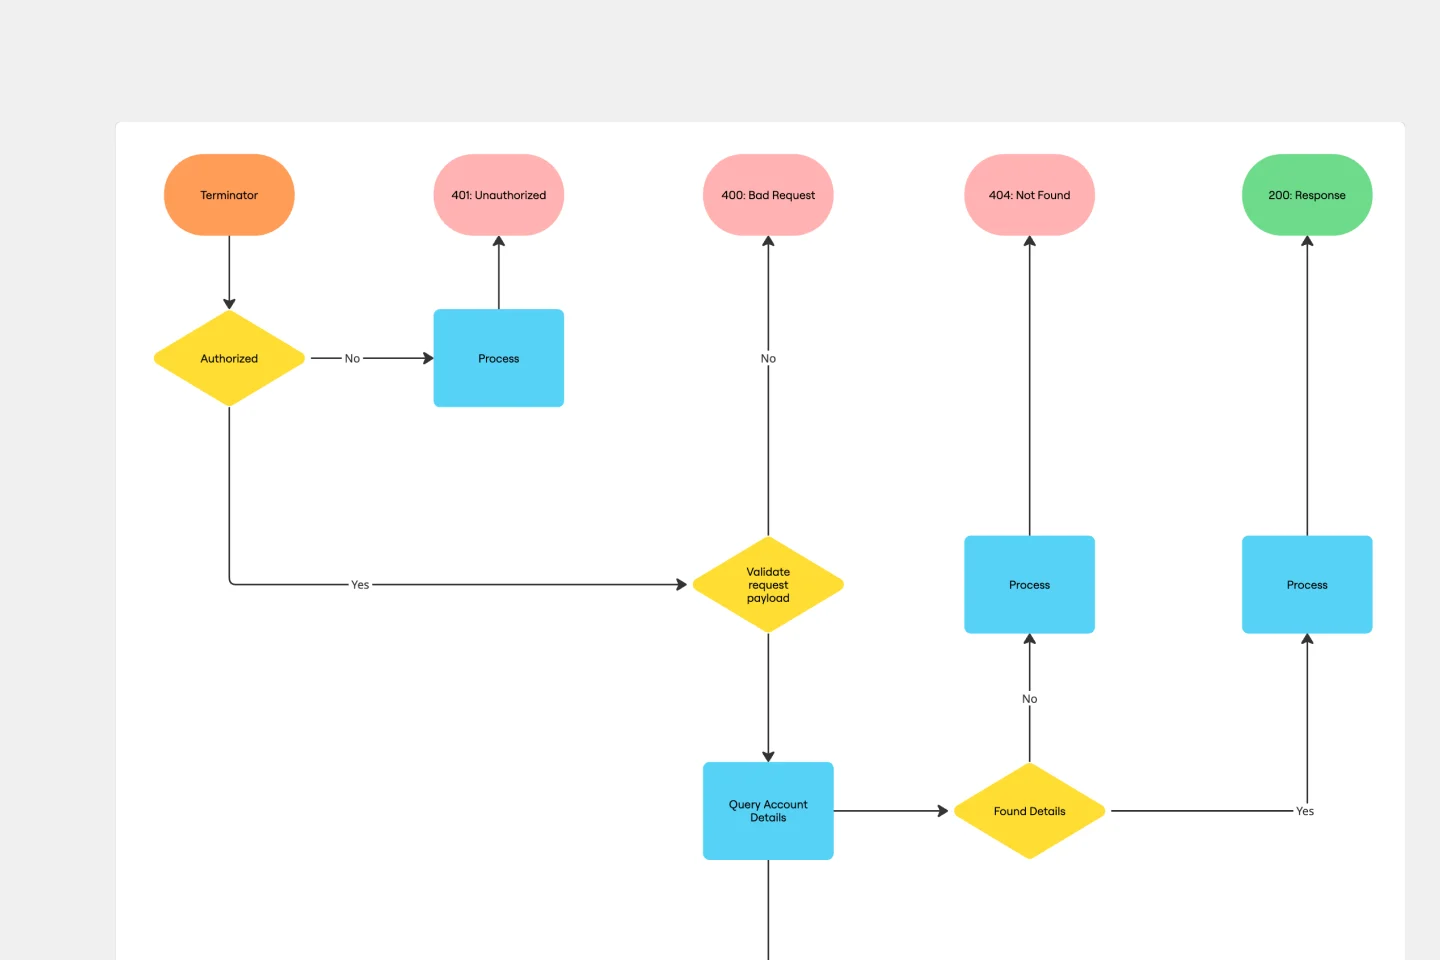
Populate with Precision – The Role of Symbols: Drag and drop the appropriate flowchart symbols to represent each step.
Terminal (Rounded Rectangle): Indicate the start and end of your process.
Process (Rectangle): For a specific action or step.
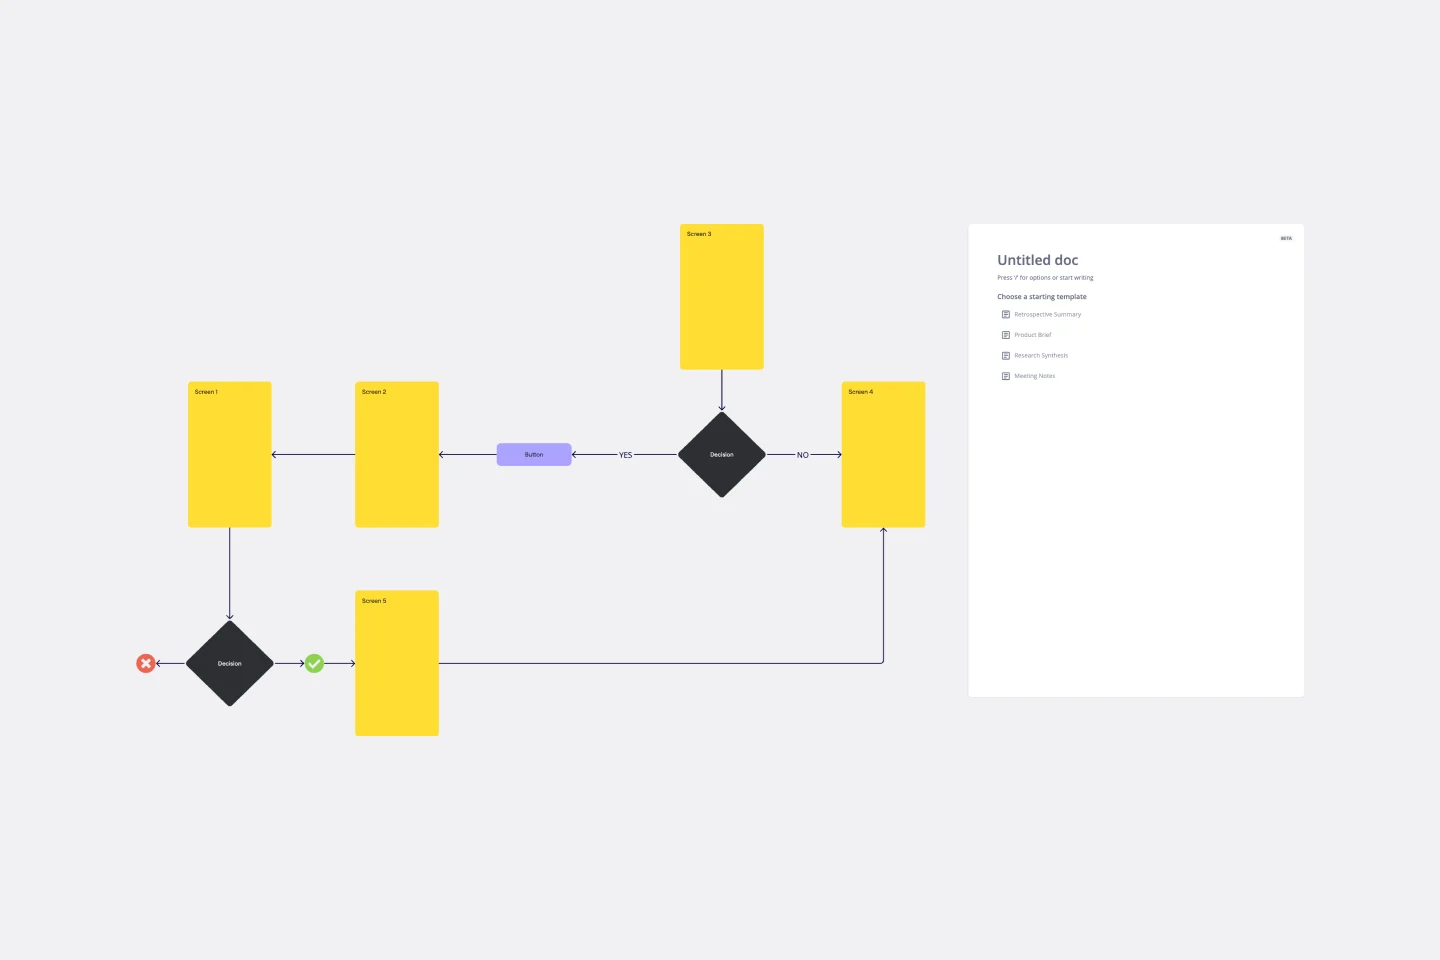
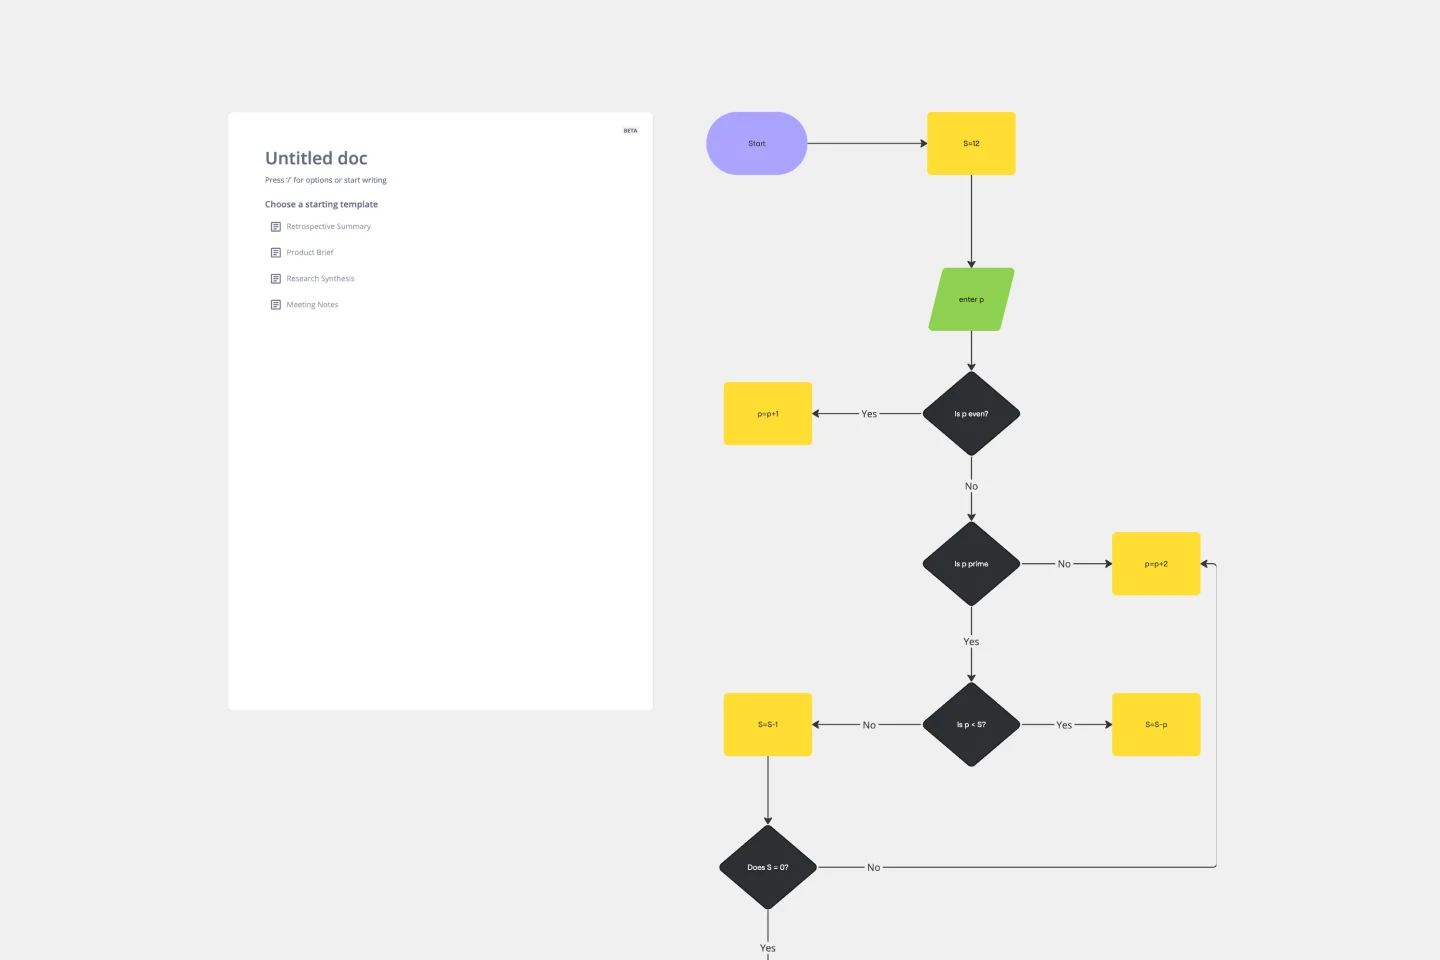
Decision (Diamond): Where a question is asked, leading to multiple paths (e.g., Yes/No).
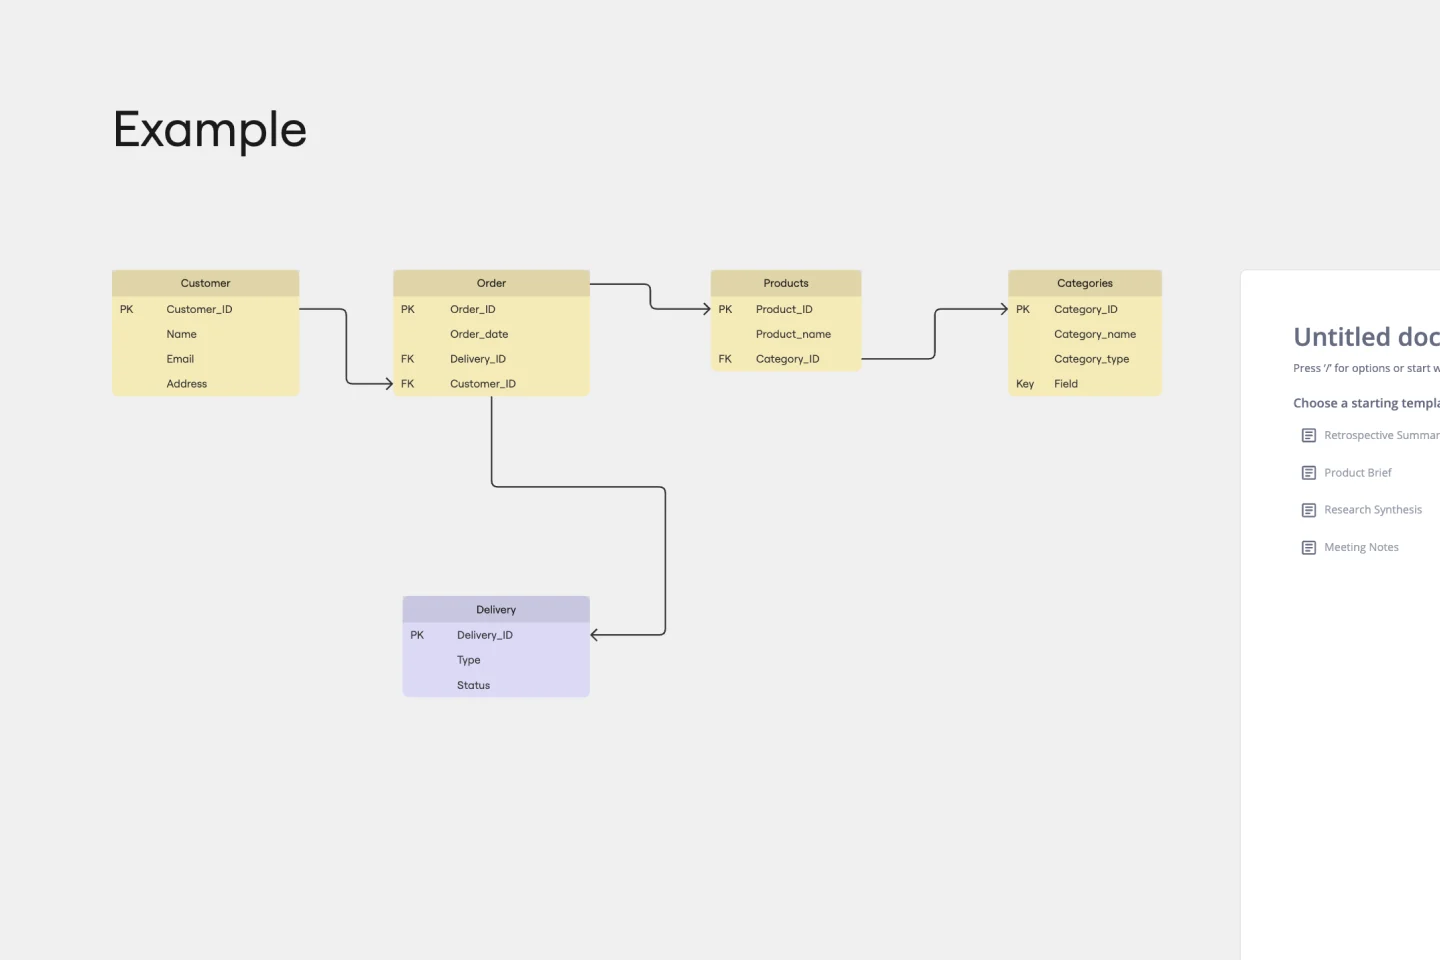
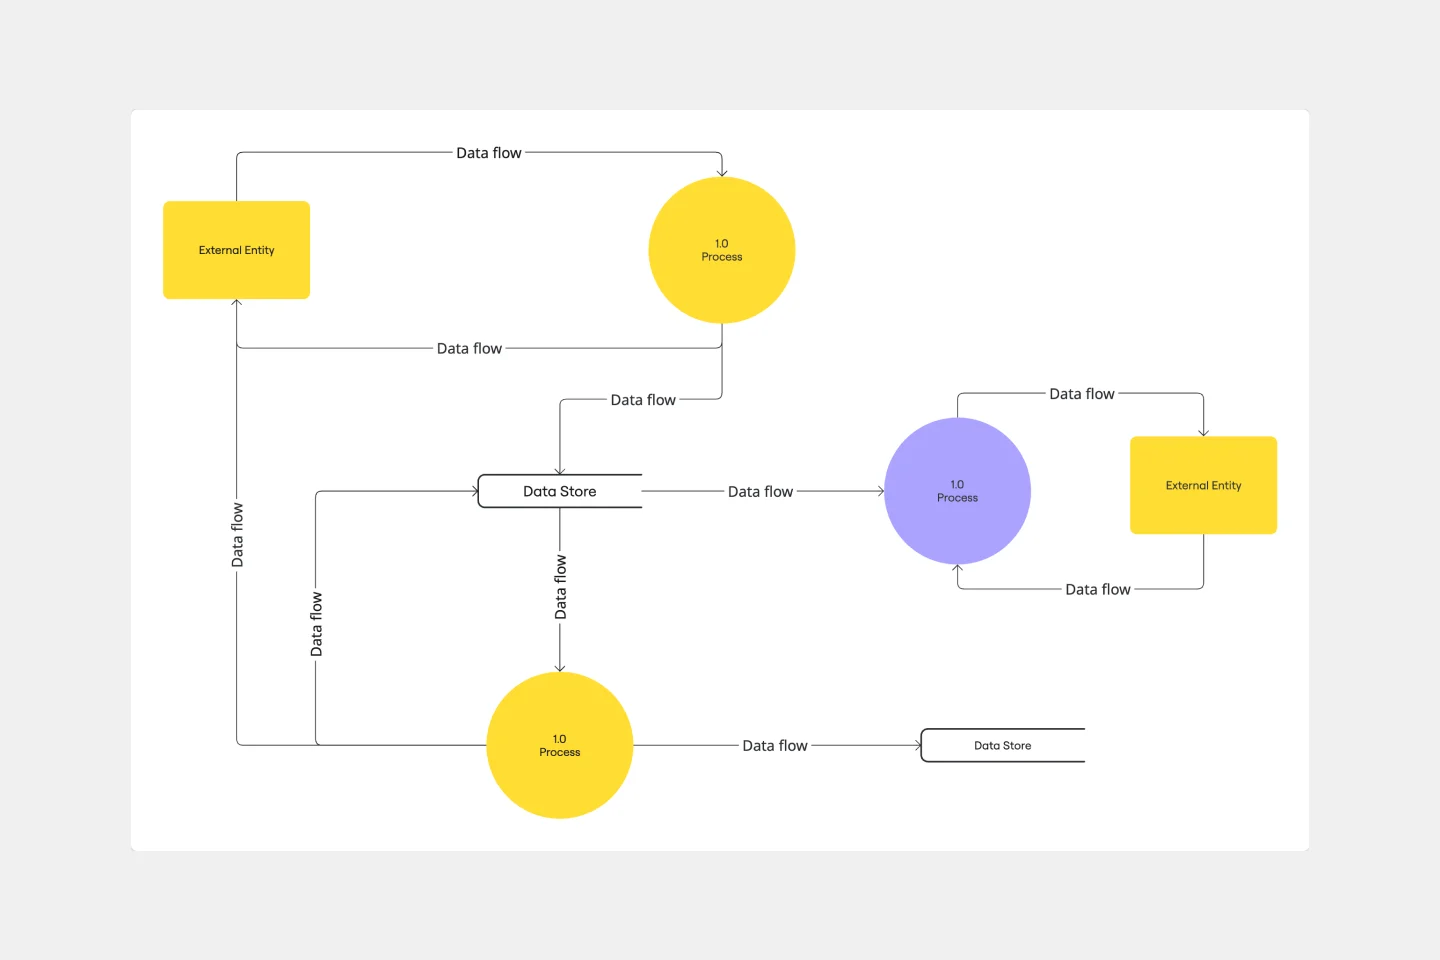
Data (Parallelogram): Represents input or output of data.
Document (Rectangle with wavy bottom): For documents or reports.
Connectors (Arrows): Clearly define the flow direction and relationships between elements. Pro-Tip: Use consistent sizing and alignment, easily managed with Miro's smart guides and auto-layout features.
Add Detail & Metadata: Beyond just symbols, enhance your flowchart template with text labels, links to external documents, and tags for ownership or status. This transforms your diagram into an interactive knowledge hub.
Collaborate & Validate: Invite stakeholders to review the your template. Utilize Miro’s comment and voting features to gather feedback, identify potential gaps, and ensure the process is accurate and understood by all.
Integrate & Maintain: Embed your finalized flowchart template directly into your project management tools (Jira, Asana) or documentation platforms (Confluence, Notion). Regularly review and update your charts, making them living assets that evolve with your operational changes.
Flowchart template FAQs
What is a flowchart template used for?
A flowchart template is used to visualize steps in a process, making complex workflows easier to understand and communicate. Using a template is especially useful for project planning, system mapping, onboarding, decision-making, and training documentation.
Why is it better to use a flowchart template over starting from scratch?
Flowchart templates remove the complexity, overwhelm, and time commitment of starting a flowchart from scratch. You’re provided with a structured, professional starting point that saves time and ensures nothing critical is forgotten.
How do I choose the right flowchart template?
Before you choose a flowchart template, it’s important to identify the goal of your process. For example, decision-making, task management, training, or something else. Once you know what you’re trying to achieve, you can browse our flowchart templates to find one that meets your structure needs.
Are Miro flowchart templates beginner-friendly?
Yes, Miro templates are designed to be suitable for both beginners and flowchart wizards. You don’t need to be a designer or process expert - you can simple drag, drop, and adjust as required.