What is an Entity Relationship (ER) Diagram?

What is an ER diagram?
An entity relationship diagram (also known as an ER diagram or ERD diagram or simply ERD) shows how entities (people, objects, and concepts) interact. These conceptual data models help developers and designers visualize the relationships between key software elements. Created by computer scientist Peter Chen in the 1970s, ERDs are commonly used by businesses in database design. However, ERDs can also map relationships between other business elements, such as roles (like a product manager’s relationship with a developer), tangible business objects (like a product or service), and intangible business objects (like a product backlog). The diagram itself is a type of flowchart. It’s a logical model that shows how data flows from one entity to the next. With this easy-to-follow format, software developers and designers can clearly visualize the structure of a system.
Entity relationship diagram symbols
Each diagram features a selection of entity relationship diagram symbols. Here are some of the most common symbols:
Rectangles: Symbolize parent entities, with double rectangles indicating weak entities that depend on them.
Ovals: Represent attributes, detailing the characteristics of each entity.
Diamonds: Used to depict the relationships between different entities.
Arrows and Connection Lines: Illustrate the connections and relationships among entities.
Cardinalities: Show the extent of information flow between entities, indicating the nature and strength of relationships.
Knowing ER diagram symbols is an important aspect of understanding ER diagrams but if you want to learn how to read an er diagram properly, you can take a look at our in-depth guide.
Why is ERD important in database design?
When it comes to launching new software, developers and database designers need a simple but effective way to visualize the structure. They need to know how the entities work together, the entities’ attributes, and how the entities relate to one another. This is where a logical ER model can help. An ERD allows developers to map every key element of a new database. They can see how the software will work, test certain relationships beforehand, and pinpoint any gaps in the software before it goes live. This leads to a smoother process for the development team when things go live. Creating an ERD also helps developers spot areas for improvement in existing databases. An ER diagram makes it easy to visualize where current software needs improvement. Developers can then debug the databases to improve the software going forward.
What are the 3 main components of an ER diagram?
The three components of an entity relationship diagram are:
Entities
Typically displayed as a rectangle, entities are nouns (such as objects, people, concepts, or events). Different symbols often reflect different types of entities. For instance, a strong entity set is usually represented by a rectangle, while a weak entity set is illustrated as a double rectangle.
Attributes
Attributes are the characteristics of an entity. For example, let’s say your ER diagram maps software students use to apply to college. Under the “Student” entity, the following information will be mentioned as attributes: Student_No, Student_Name, and Course_Of_Study.
Relationships
In an ER diagram, the connection lines and arrows have labels. These labels represent how the entities interact, showing the developer the relationships between them. Different types of connection lines also have different meanings and will show developers how much data flows from one entity to the next. These are cardinal relationships, which will be explained in more detail later. With these three components, developers can map the key elements of a new or existing database.
Benefits of an entity relationship diagram
Take a look at some of the key benefits of using an entity relationship diagram.
1. Visualize relationships
An ERD is a physical model of the relationships between entities. It allows you to visualize how entities relate to each other, how their relationships work, and where these relationships can be improved.
2. Simplify complex systems
Break down complex systems and databases with an ER diagram. See how interconnected entities connect and overlap to better understand how the system works.
3. Educate employees and stakeholders
Use a logical data model (like an ER diagram) to show new and existing employees how your systems work. Use it to update internal and external stakeholders and keep everyone in the loop.
4. Easy to create
Entity relationship models are simple diagrams, meaning they’re easy to understand. You don’t need to be a software developer to create the diagram, nor do you need any technical knowledge to understand it. And with a virtual workspace like Miro, you can use a ready-made template to start.
Example of an ER diagram
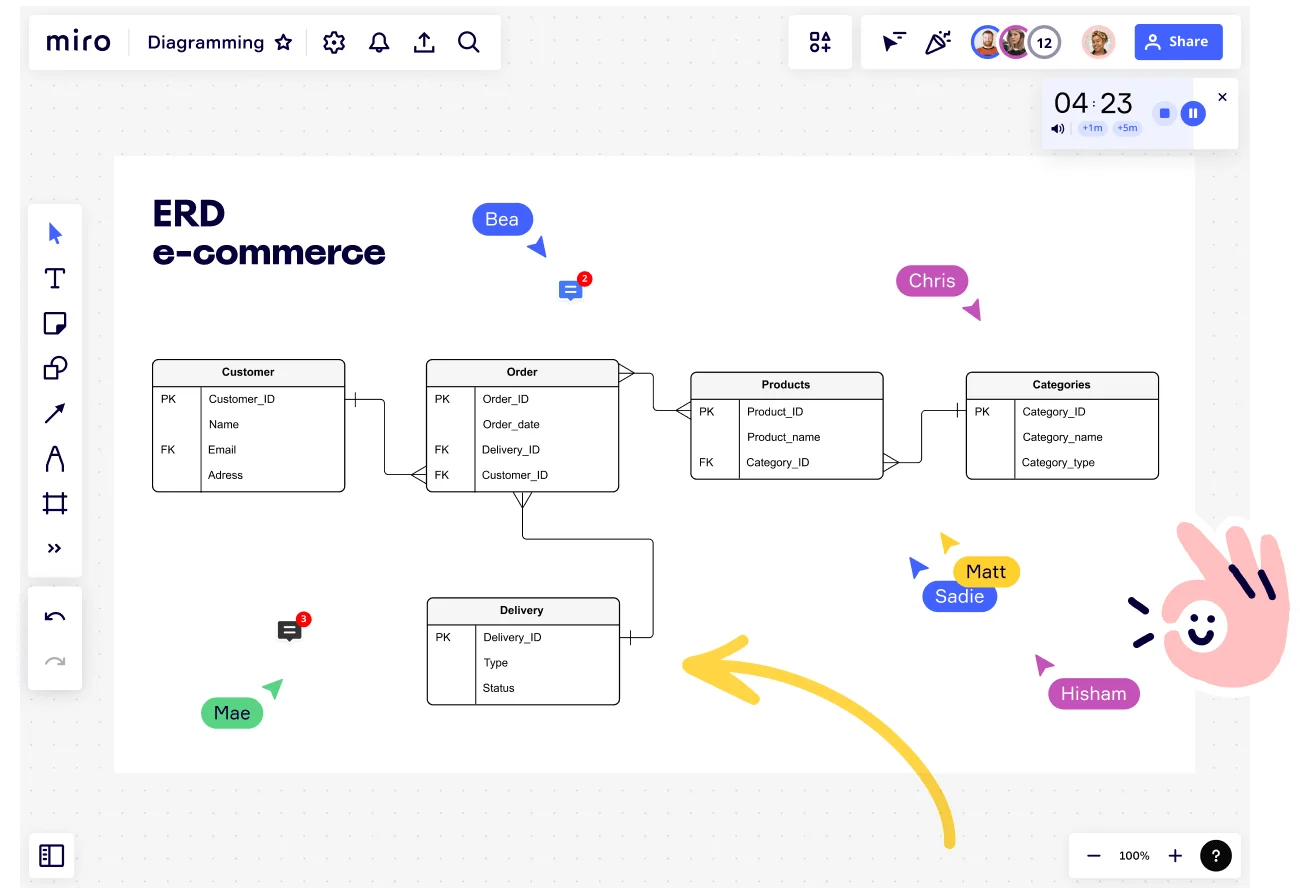
Take a look at our entity relationship diagram template to see an example of a physical data model in action. The diagram outlines an ERD for the stages of the customer journey while buying and receiving a product. When the order is placed, the business identifies the correct product and delivers it to the customer.

This ERD shows how these entities work together, starting with the customer and their attributes. From here, the diagram outlines all the attributes related to the specific order and uses the “one-to-many” cardinality from the customer to the order. Essentially, one customer can place multiple orders or order multiple items in one purchase. The order entity then splits into two directions. The diagram flow feeds into the products and product categories to the right. This is used to determine exactly which products the customers have ordered. When this information is received, the data moves to the delivery phase, during which the customer receives their order. This is one example of an ER diagram, and it shows just how versatile the diagram can be.
How to make an entity relationship diagram
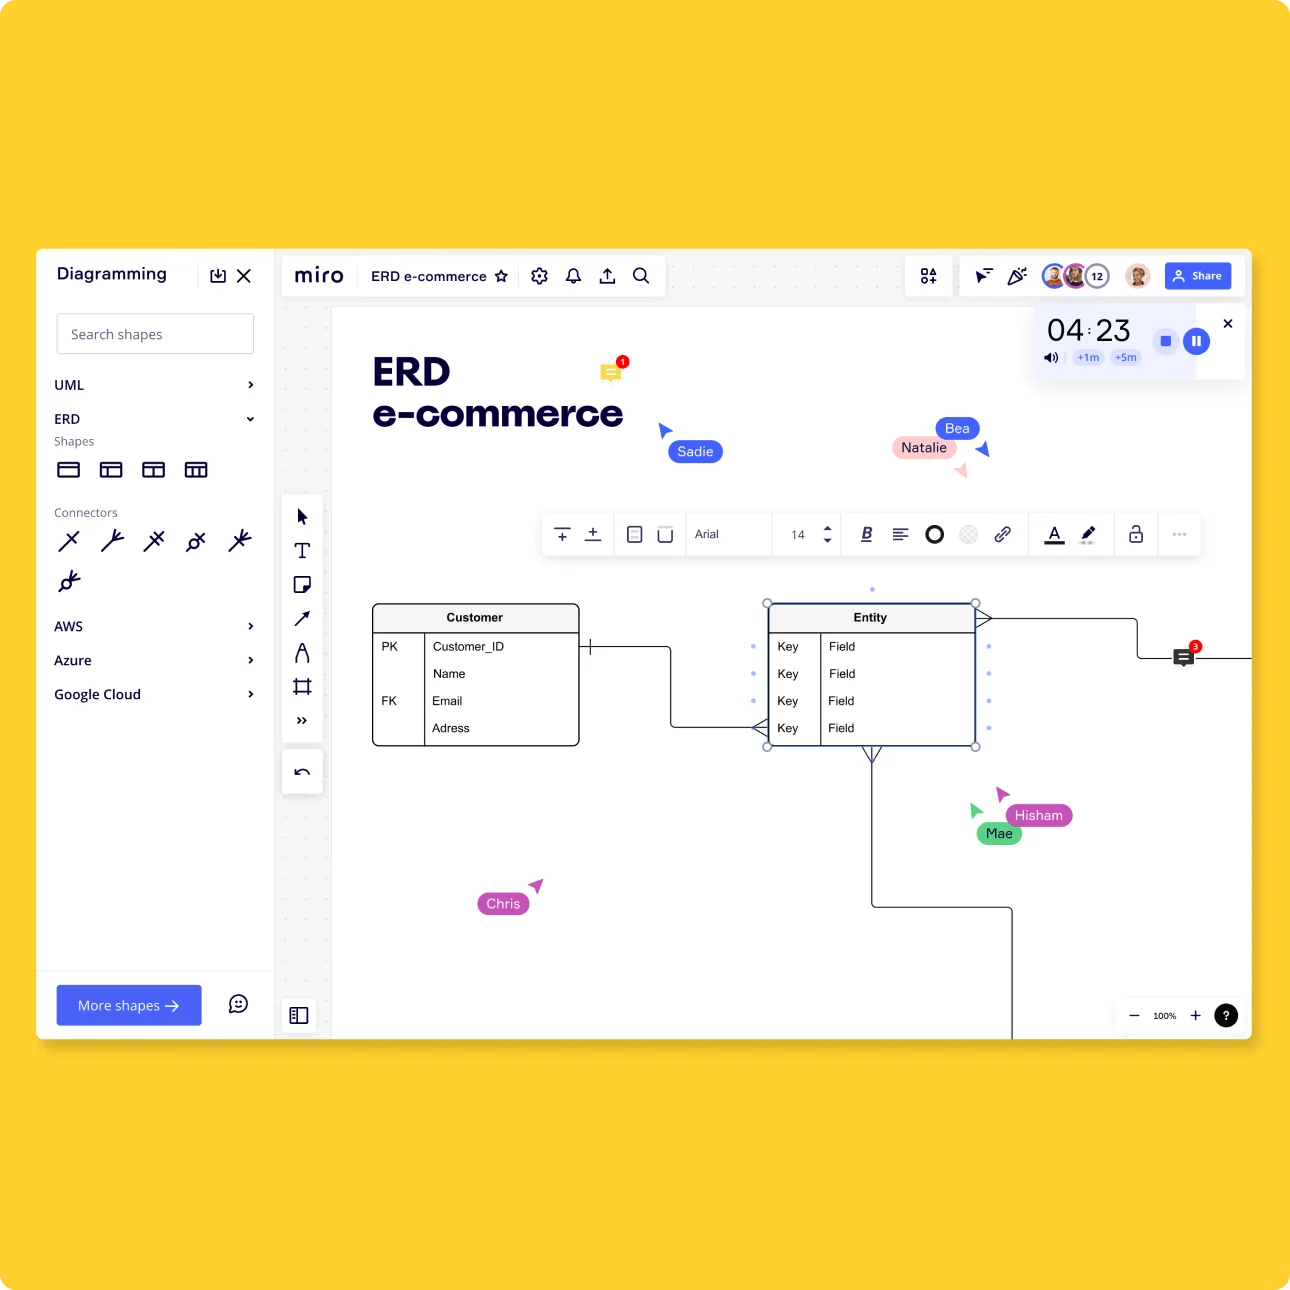
Miro’s digital workspace is the perfect platform for collaborative teams to create an intuitive and visually appealing ERD. Start by selecting this free entity relationship diagram template, and follow the steps below to create your ER diagram.
1. Identify entities
The first step is identifying all the entities that form your database or process. This step looks different for everyone. If you’re mapping a database or piece of software, you’ll identify all the key elements of the software. But if you’re focusing more on a process or business structure, you’ll focus on business elements and relevant roles. Ultimately, it’s up to you to pinpoint the right entities based on the model you’re trying to map. To help you get started, here are a few examples of ERD entities:
A person
Examples include a customer, employee, student, or patient.
Objects
Examples include products, machinery, and vehicles.
Events
Examples include customer acquisition, completing a sale, or performing a renewal.
At this point in the process, don’t worry too much about putting the element into a particular order. You’ll do this when you pinpoint the relationships. Instead, focus on covering every entity to ensure your database diagram is as accurate as possible.
2. Add attributes
Now you can add attributes to characterize the entities. Let’s use an example to demonstrate this. Imagine one of your entities is a product color. Within this entity, attributes could include the following: — Name of the color — Color code — Color ID All of this information adds detail to the entity. Whether you’re mapping a database or outlining a business process, attributes are vital. They define all the properties that define an entity, bringing key information to the forefront of the diagram.
3. Pinpoint relationships between entities
With the entities and attributes in place, it’s time to map their relationships. Using connection lines and arrows, connect the entities to signify their relationships. Not all the entities will be related, and that’s okay. Focus on the elements that relate to each other, and connect them. When all the connection lines are in place, you can now add labels to describe the relationship type. Imagine you have two entities — a “Customer” and an “Order.” You might add a label to the connection line to show how these entities relate. The label says “Places,” which indicates that the entities relate to each other through a specific action (when a customer places an order). Although this piece of information is small, it provides additional context, making it easier for anyone reading the diagram to fully understand how and why certain elements connect.
4. Define cardinalities
Another way to provide additional information is to use cardinalities. Cardinalities define the numerical attributes of relationships between entities. They represent how much information or data flows between entities. Examples of common cardinalities include:
A one-to-one relationship
A customer that’s only able to buy one product at a time.
A one-to-many relationship
A customer that’s able to buy multiple products at a time.
A many-to-many relationship
A group of customers that can buy multiple products at a time.
Small symbols on each connecting line or arrow reflect these numerical values. The symbols vary depending on how much information is flowing and in which direction it’s moving. To make your diagram as clear and concise as possible, you need to consider cardinality. This allows you to show exactly how much information moves between entities, as well as which way it moves. As a result, anyone reading the diagram will instantly have a clear picture of how data flows through the entire database or system.
If you are interested in learning more about one-to-many relationships or many-to-many relationships in ER diagrams, we have dedicated guides to these topics. Take a look at our Discover More section at the end of this page to find these.
5. Share your ERD
With your final diagram ready to go, it’s time to share it with the relevant stakeholders. This will allow team members and external parties (such as investors or shareholders) to ask questions and provide feedback. With Miro’s entity relationship diagram tool, it’s easy for teams to collaborate during this process. Simply share the diagram with the relevant parties, and they can add comments directly to the board.
6. Update and iterate
As time passes, your conceptual model will likely change. Software may need updating, databases may need new elements, and team structure diagrams can quickly become outdated. To make sure your ERD is up to date, you need to update it regularly. This means that whenever there are any changes, return to the drawing board and implement them. Even if there aren’t any changes you’re aware of, it’s still worth returning to the diagram and ensuring it’s up to speed. The more frequently you review it, the easier it’ll be to ensure the diagram accurately reflects your database or process. Although regularly updating a diagram can feel time-consuming, Miro’s digital workspace makes the process easy. Use the drag-and-drop feature to move components of your entity relationship diagram and new entity shapes, and edit your existing text in a matter of clicks. And because all the changes appear in real-time, everyone on your team can always see the most up-to-date version — no matter where they are.