Production Flowchart Template
Map processes from start to finish and reduce complexity with the production flowchart template.
About the Production Flowchart Template
Do you want to simplify your production processes? Use the production flowchart template to break down each step, visualizing the production flow and spot areas for optimization.
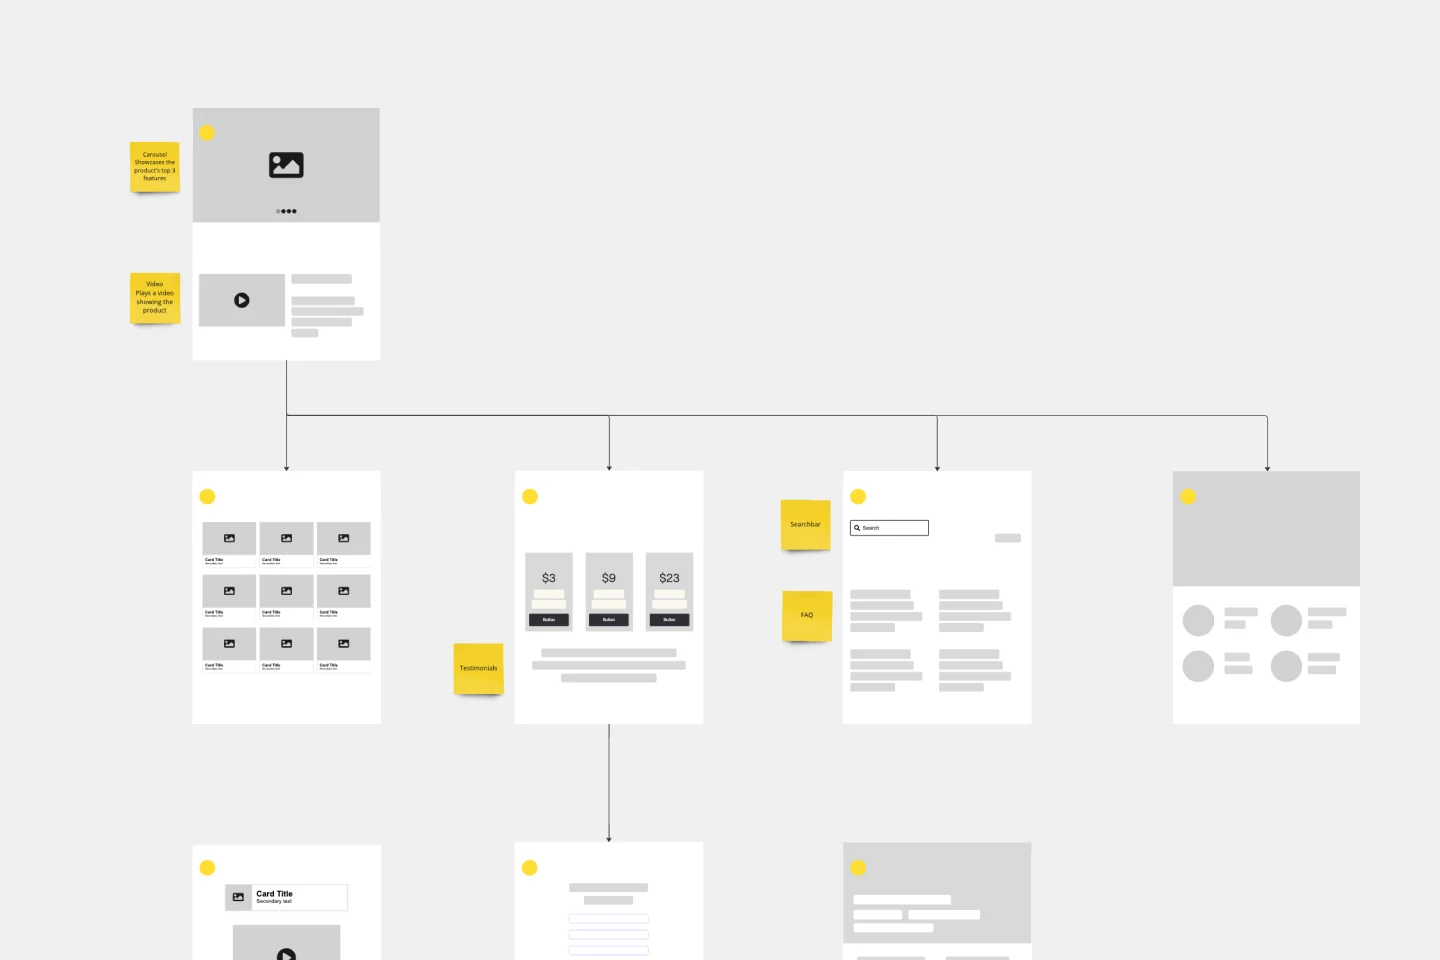
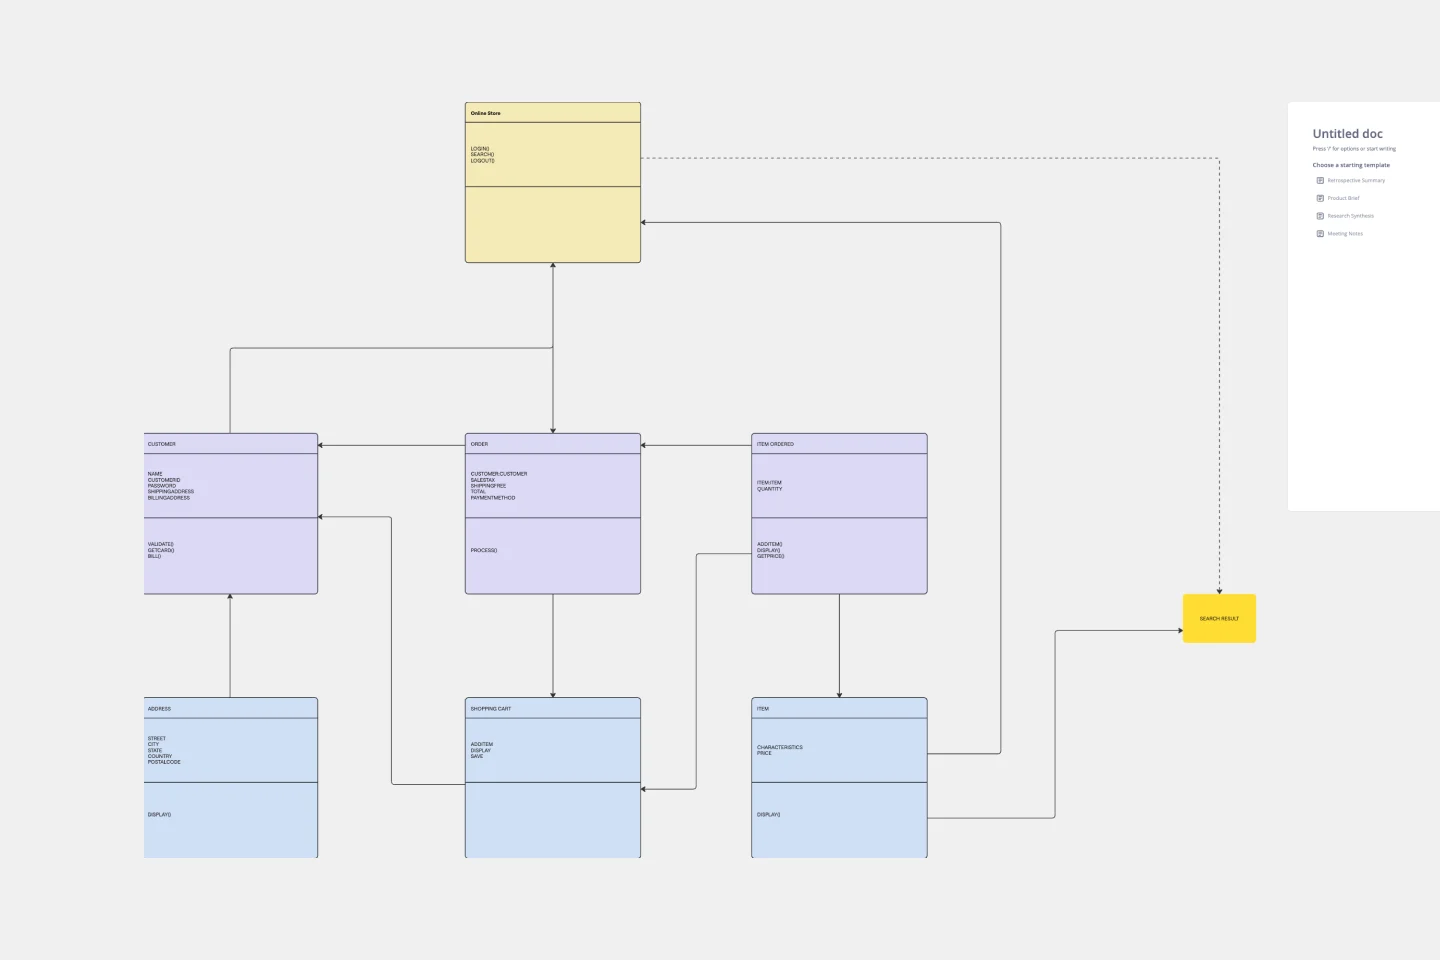
The template consists of a pre-designed diagram that showcases the systematic breakdown of the production process. Each area of the template signifies a distinct phase or step in the process, making it easier to understand the progression of tasks.
The production flowchart template contains the following attributes:
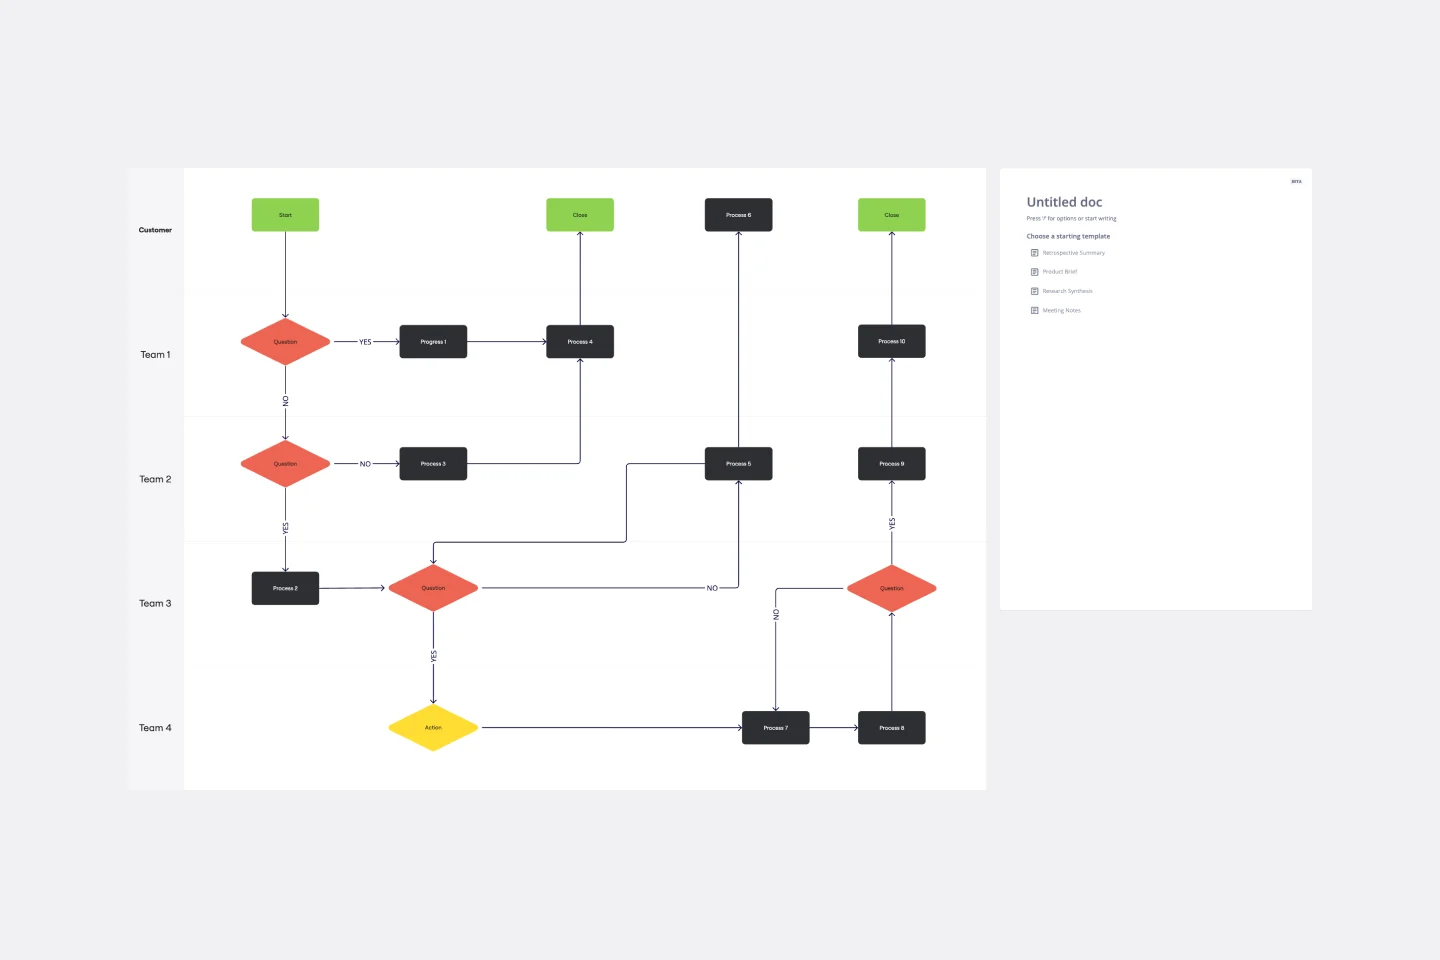
Shapes: These represent different steps or processes. They can be customized to differentiate tasks, departments, or stages.
Connector Lines: These link the shapes together, indicating the sequence or flow between tasks.
Annotations: Useful for adding extra information or context about a particular process or step.
Colors: Can be applied to shapes or lines to categorize or prioritize processes.
This template can be customized to meet the unique requirements of any production, making it the perfect solution for your needs.
How to use the production flowchart template in Miro
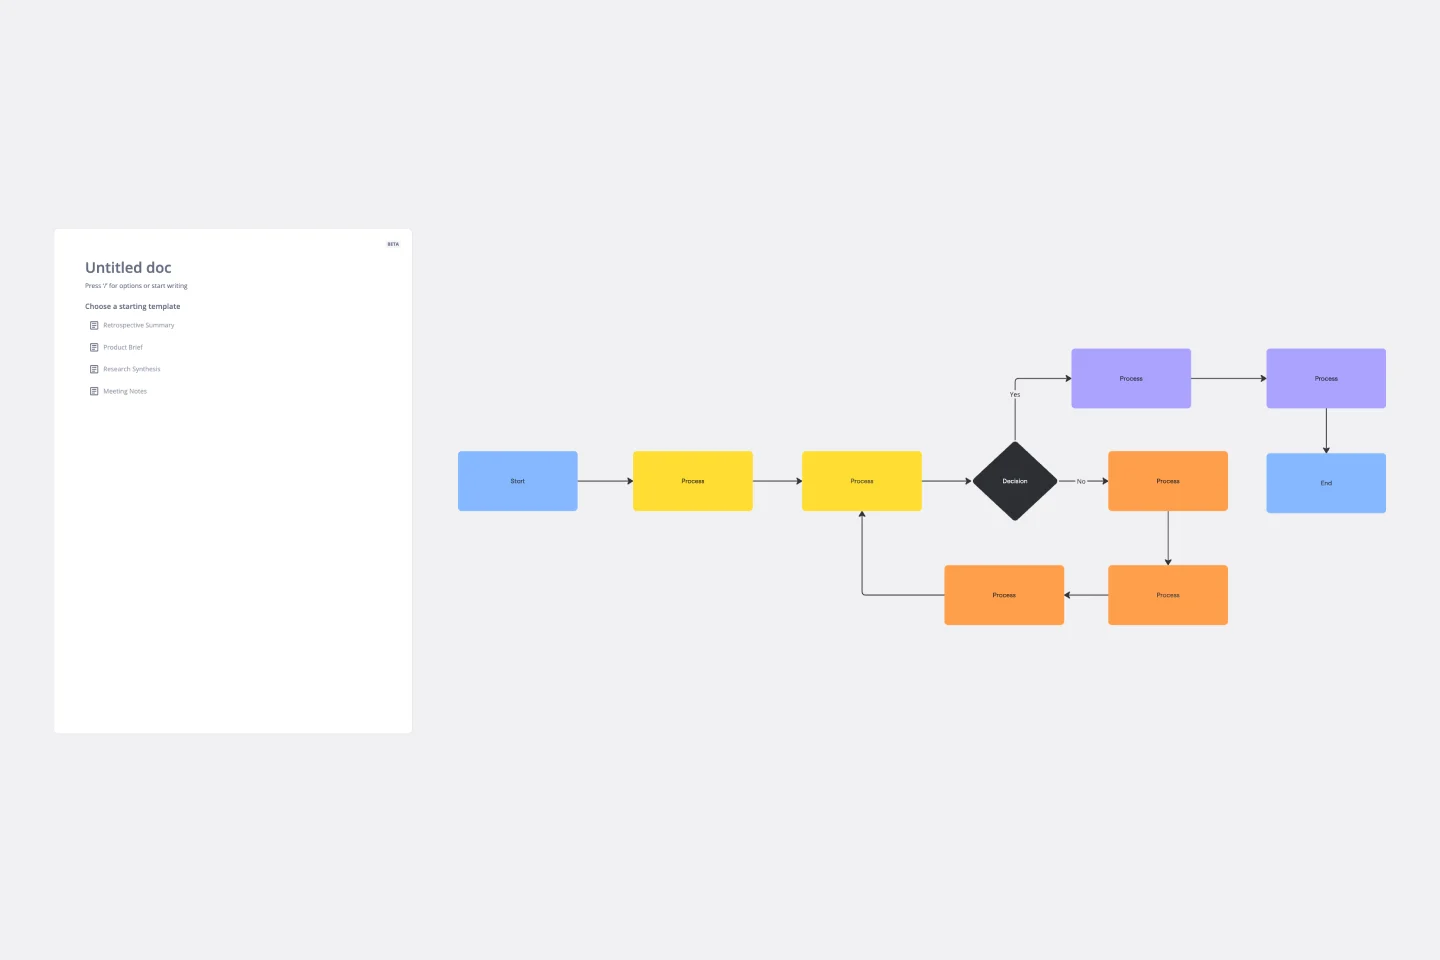
Add your production flow: Open the template and edit the shapes, colors, and texts to represent your production process.
Expand the flowchart: Use Miro’s automated diagramming features to add more shapes and connector lines until your production process is accurately represented.
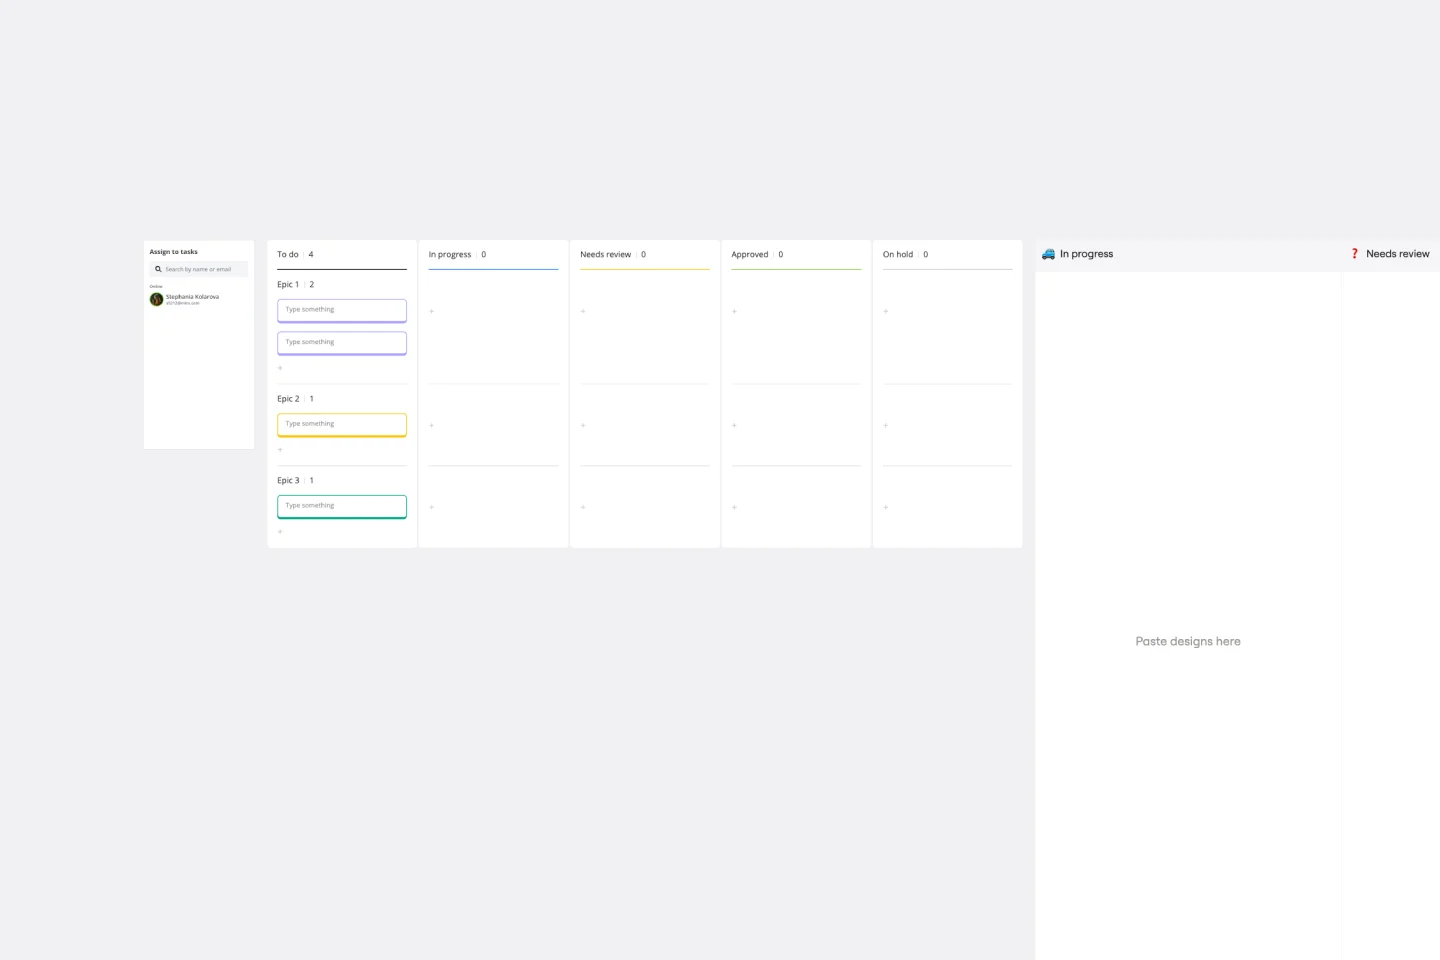
Add any extra context: Integrate other artifacts or elements on the board to provide any additional context that helps visualize or understand your production process.
Why should you use a production flowchart template?
Breaking down a production process from start to finish makes it easy to visualize complex operations. In addition to serving as a useful guide, this template has many benefits:
Provides clarity: A detailed flowchart provides a clear visualization of the production process, making it easier for all involved to understand.
Efficiency: Identifying and rectifying bottlenecks becomes straightforward when each step of the process is mapped out.
Collaboration: Team members can collaborate in real time, offering suggestions and improvements.
Optimization: With a comprehensive overview, teams can streamline operations, reducing costs and improving output.
Documentation: The template acts as a reference point, ensuring everyone follows the established procedures. The template is easy to update as the production process changes, ensuring the most up-to-date version is always shared.
If you'd prefer to start from scratch, Miro's easy flowchart tool will help you build an online flowchart in no time. With Miro's collaboration features, you can workshop it with your team and easily share it with others for feedback with tagging, comments and sticky notes.
Can I customize the shapes and colors of the template?
Absolutely! The template is designed for full customization, allowing you to adjust shapes, colors, and text to represent your process best.
Is it suitable for all types of production processes?
Yes, the template is versatile and can be used for different types of productions. Whether you're mapping a simple or complex process, the template can be adapted to fit your needs.
How can I collaborate with team members using this template?
Miro allows for real-time collaboration. Team members can simultaneously view, edit, and comment, making collective input seamless.
Are there any limitations to how much I can expand the template?
With Miro’s infinite canvas, you can expand the template as much as you need — and if things get too expansive, simply zoom out or rearrange for clarity.
Get started with this template right now.
GenAI Application Workflow
Works best for:
Flowcharts, Mapping, Diagrams
The GenAI Application Workflow template is a visual tool for mapping out the workflow of applications developed using GenAI. It provides elements for defining process steps, decision points, and data flows within the application. This template enables developers and project teams to visualize the application workflow, identify potential bottlenecks, and optimize the user experience. By promoting clarity and efficiency in application development, the GenAI Application Workflow empowers teams to deliver innovative and user-friendly applications effectively.
Onion Diagram Template
Works best for:
Diagramming, Mapping and Diagramming
The Onion Diagram Template is a distinct tool designed to visually represent layers of a specific concept, system, or process, akin to the layers of an onion. Each concentric layer of the diagram provides insights into a different aspect or phase of the topic at hand, moving from the core foundational element outwards to more peripheral components. One of the prime benefits of this template is its ability to offer hierarchical clarity. Users can immediately discern the importance, sequence, or interrelation of different elements within a system, facilitating enhanced comprehension and efficient decision-making.
ERD Healthcare Management System Template
Works best for:
ERD
The ERD Healthcare Management System Template streamlines the process of creating and managing entity-relationship diagrams for healthcare management systems. This template helps users visualize the complex relationships between different entities such as patients, healthcare providers, medical records, and billing information. It offers a flexible and customizable framework that can be adapted to fit the specific needs of any healthcare management system, ensuring clarity and efficiency in system design and database structure.
Causal Loop Diagrams (1.0)
Works best for:
Diagramming
The Causal Loop Diagrams (1.0) template offers a visual tool for modeling complex systems and understanding the feedback loops that drive behavior. It provides a structured framework for identifying causal relationships, reinforcing loops, and balancing feedback within a system. This template enables teams to analyze system dynamics, anticipate unintended consequences, and formulate effective strategies for intervention. By promoting systems thinking and understanding of interdependencies, Causal Loop Diagrams empower organizations to navigate complexity and drive sustainable change.
Use Case Diagram Template
Works best for:
Marketing, Market Research, Diagrams
A use case diagram is a visual tool that helps you analyze the relationships between personas and use cases. Use case diagrams typically depict the expected behavior of the system: what will happen and when. A use case diagram is helpful because it allows you to design a system from the perspective of the end user. It’s a valuable tool for communicating your desired system behavior in the language of the user, by specifying all externally visible system behavior.
Product Development Process Flowchart Template
The Product Development Process Flowchart Template is a strategic tool designed to guide teams through the intricate journey of bringing a new product to market. This template serves as a visual roadmap, outlining each critical step in the product development lifecycle, from initial concept and design to testing, refinement, and eventual launch. It's structured to foster clarity, ensuring that all team members are aligned and aware of their roles and responsibilities at every phase.