What is an Ecosystem Map Template?
An ecosystem map template is a bird’s-eye view of the environment in which your business operates. Unlike a traditional value chain (which is linear), an ecosystem map is Radial or Network-based. It identifies not just who the players are, but the Flow of Value (money, data, or services) between them. It is used to identify "White Spaces" for innovation, potential "Disruptors," and critical "Alliance Opportunities."
The "Network Effect" Audit: 3 Ways to Map Modern Markets
A business is no longer an island; it is a node in a network. Before finalizing your ecosystem board on Miro, apply these three expert "health checks":
1. The "Non-Traditional Actor" Audit
The Audit: Is your map only showing "Paying Customers" and "Direct Competitors"? The Floor: Audit for Influencers and Enablers. A professional ecosystem template must include:
Regulators: Who sets the rules?
Complementors: Who makes products that make yours more valuable (e.g., app developers for a smartphone)?
Substitutes: Who solves the same problem in a completely different way? If your map doesn't include the "Invisible Hands" like government policy or community groups, your strategy is incomplete.
2. The "Value Flow" Test
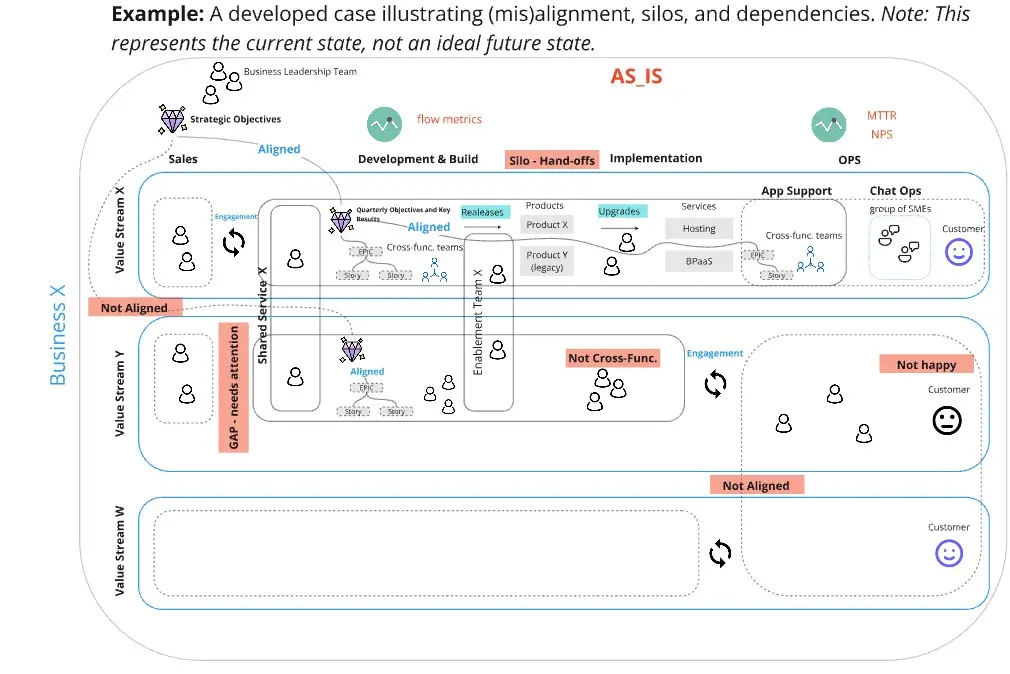
The Audit: Are your connections just "static lines" between logos? The Fix: Audit for Directional Exchange. Every line on your map should represent a specific flow: Money, Information, Goods, or Emotion (Trust). Use arrows to show the direction. If you see a node that only "Takes" value but never "Gives" it, you’ve identified a systemic risk or an unsustainable partnership.
3. The "Keystone vs. Niche" Guardrail
The Audit: Are you assuming your company is the center of the universe? The Fix: Audit for Role Definition. Identify which player is the Keystone (the platform holder like AWS or Apple) and who are the Niche Players. If you are a niche player, your map should focus on how to extract value from the keystone without becoming entirely dependent on them.
Strategic Frameworks: Which Ecosystem Template Do You Need?
Select the framework that matches your strategic objective:
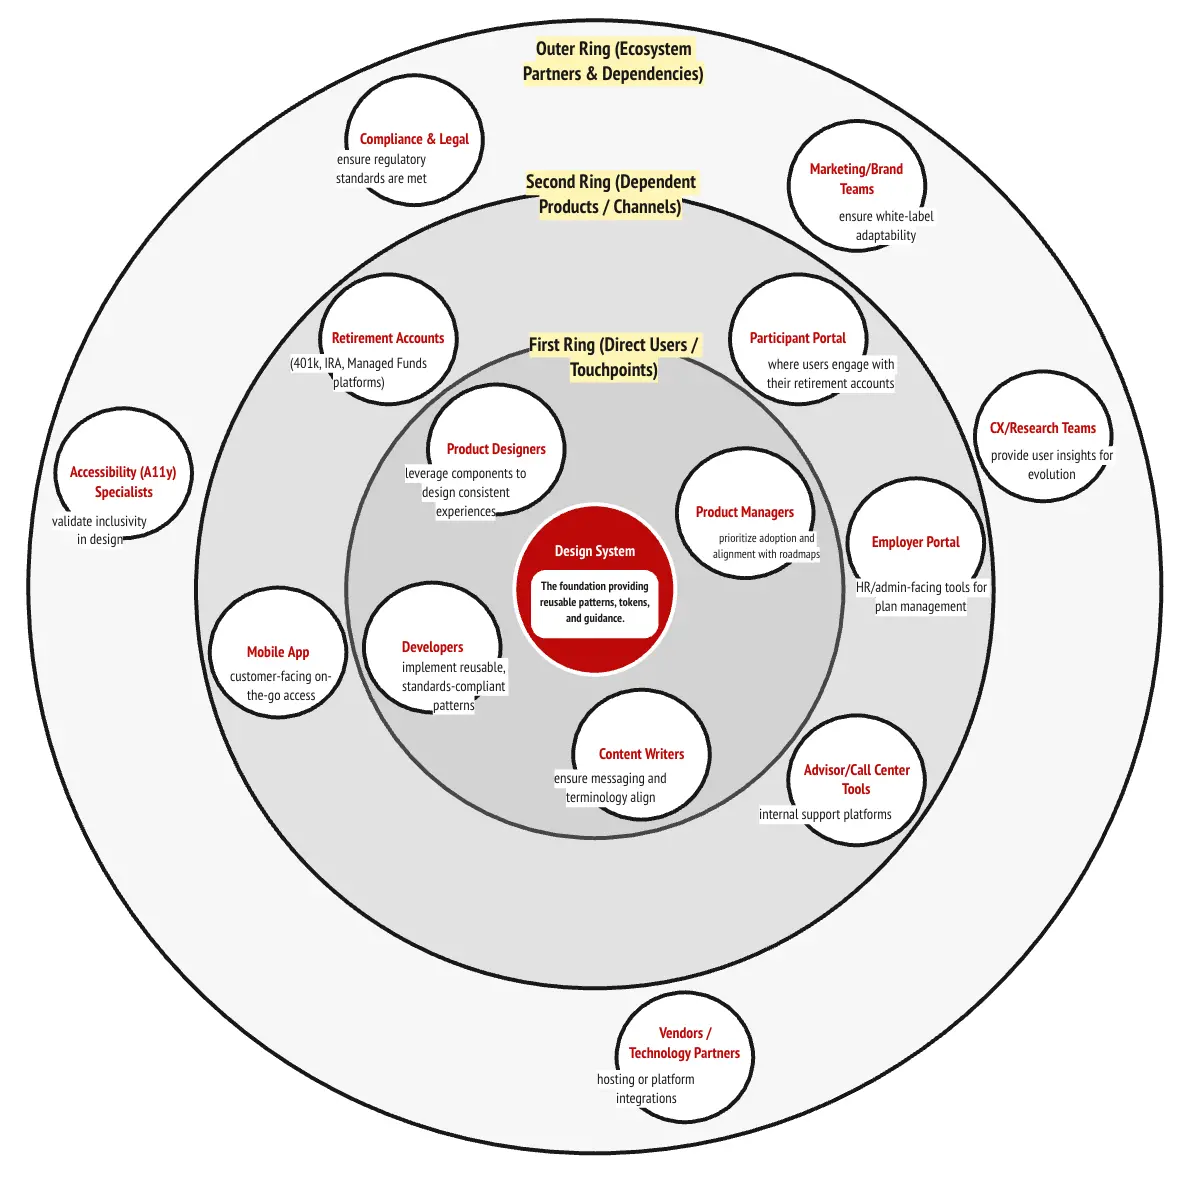
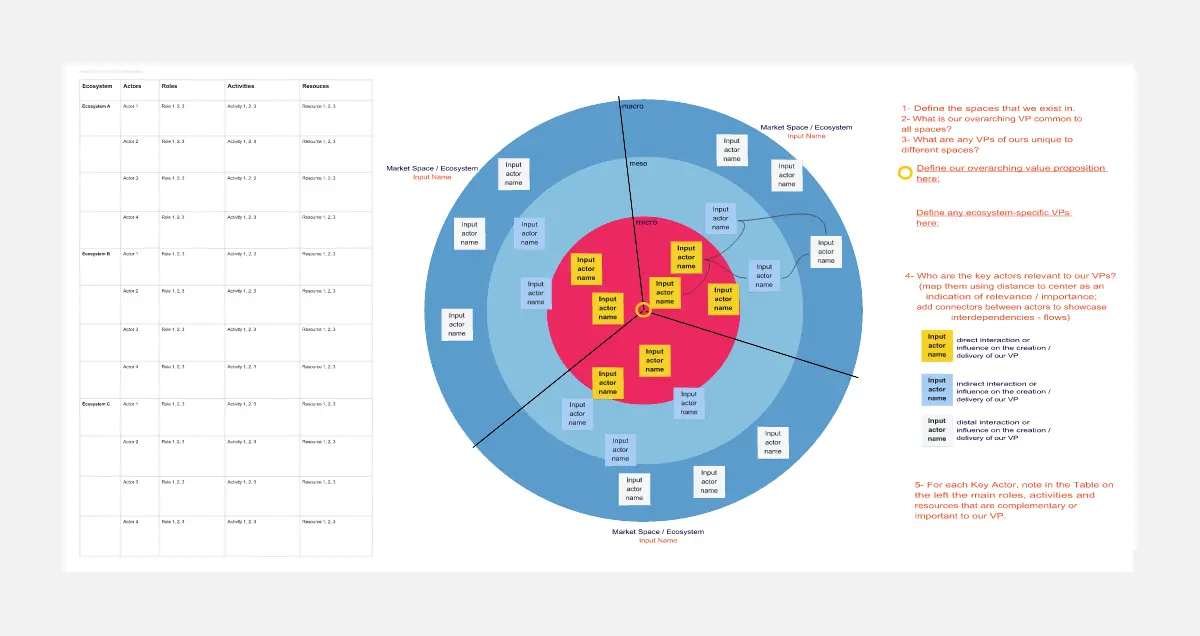
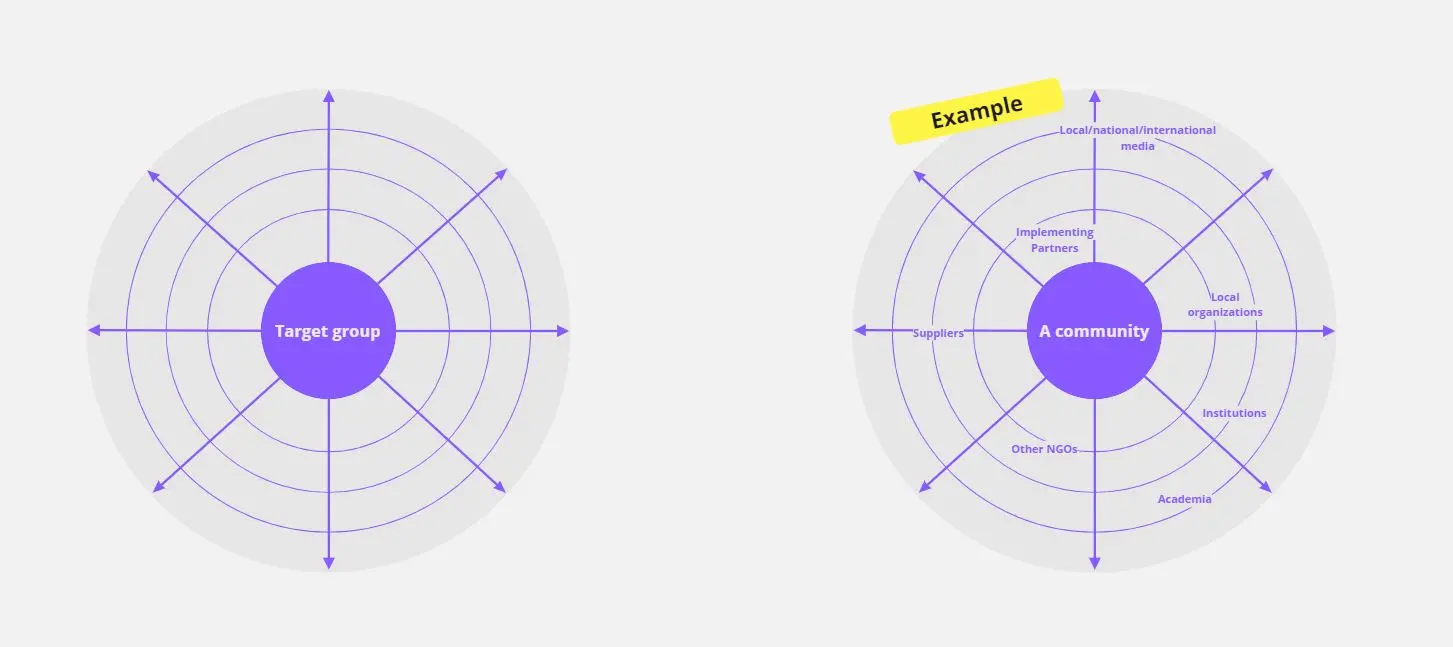
The Radial Stakeholder Map:
Best For: Corporate social responsibility and brand positioning.
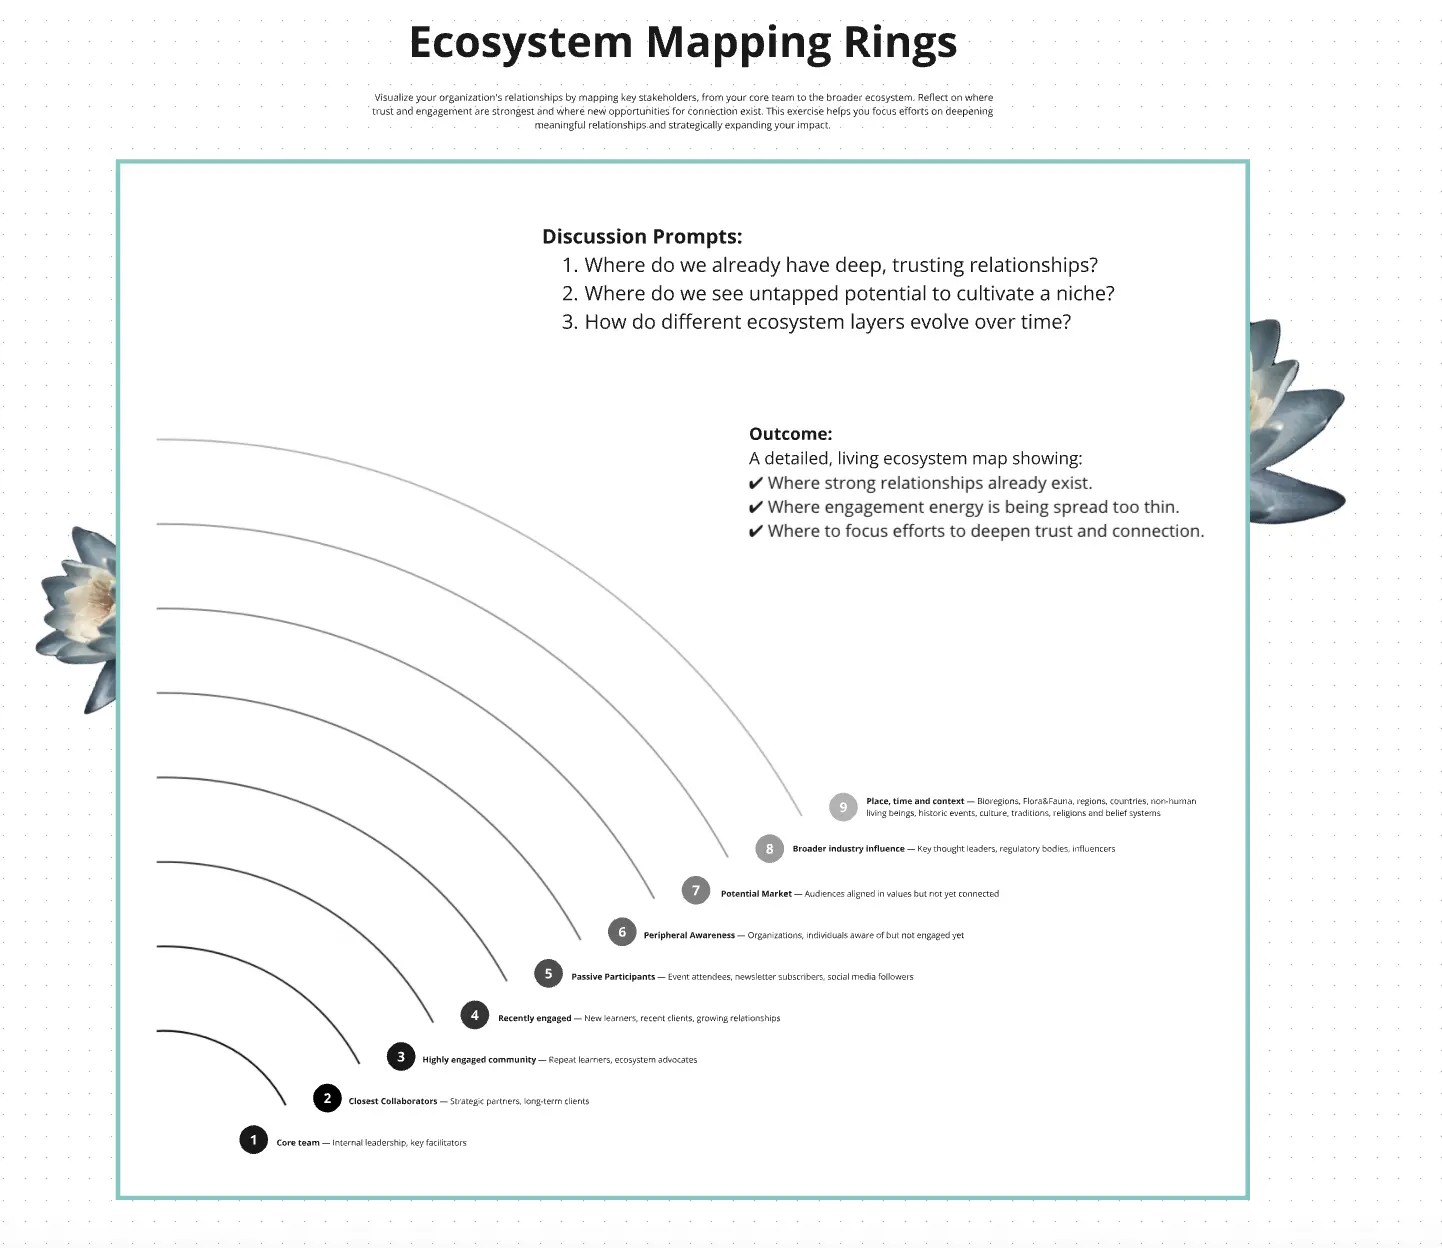
The Structure: Your company at the center, with circles radiating outward (Direct, Indirect, Macro-environment).
The Platform Ecosystem Canvas:
Best For: Software-as-a-Service (SaaS) or Marketplace businesses.
The Goal: To map the interaction between Owners, Providers, and Producers.
The "Sun and Planets" Map:
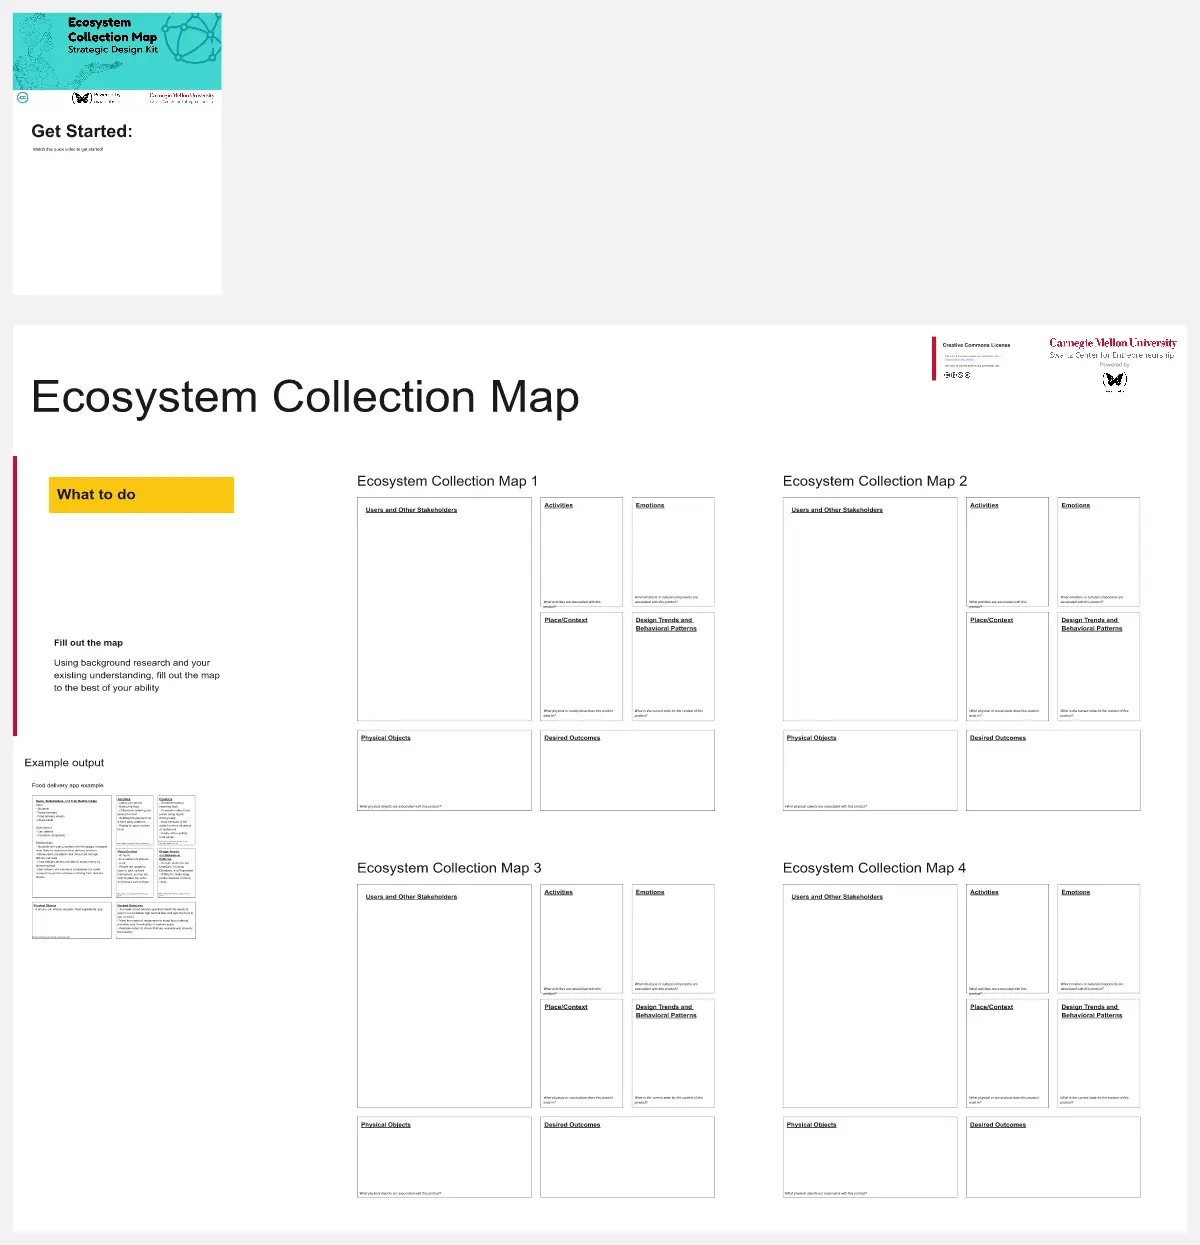
Key Components of an Ecosystem Mapping Template
A high-performance Ecosystem Board requires these five core elements:
The Core Entity: Your business or the specific product being analyzed.
Actor Categories: Grouped by "Tiers" (e.g., Demand Side, Supply Side, Institutional).
Relationship Vectors: Lines labeled by the type of value being exchanged (e.g., "$", "Data", "Leads").
The "Hazard" Zone: A space to mark external threats like "Emerging Tech" or "Regulatory Changes."
Opportunity Clusters: Highlighted areas where two actors could be connected to create a new revenue stream.
![Ecosystem Map [Research]](https://template-metadata-service-static.miro.com/images/templates/2FkebAe3rEAbOqpDTiLJuW/preview-1705845924835.webp)