Table of contents
Table of contents
What is a bubble map, and why should you use one?
Summary
In this guide, you will learn:
- What a bubble map is: a visual tool that organizes ideas or data points as connected bubbles, showing relationships and hierarchy.
- How Miro’s bubble map templates enhance visualization, organization, and collaboration.
- Steps to create a bubble map in Miro: select a template, add and connect ideas, then customize.
- The ability to collaborate in real time on bubble maps within Miro, enabling simultaneous team input.
- How bubble maps can be used for presentations and shared as images or PDFs.
- The flexibility of bubble maps to represent multiple data dimensions through size, color, and placement for clearer insights.
Collaborative AI Workflows
Join thousands of teams using Miro to build the right thing, faster.
Most project management tools focus on organizing people, resources, or tasks. However, bubble maps and other mind maps have a more fundamental purpose. They can help you deepen understanding of underlying concepts and clarify your thought process. Creating a bubble map can reveal assumptions and shed light on new solutions.
Bubble maps may be of most use in the planning stages of a project when you’re uncovering the nature of a problem and how you’re going to solve it. However, they can be useful tools at any point in your project and even in your daily life.
What is a bubble map?
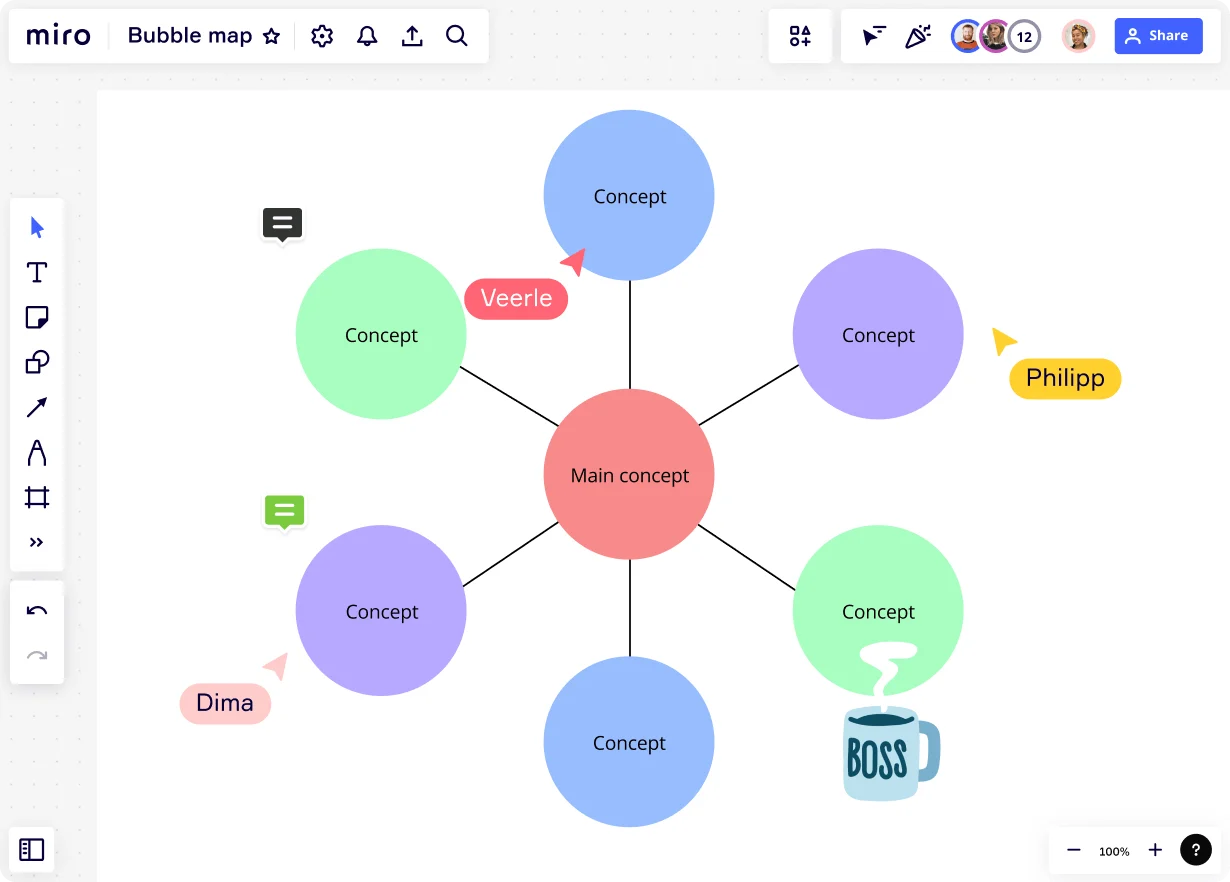
A bubble map is a basic way of graphically representing a thought process. It starts with a noun or concept in a central circle or “bubble.” From that central concept, radiating lines are drawn to other bubbles filled with related concepts. In some cases, more lines can be drawn from the related concepts to more bubbles with other concepts.
The only limits are practical ones, based on what you find helpful. There is even a variation that allows you to compare two central concepts called the “double bubble map.”
Mind maps and organizing thoughts
A bubble map is an example of a more general idea, the mind map, which uses a variety of strategies to visually represent a thought process. Thinking through a problem or task is rarely an organized process, as the human mind is more like a junk room than a well-indexed library. Putting your thoughts down in an organized way can reveal unexamined assumptions, gaps in thinking, or key concepts.
What makes a bubble map different from other mind maps?
Not all mind maps are the same, and most were created with specific aims in mind. For example, a flow map helps you clarify the order of tasks. A tree map might help you break down concepts into categories. A bubble map, on the other hand, helps describe a concept and clarify its relationship to other concepts.
In fact, it can express more than one type of relationship. Connecting each idea to the central concept is one way. However, the branching ideas can also be different sizes or different shapes. As a result, a bubble map can also express hierarchies of importance or other types of relationships.
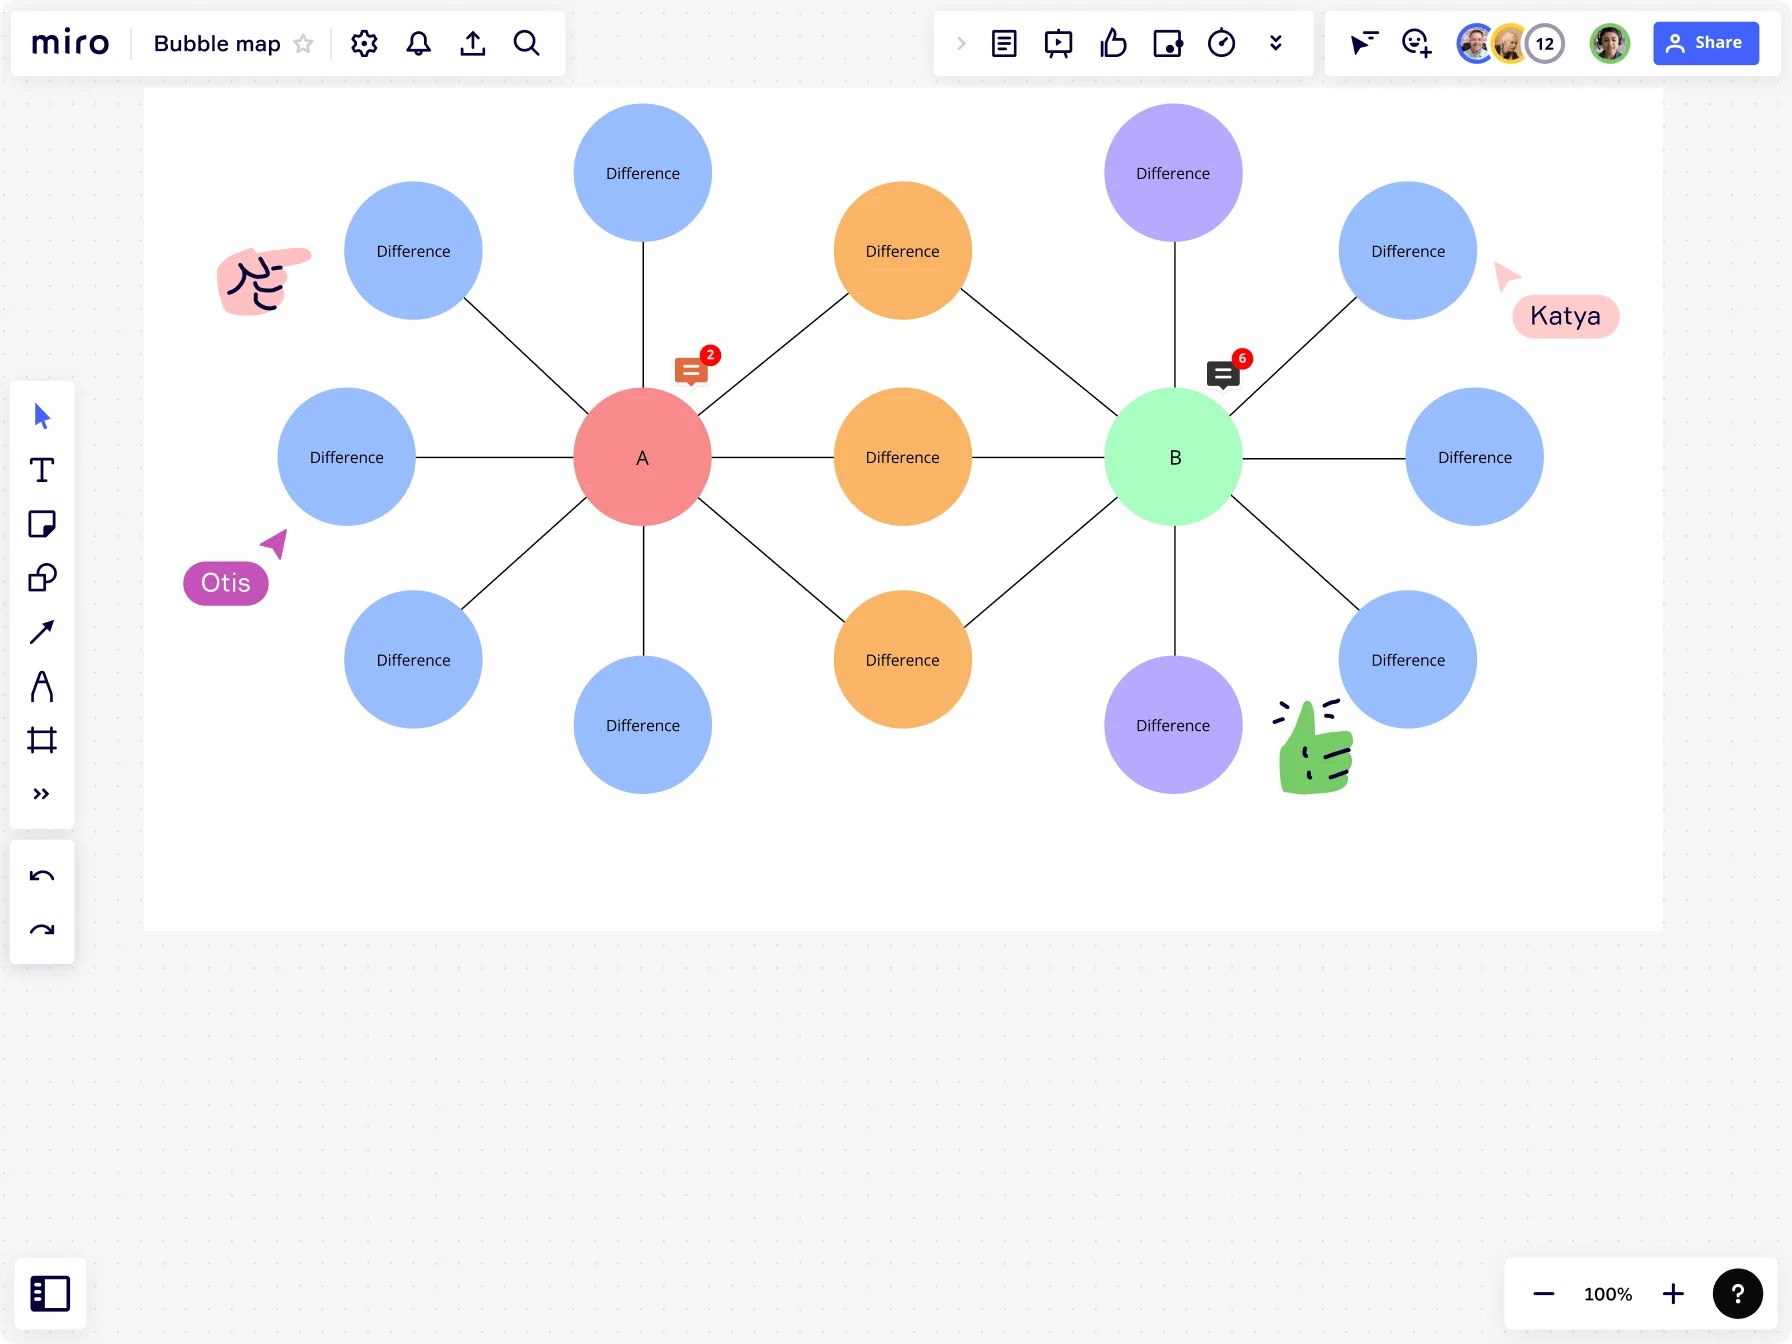
The double bubble map
A related concept is the double bubble map, which allows you to compare two related central ideas. Using a double bubble map makes it easy to see which connections the central ideas share and where they are different.
It allows you to compare central concepts in a way similar to a Venn diagram. However, that type of diagram is limited in how ideas can be expressed. A bubble map allows you to depict several different kinds of similarities and differences.
Bubble maps vs. cluster maps vs. bubble plots
The term “bubble map” can be used to describe several ways of visually representing data. However, those other methods actually have their own uses and aren’t really the same thing as bubble maps.
Cluster maps
Cluster maps are also called “bubble charts,” so the name is similar, but they are quite different from bubble maps. You may have seen an example of a cluster map during the COVID pandemic. It’s a simple map with bubbles in different geographical locations. The size of the bubble indicates the size of the relevant population for whatever it is you’re measuring. For example, a bigger bubble might have indicated a larger number of infected people.
Bubble plots
When a graph uses bubbles rather than points to plot data, that’s called a bubble plot. They are often used when exact information may be lacking. The bubble can indicate a range on the graph rather than a specific value.
Why use a bubble map?
A bubble map is most helpful when you have a few ideas to start with but want to understand them in more detail, as well as how they relate to other ideas. Unlike some project management tools, there aren’t specific problems they are designed to solve. Instead, bubble maps can be used anytime you feel your thinking could use some clarification.
What sort of questions does a bubble map answer?
Most mind maps are helpful when you’re trying to turn ambiguous understanding into something more concrete. The term “mind map” is apt, as the idea is to explore your own or your team’s thought processes. As a result, bubble maps are well-suited for answering questions that may not have simple answers or which may have multiple answers. They are also useful when you’re unsure which questions to ask.
Benefits of using bubble maps
- High-level visualization - See how relevant concepts are related.
- Improve critical thinking - Reveal gaps in knowledge and important connections.
- Brainstorming - There are few rules, which makes it great for throwing ideas together.
- Aid to memory - Writing down concepts and connections can make them easier to remember.
- Improve comprehension - By mapping out how concepts are connected, you can fully understand them.
Drawbacks of using bubble maps
- Limited by simplicity - It can’t easily represent complex organizations or ideas.
- Not easily understandable - Because it’s a map of your or your team’s thought process, it may not make sense to others without explanation.
- Signal-to-noise ratio - It may sometimes be challenging to tell a helpful connection from a random idea that popped up.
Bubble maps can be an extremely useful tool in many situations. However, in some cases, it may be more confusing than useful. Seeing some examples may help clarify when bubble maps are most helpful.
Bubble map examples
By design, bubble maps don’t come with a lot of rules or guidelines for their use. As a result, it can be a little difficult to get a clear idea of how they work. Use these examples as a guide for creating your own bubble maps.
Understanding concepts
Bubble maps are essentially visual representations of how concepts relate to each other. By laying out those relationships, it’s often possible to reach a greater understanding of how an idea fits into other concepts. You can also use a bubble map as a visual aid to help other people understand concepts by depicting them graphically.
An example might be discussing electricity, something we all encounter and use daily, but which nevertheless can be confusing. In the center focus bubble, you’d write the word “electricity.”
In connecting bubbles, you could then write supporting concepts like “positive,” “negative,” and “flow.” If you’re more interested in electrical work, you might instead connect ideas like “ground,” “alternating current,” or “direct current.”
Writing an essay
You have a topic to discuss or a question to answer, but you're unsure how to begin. Using a bubble map can help get you started with topics to investigate and write about. It can even help you narrow down a thesis so your writing is more focused.
Brainstorming is often the first step in writing something new, which is a great use for bubble maps. For example, you may start with a general topic like gardening but not have a specific focus for the essay. With gardening in the central bubble, you can begin making connections to other ideas, like producing food, growing flowers, watering, or fertilizing.
From there, you might do some research into each subtopic to find a thesis, use each as a section of the essay, or prompt some other research points.
Breaking down requirements
The central concept can be a problem or project element. By mapping out related tasks or thoughts, you can clarify the steps and resources needed to address your issue. It can also help establish role responsibilities or clarify many other business questions.
For example, an account manager might have a variety of responsibilities, depending on the type of account, the sector of business, and the specific company they’re working for. However, a manager could use a bubble map to begin concretely defining the responsibilities for that role by linking related tasks.
You can use bubble maps in a similar way for defining requirements for a project or mapping a process. For example, you may be tasked with finding a new location for your company.
There are a couple of different candidates for the central concept in that case, such as “facilities,” “building,” or “space.” Each might be worth exploring for different reasons, as they each might give rise to relevant and useful considerations.
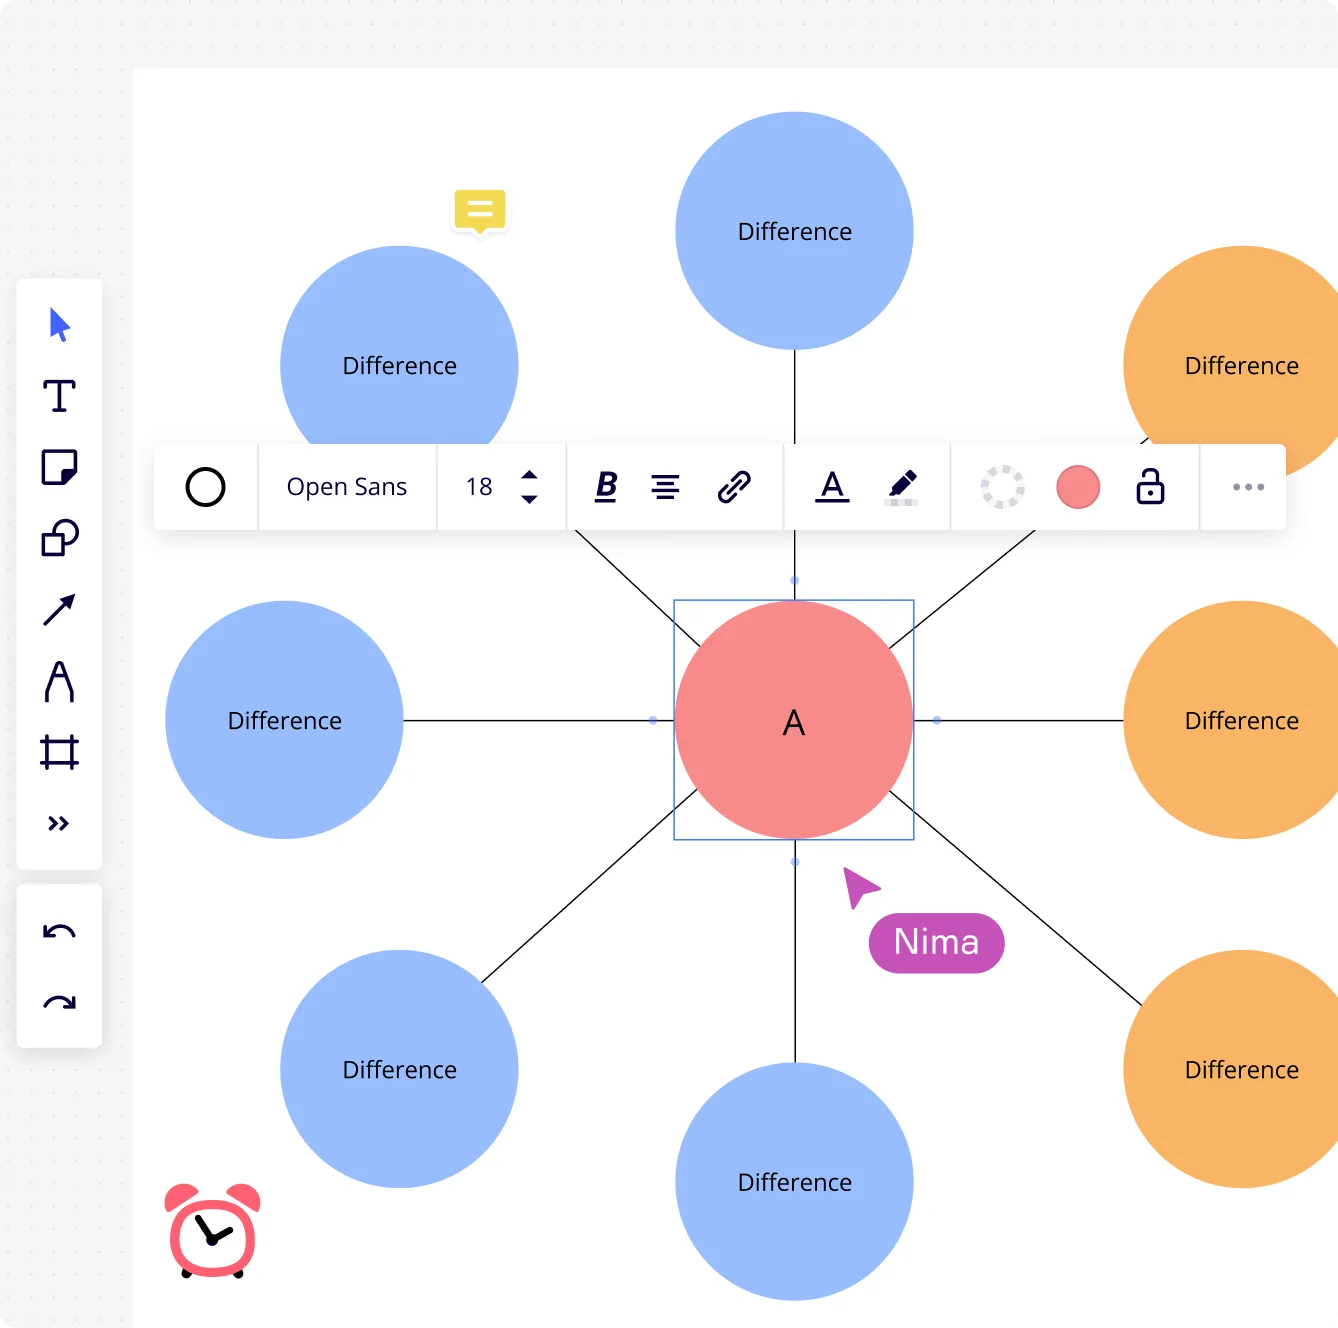
How to make a bubble map
Making a bubble map in Miro is very straightforward, as there are several options for getting started and many supporting tools. Additionally, you can invite team members and collaborators into your Miro board, so you can clarify your thought process or ask them to share theirs.
You can start from scratch using the basic tool set to create bubbles and connectors. Or you can use a bubble map templates to guide you. Regardless of your chosen method, the steps for creating a bubble map are broadly the same.
Step 1
The first step in any bubble map is to place the concept you’re focusing on at the center. That central idea may already be clear, making this step straightforward. However, you may also have to articulate that idea yourself, which can be more difficult.
Remember that it should be simple, as a bubble map works best when working in broad strokes. It doesn’t have to be limited to one word. However, it should be a noun, meaning a person, place, or thing.
Step 2
Begin adding connecting ideas around the central concept. These are usually supposed to be adjectives linked to the central concept, but they can also be linked nouns. As with the central concept, simple ideas are better, but they can be phrases or even short sentences.
When you’re first starting, you may want to add whatever ideas seem like they might be relevant. However, if you think certain types of connections may be more relevant or helpful, you may want to focus there. If possible, fewer but more relevant connections might be a better way to go.
Step 3
Add further connected ideas. You can add subsidiary ideas to the adjectives you connected to the central concept, creating two levels of relationships. Hopefully, at this point, you should have some helpful connections that can direct your thoughts or provide the information you need.
You can also go back and add other types of relationships. For example, more relevant adjectives and connected ideas might have larger bubbles. More tenuous connections might be indicated with dotted lines.
Author: Miro Team
Last update: October 10, 2025