No business operates without problems along the way. But to solve them in time, you’ll need to be able to determine the cause quickly. That’s where using a fishbone diagram comes in.
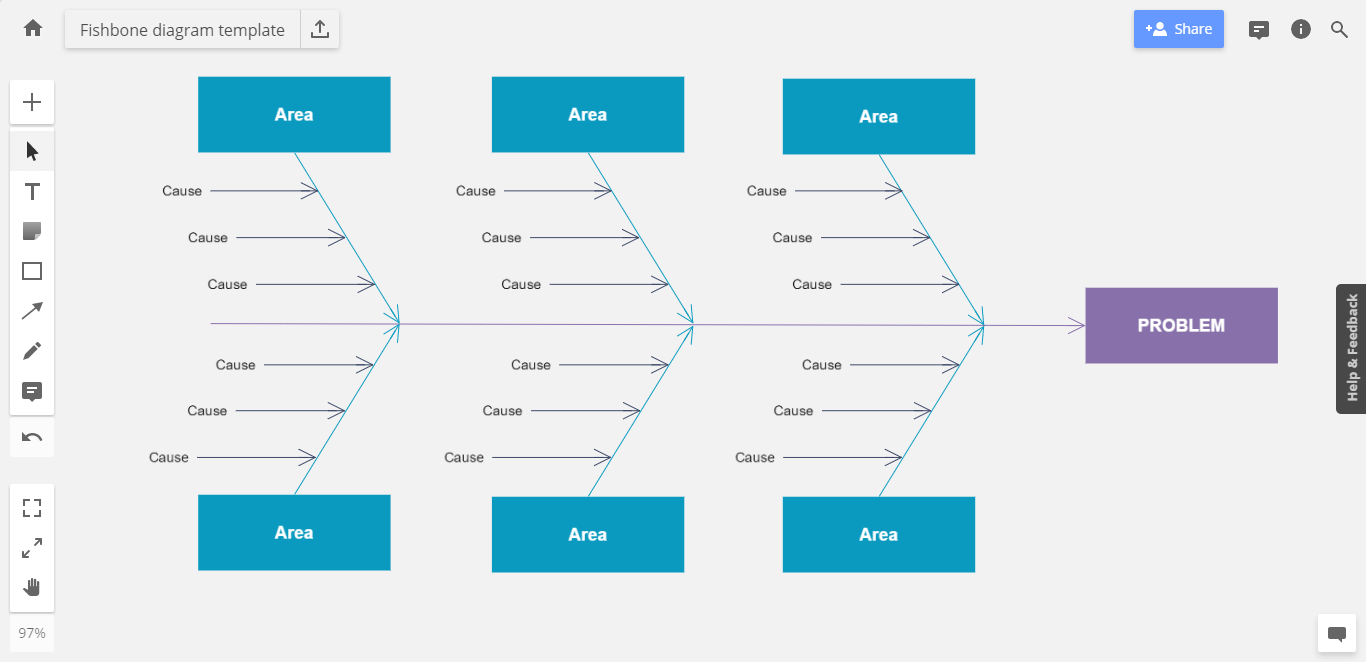
A fishbone diagram, also known as the Ishikawa diagram or cause-and-effect diagram, is a tool you can use to visualize all of a problem’s potential causes, allowing you to discover the root causes and identify the best possible solution.
We put this guide together to show you how to make a fishbone diagram based on a fictional problem we’ll be investigating: why a software company’s customer churn is so high.
Let’s get started.
Step 1 – Define the problem
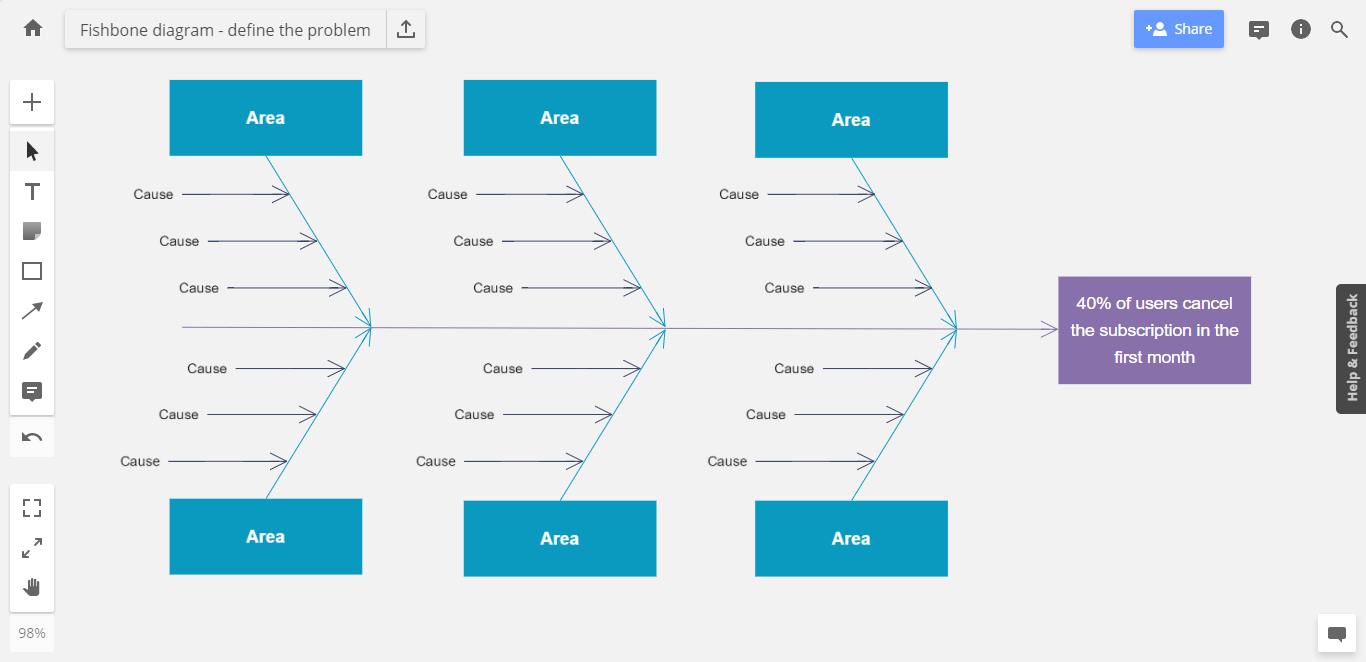
The first step to solving any problem – and the key to learning how to make a fishbone diagram – is correctly defining it. A clearly defined problem makes it easier to identify causes. It also encourages us to determine whether there’s even a problem to begin with.
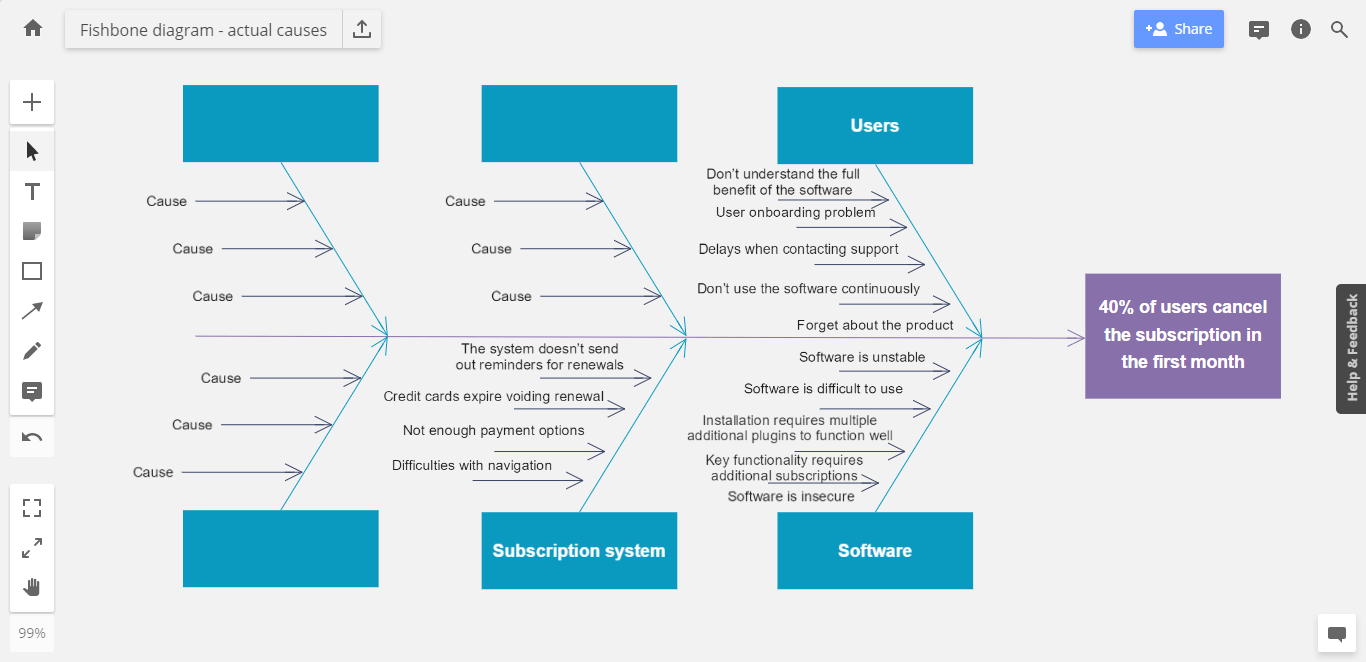
In this case, the problem we’ve identified is that 40% of users cancel their subscriptions after the first month — which keeps us from reaching our goal of keeping cancellations below 20%. Now that we’ve identified our main problem, we can go ahead and add that to the fishbone diagram.
Problem definition tips:
- If you’re using the fishbone diagram to design a process or increase productivity, it’s just as important to correctly define your output. Your goals should be objective and achievable.
- Place the problem (the fish head) on one side of the diagram, and build the rest of the diagram (the fish bones) out to its left or right. The idea is that the “fish bones” indicate the impact of the causes.
- Place the causes with the biggest impact closer to the fish head and the causes with the smaller impact further away.
Step 2 – Decide on key categories of causes
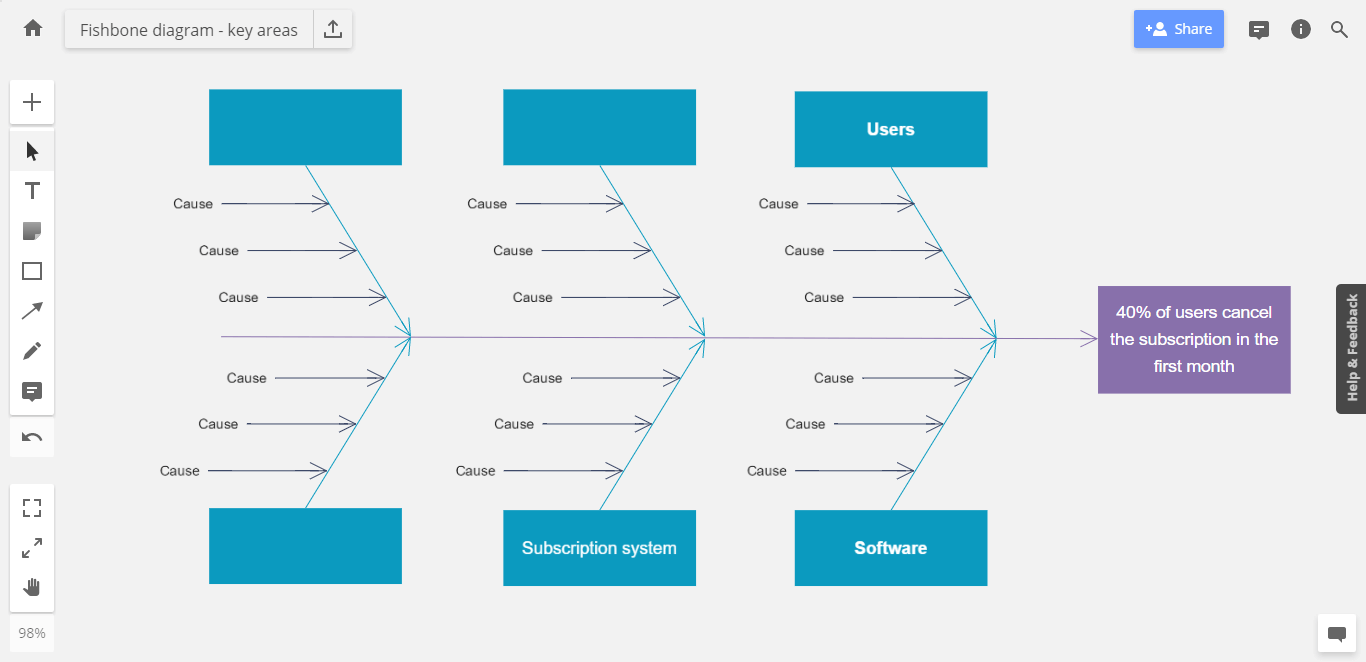
Next, decide what areas of the problem are key to determining the actual cause. Going back to our example of investigating a high churn rate, here are three areas worth looking into:
- Users
- Software
- Subscription system
Once you start considering potential causes, you might find that most of them fall within one of these three categories. But you can always add more categories if needed. For example, If you think marketing impacted your retention figures, you could add that as a fourth area.
You can have as many areas as you need to. But to keep things simple, we recommend limiting yourself to no more than 10 — especially since we’re only learning how to make a fishbone diagram with this example.
Step 3 – Determine the actual causes of the problem
Now that you’ve defined the key areas to look into, let’s go through each one to determine all the individual influences that can affect our output. Look at each category and list every possible cause you can think of.
Looking at the subscription system, some possible causes include:
- We aren’t offering enough payment options
- The payment and registration systems are difficult to navigate
- Credit cards expire, voiding renewal
- The system doesn’t send out reminders for renewals.
When considering the user, potential causes include:
- Users don’t understand the full benefit of the software
- Users don’t know how to use all the functions
- Users experience delays when contacting support
- Users don’t use the software continuously, only requiring it for a few days at a time
- Users forget about the product.
When it comes to the software itself, potential causes may be:
- The software is unstable and crashes regularly
- The software is difficult to use
- Software installation requires multiple plugins to function well
- Key functionality requires additional subscriptions
- The software is insecure.
These are just a few potential causes. You should fill your fishbone diagram with as many different causes as you can come up with. Note that not every area of your diagram needs to have causes. Some might even have more causes than others.
Regardless, you now have a starting point to determine root causes. To keep going, investigate each cause to establish its actual effect on your output.
Tips to determine the actual cause:
- Run a brainstorming session or lay out a process map to generate better causes for your fishbone diagram
- Invite other team members in the process to make sure you’ve identified all the potential causes
- Some causes may have multiple sub-causes. Expand your fishbone diagram as needed to encompass all possible causes.
Step 4 – Using tools to plan the way forward
Remember, a fishbone diagram helps identify a problem’s causes. It doesn’t lead to solutions on its own. In fact, part of learning how to make a fishbone diagram is knowing what other tools you can use to identify causes more effectively.
Here are a few more tools to help you take your fishbone diagram to the next level:
Process Map
A process map is a flowchart of a specific system, showing all its inputs and outputs. It works best in areas like the manufacturing industry, where each product has a clearly defined process with multiple steps.
Process mapping involves looking at each step of the process one by one and listing all the potential influences. In an actual manufacturing environment, this may include being present on the production line and viewing the system, taking notes as you go through the process.
A process map is very effective at making sure you consider all the steps and influences involved in a system. In other words, it helps you clearly identify potential causes and add them to your fishbone diagram.
Brainstorming
Brainstorming is a fairly common tool in modern businesses. Instead of considering all the factors of a fishbone diagram by yourself, include others in the process. When working alone, it’s easy to overlook certain areas and completely miss others.
That’s why it’s worth making sure your brainstorming session takes the shape of a clearly-defined meeting. Have someone lead the session, taking note of any ideas team members offer up and leaving room for discussion. The goal is to end the brainstorming session with a list of causes to add to your fishbone diagram.
Once you’ve filled out your fishbone diagram, make sure everyone’s on the same page about how to follow up — whether it’s about delegating tasks or setting clear deadlines.
Tips for planning next steps:
- Not sure what causes to investigate? Collaborate with your team members on developing a cause-and-effect matrix. This way, you’ll get to rank causes by priority based on your team’s experience.
- Want to address a problem’s root cause and not just its symptom? Use our 5 Whys Templates to take a closer look.
How to make a fishbone diagram in a remote team
A fishbone diagram is more effective when multiple people get involved in creating it. But if your team works in remote and hybrid settings, you’ll need a tool designed to facilitate seamless collaboration.
Miro’s visual workspace is built for collaboration, making it easy to make a fishbone diagram together in real time — even if you aren’t in the same room. Seamlessly build diagrams using our intuitive, automated diagramming tools and our drag-and-drop, infinite canvas.
Not sure how to make a fishbone diagram from scratch? Save time using our free Fishbone Diagram Templates. It’s fully customizable, allowing your team to add as much detail as you want and adjust its look and feel.
Tips for collaborating on a fishbone diagram in Miro:
- Invite your team to edit your board with you in real-time
- Invite stakeholders to view and comment on your Miro board for instant feedback
- Differentiate ideas by color-coding them
- Use frames to present your fishbone diagram and easily export it as a PDF or image
- Use sticky notes to add important context when building your fishbone diagram
Above all, avoid trying to build your fishbone diagram too quickly. Take the time to understand all the contributing factors, and make sure that anything you add to the fishbone diagram adds value.
When to use a fishbone diagram?
Though fishbone diagrams were originally meant for problem-solving, they’re far more versatile — helping you break down any process or system into its contributing factors.
Here are a few use cases where knowing how to make a fishbone diagram comes in handy:
- To analyze a problem statement
- To brainstorm the causes of the problem (root cause analysis)
- To analyze a new design
- Process improvement
- Quality improvement
When in doubt, talk to your team to clarify the problem you’re investigating and how a fishbone diagram would help.


