Table of contents
Table of contents
What is a genogram?
Summary
In this guide, you will learn:
- What a genogram is: a detailed family tree mapping relationships, dynamics, and patterns across generations.
- How genograms differ from traditional family trees: they include emotional, social, and health information, not just lineage.
- Common genogram symbols: squares for males, circles for females, lines for relationships.
- Practical uses of genograms: understanding family dynamics, hereditary issues, and individual roles in social work and therapy.
- Genogram structure: males left, females right, generations vertically oldest to youngest.
- Genograms vs. ecomaps: genograms focus on family members; ecomaps include non-family relationships and environmental factors.
Collaborative AI Workflows
Join thousands of teams using Miro to build the right thing, faster.
Introduction to genograms
A genogram is a sophisticated tool that provides a detailed graphical representation of a family's structure, capturing not only the genealogical connections but also incorporating layers of emotional, social, and medical information. Distinguished from a traditional family tree, a genogram offers a comprehensive view of hereditary, psychological, and relational patterns across generations. As such, creating a genogram can provide a comprehensive view of a family's history, relationships, and potential future trends.
Components of a genogram
A genogram is composed of several key elements, each contributing vital information to the overall understanding of family dynamics. The primary components include:
Basic symbols: At its core, a genogram uses standard symbols to represent individuals and their gender. These symbols form the basis of the genogram structure.
Lines and connections: Lines are used to depict different relationship dynamics. Solid lines indicate strong, positive connections, while dashed or broken lines suggest strained or distant relationships. In addition, specific patterns like zigzag lines can represent conflict or turmoil.
Generational layers: Genograms are typically organized into layers by generation, allowing for a clear view of familial patterns and hereditary traits across different age groups.
Color coding: To enhance clarity and provide additional layers of information, genograms often utilize color coding. Different colors can signify various aspects such as emotional states, medical conditions, or even social affiliations.
Annotated information: Beyond symbols and lines, genograms include detailed annotations. These can encompass medical histories, major life events, psychological issues, and other pertinent personal details.
Patterns and tendencies: One of the most valuable aspects of a genogram is its ability to highlight recurring patterns and tendencies within a family, such as health-related issues, behavioral patterns, or relationship dynamics.
Cultural and social Factors: Genograms may also incorporate elements that reflect cultural, social, or religious influences on the family structure and individual behaviors.
What should be included in a genogram
Creating a comprehensive genogram involves more than just plotting family members and their relationships. It requires a detailed and thoughtful representation of the family's history, dynamics, and patterns. Here’s what should typically be included in a genogram:
Family members: Include as many family members as possible, spanning at least three generations. This should encompass immediate family members, such as parents, siblings, and children, as well as extended family, including grandparents, aunts, uncles, and cousins.
Relationship details: Clearly depict the nature of relationships between family members. This includes marital status (married, divorced, separated), quality of relationships (close, estranged, conflicted), and any significant non-biological connections (adoptions, guardianships).
Dates and major life events: Incorporate important dates such as births, deaths, marriages, and divorces. Major life events like immigration, significant illnesses, or notable achievements should also be included, as they can have profound impacts on family dynamics.
Health and psychological information: Document hereditary health issues, chronic illnesses, mental health conditions, addictions, or disabilities. This information is crucial for understanding potential genetic patterns or health risks within the family.
Socioeconomic status and education: Including information about the family’s socioeconomic background and educational levels can provide insights into the family’s social context and values.
Cultural and ethnic backgrounds: Acknowledge the family's cultural, ethnic, and religious backgrounds, as these can influence family dynamics and values.
Repetitive patterns and behaviors: Identify and mark any patterns that recur in the family, such as specific health issues, relationship dynamics, career paths, or behaviors.
Emotional relationships: Use specific symbols to denote the emotional nature of relationships within the family, such as close, strained, abusive, or supportive connections.
Example of a genogram
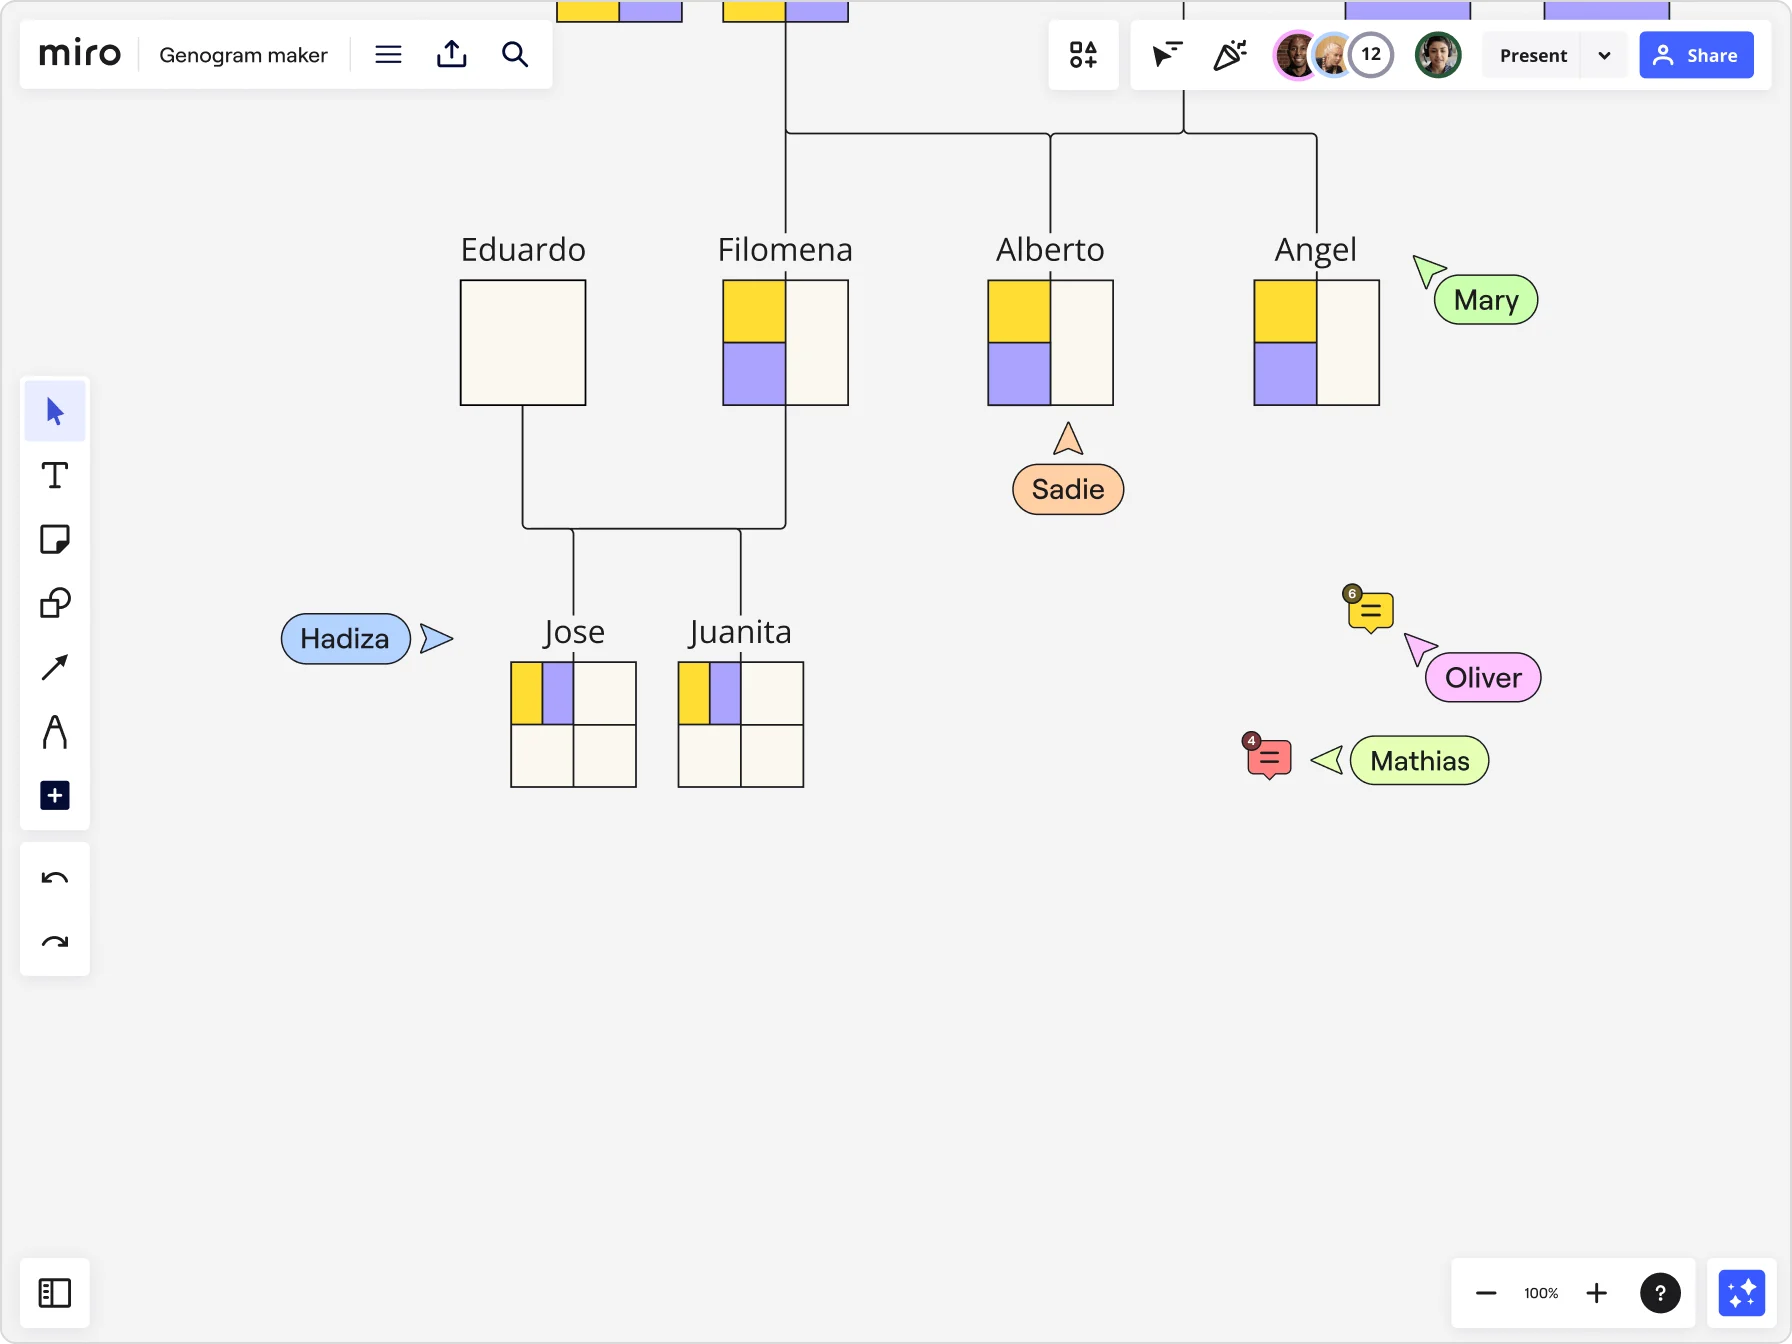
This genogram created using Miro is an example of how the relationships and members of a family can be mapped across multiple generations.
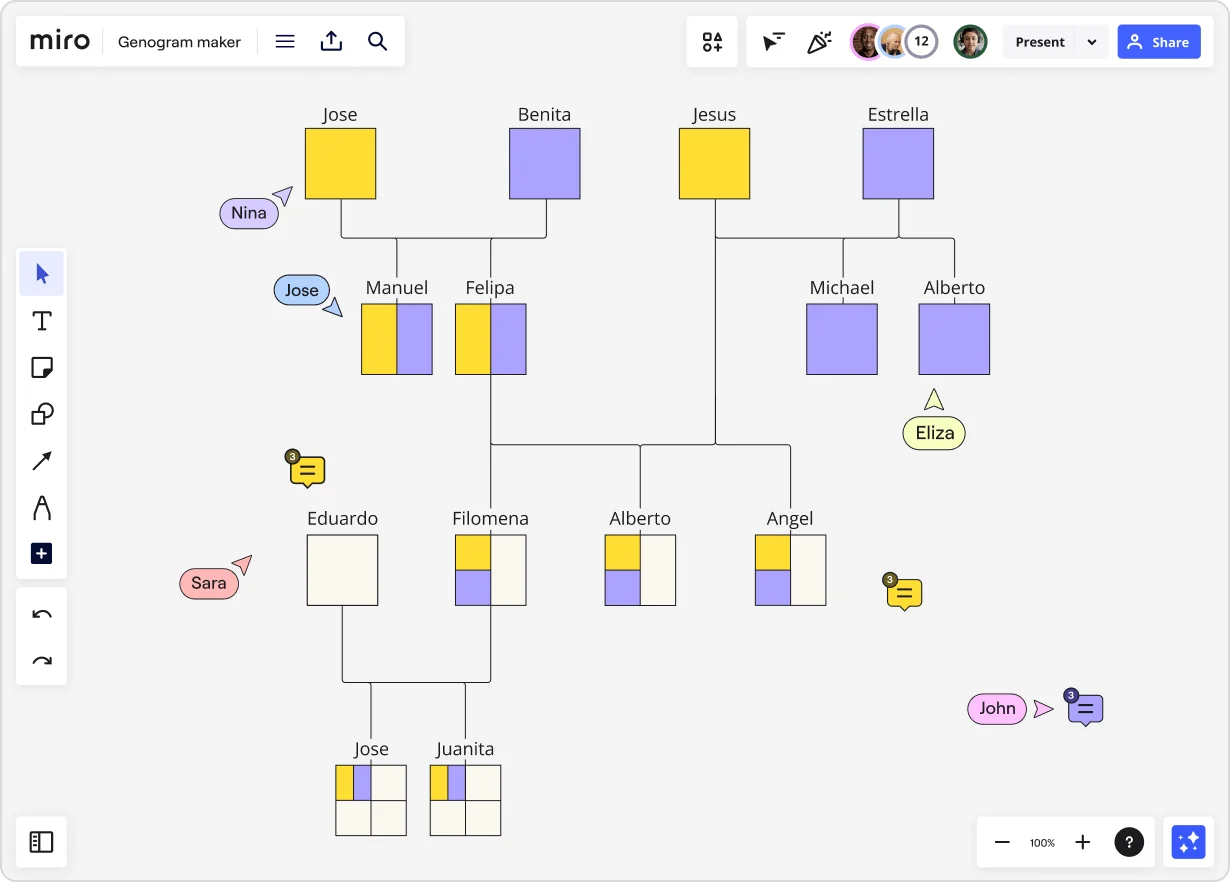
At the top, we see the oldest generation with Jose and Benita, and Jesus and Estrella. Moving down a level, their children and their respective spouses are displayed. For example, Jose and Benita have two children, Manuel and Felipa, denoted by the connecting lines. Further down, the third generation shows the children of this generation, such as Felipa’s daughter Filomena and her partner Eduardo. In this example, the colors purple and yellow are used to indicate genetic traits and their likelihood of being passed down.
This genogram example, while simplified, serves as a foundation for understanding the complexity and depth a full genogram can provide when fully annotated with detailed symbols and legends.
Author: Miro Team
Last update: October 9, 2025