You and your team are getting ready to tackle a new project. You have a pretty good sense of what tasks and milestones are required to get across the finish line.
But, ask yourself this: Do you have a strong grasp on the flow of those tasks? Do you know which ones are dependent on others? Do you know how long each of them will take? Do you understand who is responsible for each one?
When you’re jumping into a new project –— especially one that’s lengthy or complex –— it’s important to know the answers to those questions in order to ensure that things run smoothly and your timeline is realistic.
Fortunately, it doesn’t need to be a guessing game. A Gantt chart is a simple visual representation of tasks, time, and team members –— and it can help you keep even the hairiest of projects on track.
What is a Gantt chart?
Here’s the simplest Gantt chart definition: It’s a chart that shows the progression of a project’s tasks related to time.
Gantt charts show the project’s timeline across the top of the chart. Tasks are displayed as horizontal bars that span the total amount of time they’ll take.
That’s the gist. But, when it comes to answering the question “what is a Gantt chart used for?” these visual tools can display even more information, including:
- Stakeholders responsible for each task (by listing their name on or near the taskbar)
- Task dependencies (often shown with an arrow between taskbars)
- Task overlaps (displayed by taskbars that run on top of each other during the same span of time)
Regardless of the additional information you incorporate, a Gantt chart is a simple and intuitive representation of your project’s tasks, the order that they happen in, and how long they’ll take.
Gantt chart example
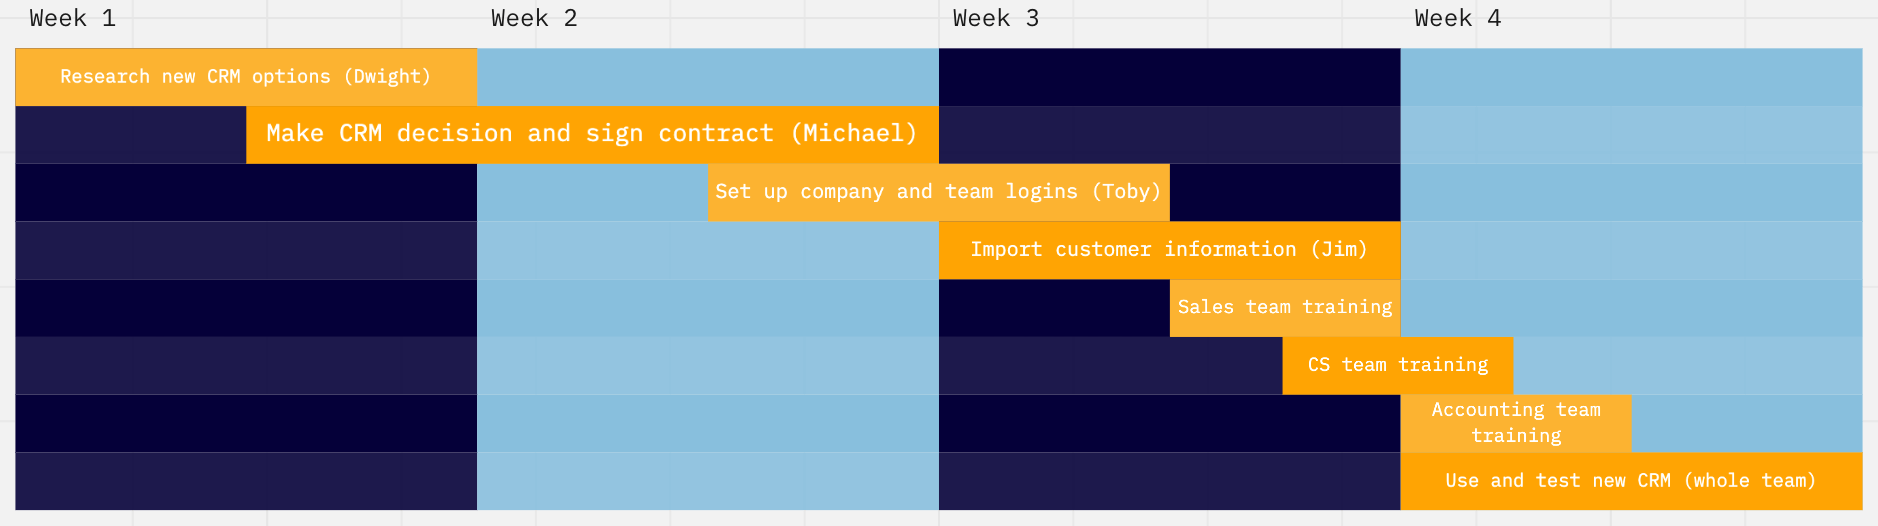
Gantt charts don’t have a huge learning curve, and they’re even easier to understand when you look at a Gantt chart sample. Here’s a simple Gantt chart example that displays the project tasks related to moving to a new customer relationship management (CRM) software:
Learn more about Miro
5 must-know benefits of a Gantt chart
Why use a Gantt chart as opposed to keeping all of those tasks and timelines in your head? Creating a Gannt chart for your project offers a number of advantages, including:
- Increased accountability: The Gantt chart clearly spells out which team members are responsible for which tasks. Additionally, it reinforces the point that the project is a line of dominoes — if one task runs late or falls short, it can impact the entire project. That helps instill a greater sense of accountability on a project team.
- Accurate planning: It’s tempting to think of project tasks in isolation, but a Gantt chart displays task dependencies and overlaps. Not only does that help you be more efficient by identifying tasks that can happen concurrently, but it also keeps the entire team mindful of dependencies so they don’t delay a task that could set the whole project back.
- Realistic timelines: Setting a project timeline and an end date can feel like a guessing game. However, a Gantt chart requires that you break down the duration of tasks on a more granular level. Rather than estimating how long you think the entire project will take to complete, you assign time estimates to each individual task. That leads to a far more realistic schedule and deadline.
- Flexibility: Even the best-laid plans fall apart. Fortunately, if something happens, a Gantt chart can be easily adjusted to extend a task’s duration and bump subsequent tasks back.
- Accessibility and transparency: A Gantt chart is a powerful tool, but it’s also pretty intuitive and easy to grasp — even without any specialized project management knowledge or training. Charts are only useful if the team actually uses them, and a Gantt chart is a resource your entire team will feel comfortable referring back to.
When to use a Gantt chart
A wide variety of industries — from construction or human resources to marketing or software development — use Gantt charts for project planning and monitoring.
Wondering whether or not now is the time for you to use a Gantt chart? Before getting started, you should know the following:
- Tasks involved in your project
- Time estimates for each task
- Intended order of tasks
- Team members responsible for tasks
That’s the information that you’ll need to plot on your chart, and you don’t want to have to figure it out as you go along.
If you have those details in your back pocket, here are a few times you can absolutely benefit from creating a Gantt chart:
- When you need to create a reasonable project timeline
- When you need to understand how various project tasks relate to each other
- When you need to easily display the flow of project tasks
- When you need a simple way to track if your project is on schedule
Still not sure if a Gantt chart is the right choice for you and your project team? Create one and see if it helps you get greater clarity. As with anything within project management, sometimes the best way to discover what works is to try it.
How to use a Gantt chart
Creating a Gantt chart is relatively easy, especially if you get started with Gantt chart templates. But, when it comes to actually knowing how to use a Gantt chart, there are a few important tips to keep in mind:
- Be as realistic as possible when assigning time estimates to tasks. It’s easy to fall victim to the planning fallacy and be overly optimistic about how quickly you can get things done. But, you’re always better to estimate a bit too much time and have a buffer if you need it.
- Understand the use cases. A Gantt chart can be used for many different things, as we outlined in the previous section. However, that doesn’t mean it’s useful in every scenario. If you need to manage budget and resources or give team members a breakdown of individual responsibilities, for example, there are better options than a Gantt chart.
- Refer back to your Gantt chart frequently. A Gantt chart isn’t just helpful for project planning – it’s equally as important for project monitoring. That means it’s not something you and your team should look at once. Continue to refer back to it as you move through your project to ensure you’re sticking as close to your plan and time estimates as possible.
Want to learn even more about how to use this visual tool to your advantage? Check out our guide on how to use a Gantt chart.
Understand what’s happening when with a Gantt chart
You and your team might think you have a solid handle on what’s involved with a project. But, without a reliable plan in place, it probably won’t be long before you realize you’ve dropped a ball, duplicated work, or missed a deadline.
The good news is that a Gantt chart can provide visibility into what tasks are happening when, as well as who is responsible for them.
It removes the guesswork and gives your entire project team an easy-to-use tool to understand the flow of project tasks and the target timeline. The result? More projects completed on time (and with less stress).