Table of contents
Table of contents
How to create an org chart that actually works for your team
Summary
In this guide, you'll learn:
- Why traditional org charts fail (and how to avoid the same mistakes)
- How to build organizational charts in Miro using the dedicated Org Chart widget
- Step-by-step instructions for importing team data and customizing your structure
- How AI features analyze org structures, detect gaps, and model restructuring scenarios
- Best practices for connecting org charts to strategy, planning cycles, and daily workflows
- Common org chart mistakes that create confusion instead of clarity
- How to make your organizational structure a living system that evolves with your team
Overnight, your org chart became guesswork. Your team just doubled in size. Someone left for a competitor. New leadership joined from that startup acquisition. Now, nobody's quite sure who reports to whom anymore.
Sound familiar? You're not the first leader to watch an org chart go from "mostly accurate" to "completely outdated" faster than you can say "restructuring." Teams waste hours tracking down decision-makers, duplicating work across silos, or waiting on approvals from people who no longer have that authority.
The fix isn't just drawing better boxes and lines. Creating an organizational chart that reflects reality requires tools designed for how teams actually work — not static diagrams that become obsolete the moment someone changes roles.
Experience a transformation in organizational planning that keeps pace with your team's evolution. Miro's visual workspace and AI-powered features guide you on a journey from outdated, static diagrams to a dynamic and living system. Witness how proactive planning becomes an integral part of your team's agile workflow.
Collaborative AI Workflows
Join thousands of teams using Miro to build the right thing, faster.
What is an organizational chart (and why most of them fail)
An organizational chart maps reporting relationships, team structures, and decision-making hierarchies across your company. Think of it as the blueprint showing who does what, who reports to whom, and how information flows through your organization.
The problem? Most org charts get created once, saved as a PDF, and immediately start gathering dust. By the time someone references that chart, three people have switched teams and two new departments exist.
This disconnect has real costs. According to Gallup research, employees who strongly agree they know what is expected of them at work are 2.8 times more likely to be engaged. Clear organizational structures help establish those expectations by showing reporting relationships and decision-making authority. A relatable example of this is a marketing team that was tasked with launching a major campaign. The team faced many delays because the org chart was outdated, leaving them unclear on who had the final say on key decisions. As a result, the launch was postponed, impacting quarterly goals. When people don't know who owns decisions, work stalls.
To determine whether your organizational chart stands as a useful tool rather than just decoration, you can use a simple checklist:
1. Is the org chart easy to update?
2. Is it accessible to everyone who needs it?
3. Is it connected to the actual work happening across teams?
Consider if you can tick all three boxes. A self-assessment like this invites immediate application and helps in self-diagnosing the effectiveness of your chart.
Why traditional org chart tools create more problems than they solve
Your HR team probably has an org chart somewhere — buried in a SharePoint folder, living in someone's desktop file system, or worse, trapped inside proprietary software that requires a license just to view it.
These static approaches share common failure points:
Information lives in silos
The org chart sits separate from project plans, strategy docs, and team workflows. Nobody thinks to check it because it's disconnected from daily work
Imagine a day in the life of a project manager trying to coordinate a last-minute deliverable. She spends precious hours searching through email threads and outdated documents, trying to determine who needs to sign off. Everyone she contacts points her in a different direction, each just as unsure as the rest. Meanwhile, the project deadline looms. This frustration is a direct result of siloed information, a barrier that can be removed with more integrated and dynamic organizational tools.
Updates require IT intervention
Making changes means opening specialized software, requesting access permissions, or waiting for the next quarterly review cycle. By then, the changes you needed to document have already happened.
Visual clarity suffers at scale
Traditional tools create sprawling diagrams that require endless scrolling or printing on poster-sized paper. Finding specific people or understanding reporting structures becomes a scavenger hunt.
Collaboration doesn't happen
When org charts live in formats like PowerPoint or Visio, only one person can edit at a time. Gathering input from multiple stakeholders turns into a days-long email chain of conflicting versions.
The best way to create an org chart starts with choosing tools designed for how modern teams collaborate — not legacy formats built for a pre-digital era.
How Miro's Org Chart widget eliminates busywork
Miro's dedicated Org Chart widget transforms organizational planning from a documentation chore into a strategic conversation. Instead of wrestling with rigid diagramming software, you get a purpose-built tool designed specifically for mapping team structures.
Here's what makes it different:
Start with data, not blank boxes. Import your existing org data from spreadsheets, HRIS systems, or CSV files. The widget automatically generates the visual structure — no manual box-drawing required. This cuts initial setup time from hours to minutes.
Update in real-time with your team. Multiple people can edit simultaneously. When the CFO wants to restructure finance reporting while HR maps new roles, both can work in the same chart at the same time. Changes appear instantly for everyone viewing the board.
See the whole picture without the scroll. The widget handles large organizations gracefully. Zoom out for the 30,000-foot view or drill into specific departments without losing context. Finding someone's reporting line takes seconds, not searching through multiple pages.
Connect org structure to actual work. Your org chart lives on the same canvas as project roadmaps, strategic plans, and team workflows. Draw direct connections between reporting lines and the initiatives those teams own. When someone asks "who owns customer success?" you can show both the org structure and their current projects in one view.
The org chart maker approach removes technical barriers so you can focus on the strategic questions: Does this structure support our goals? Are decision rights clear? Do we have the right leaders in the right roles?
Building your first org chart in Miro: a step-by-step walkthrough
Creating an org chart shouldn't require advanced degrees in diagramming software. Here's how to build yours in Miro, from first board to fully functional organizational structure chart.
1. Set up your board and add the Org Chart widget
Open Miro and create a new board. In the toolbar on the left, click the plus icon and search for "Org Chart" in the widget menu. Add the Org Chart widget to your canvas.
You'll see a simple starter structure with a few sample boxes. Don't worry about those — you're about to replace them with your actual team data.
The fastest route to creating an org chart? Import existing data. Click the import option in the widget menu and upload a CSV file containing employee names, titles, and reporting relationships. The widget maps this data automatically into a visual hierarchy. Teams typically build a first draft in under 15 minutes, making it a quick and efficient process to get started.
For teams working from scratch, start with your executive layer first. Add your CEO or top-level leader, then build out direct reports, then their teams. This top-down approach creates a logical foundation.
3. Customize the visual layout
Once your basic structure exists, make it readable. The widget offers several layout options — horizontal, vertical, or nested views depending on what works best for your team size and structure.
Adjust spacing between levels to improve clarity. Color-code departments so people can quickly identify teams at a glance — blue for engineering, green for sales, purple for product. Add profile photos if you have them; faces make charts more approachable and help new team members connect names to people.
4. Add context and connections
Here's where Miro's canvas approach pays off. Your org chart doesn't live in isolation. Add sticky notes highlighting open roles you're hiring for. Draw connector lines between cross-functional teams that collaborate closely but don't report to the same manager.
Link the org chart to other boards showing team roadmaps, project plans, or strategic initiatives. When someone clicks into the engineering department, they can jump directly to the engineering sprint board. Context stays connected.
5. Share and iterate
Click the Share button in the top-right corner to control access. You can share the board company-wide for viewing or limit editing to specific people like HR and department leads.
Set up a regular review cadence—monthly or quarterly depending on your growth rate. Consider establishing a practice such as a 'First-Friday Refresh' to make updates feel like an ingrained cultural ritual rather than an optional task. By naming this practice, you embed it into team culture, ensuring it becomes automatic. Make updates as roles change, people join or leave, or teams are restructured. Because you're working in a collaborative canvas, gathering input and making changes happens in the same place, eliminating version control chaos.
That's it. You've moved from organizational chart templates to a working document your team can actually use.
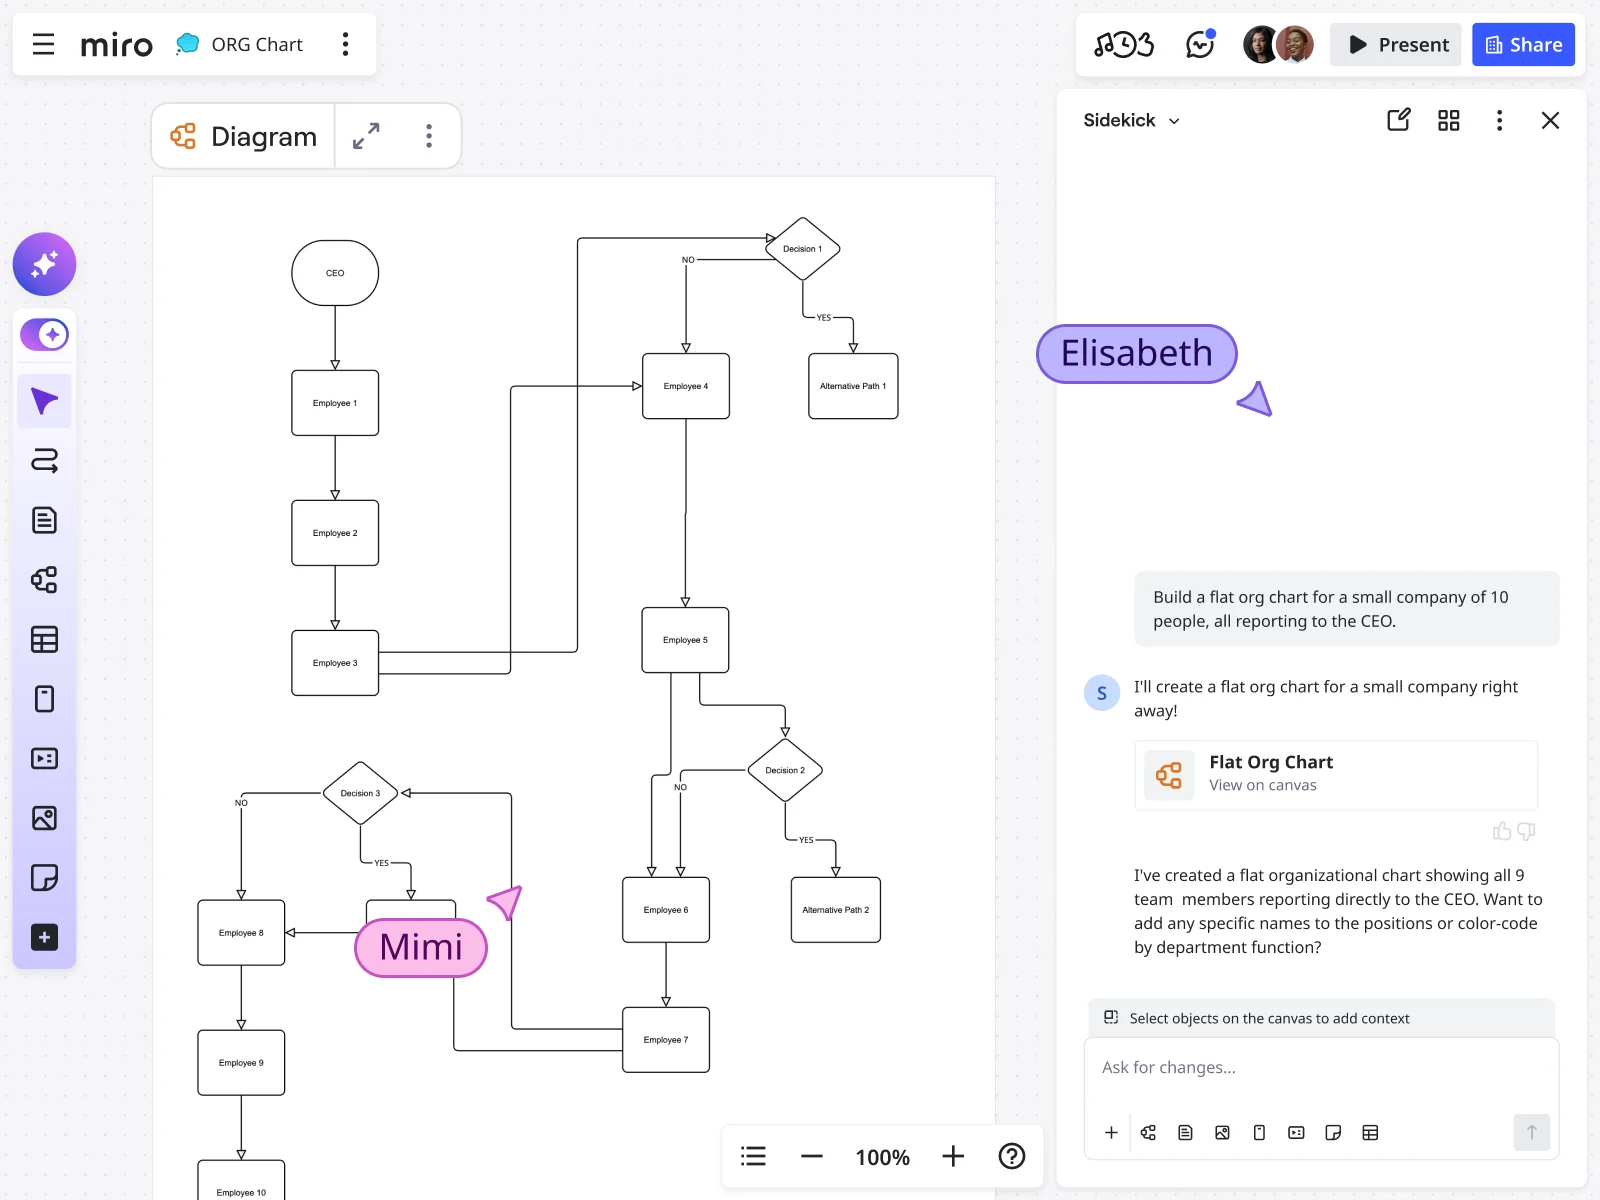
How AI transforms org chart creation from documentation to analysis
Drawing boxes showing who reports to whom barely scratches the surface of what modern organizational planning requires. The real questions leaders need answered go deeper: Are we structured efficiently? Do we have the right spans of control? Where are the gaps in our leadership pipeline?
Miro's AI features turn your org chart from a static diagram into an analytical tool that surfaces insights you'd otherwise miss.
Intelligent gap detection
Upload your current structure to the AI org chart generator and it identifies structural imbalances automatically. Teams with too many direct reports. Departments lacking clear leadership. Roles that report to the wrong function based on industry norms.
Instead of manually comparing your chart against best practices, AI highlights specific areas needing attention with recommendations for how to restructure. A sales team reporting to the CFO? The system flags it and suggests more logical reporting relationships.
Scenario planning and restructuring
Testing different organizational structures traditionally meant creating multiple versions of the same chart manually — a time sink that discouraged experimentation. With AI assistance, you can model alternative structures in minutes.
Ask the system: "What if we split the product team into two divisions?" or "Show me options for flattening this hierarchy." It generates multiple scenarios with the structural changes already mapped. Compare options side-by-side, discuss trade-offs with leadership, then implement the structure that makes the most sense.
This experimental approach to organizational planning reduces risk. You can see potential problems before restructuring, not after you've already disrupted everyone's reporting lines.
Data-driven role definition
Creating job descriptions that accurately reflect what a role actually does requires understanding how it fits within the broader structure. AI can analyze patterns across similar roles in your organization and generate draft role descriptions that account for reporting relationships, team size, and functional responsibilities.
These drafts serve as starting points, not final versions. Edit them to match your culture and specific needs, but cut the time spent writing roles from scratch by starting with contextually relevant templates based on your actual org structure.
Pattern recognition across org chart examples
Looking at how other companies structure similar functions gives you reference points for your own design decisions. AI can surface relevant organizational patterns from Miro's template library and user-created examples that match your company size, industry, or growth stage.
See how fast-growing SaaS companies typically structure customer success. Compare engineering hierarchies across organizations at Series B versus Series D. Learn from patterns without reinventing structural wheels.
Avoiding common org chart mistakes that undermine team clarity
Even with the right tools, organizational charts can backfire if you make these typical errors.
Quiz: Which of these five mistakes is your team making today? Identify and rectify them to ensure your chart supports, rather than hinders, team clarity. Here's what to watch for when you make an org chart:
Mistake 1: Creating the chart in isolation
Org structure impacts everyone but often gets designed by a handful of executives behind closed doors. The result? Structures that look logical on paper but ignore how work actually flows between teams.
Instead, involve the people who will live within the structure. Share draft versions, gather feedback, and test proposed changes with the teams affected. Your engineering director probably has better insight into whether the mobile team should report to product or engineering than someone three levels removed from daily work.
Mistake 2: Focusing only on reporting lines
An organizational structure chart should show more than who someone's manager is. Map out decision rights, collaboration patterns, and cross-functional dependencies that don't follow the hierarchy.
The marketing ops person might report to the CMO but work daily with RevOps, sales, and product. Show those dotted-line relationships so people understand the full picture of how teams interconnect.
Mistake 3: Updating once per year (or never)
If your last org chart update happened when you hired that person who's now managing three teams, you have a documentation problem. Outdated charts create confusion, not clarity.
Set a cadence for reviews. For high-growth teams, that might be monthly. For stable organizations, quarterly works. The point is regular updates that keep pace with actual team changes.
Mistake 4: Making it too complex to understand
An org chart with 50 different colors, seven types of connector lines, and tiny font nobody can read helps no one. Simplicity wins. Use consistent visual language, limit decoration to what adds meaning, and test readability by showing it to someone unfamiliar with your org.
Mistake 5: Treating structure as permanent
Your organizational structure of a company should evolve as your strategy, market conditions, and team capabilities change. Viewing the org chart as something you "get right" once and then leave alone creates rigidity that holds teams back.
Great org design is iterative. You test structures, gather feedback, make adjustments, and continuously refine based on what's working and what's not. Miro's collaborative approach supports this iteration by making changes easy rather than bureaucratic.
Making your org chart a living system instead of a static document
The difference between org charts that gather dust and those that drive decision-making comes down to integration. Your organizational structure documentation should connect to the systems and workflows your team uses daily.
Link to your HRIS and directories
Your org chart should sync with your source-of-truth employee data. When someone's title changes in BambooHR or Workday, it updates automatically in your chart. When a new hire joins, they appear in the structure without manual data entry.
Miro supports integrations with major HR platforms, eliminating double-entry and reducing errors. Your chart stays current because it pulls from the same system HR uses to manage employee records.
Connect structure to strategy
Place your org chart on the same board as your strategic plan, OKRs, or annual roadmap. Draw explicit connections between organizational decisions and strategic priorities.
If you're prioritizing international expansion, show the new regional teams you're building. If product velocity is a focus, highlight the additional engineering squads coming online. When structure aligns visibly with strategy, the reasoning behind organizational decisions becomes clear.
Use it in planning cycles
Reference the org chart during quarterly planning, budget reviews, and headcount allocation discussions. Instead of debating team structure in the abstract, you're looking at the actual current state and proposed changes side-by-side.
This grounds conversations in reality. You can see exactly where new roles would fit, which teams would be affected by a restructuring, and how headcount distribution aligns with strategic priorities.
Make it accessible to everyone
Your org chart shouldn't require special permissions to view. Make it accessible to the entire company. Transparency around structure builds trust and helps people understand how their work connects to the broader organization.
When a new employee wants to understand who does what, they can explore the chart themselves rather than bothering their manager with questions. When someone needs a decision from leadership, they can identify the right person quickly.
From boxes and lines to strategic advantage
Your organization chart can be more than HR documentation. When built on tools designed for collaboration and enhanced with AI capabilities, it becomes a strategic asset that clarifies decision-making, accelerates onboarding, and supports structural experimentation.The teams seeing the most value from modern organizational planning share common patterns: they update charts regularly, involve stakeholders in design decisions, connect structure to strategy, and use AI to surface insights rather than relying purely on intuition.
The technical barriers that once made org charting painful — rigid software, manual diagram creation, version control chaos — no longer exist. With Miro's Org Chart widget, you can build org chart structures that reflect reality, adjust them as teams evolve, and analyze them for opportunities to improve
Remember: your organization chart is more than a document—it's a reflection of strategy in motion. Structure is the catalyst that turns your plans into action. Let it guide you towards clarity and adaptability.
Start with where you are. Import your current structure, get it visible on a shared board, and begin the conversation about whether your organization chart matches both your current state and where you're heading.
Ready to build yours? Start with Miro's organizational chart templates or jump straight into the AI org chart generator to create your first version in minutes.
Your team's structure deserves better than static PDFs that nobody updates. Give them an org chart that actually helps them get work done.
Frequently asked questions about Miro's Org Chart features
Which Miro plans include the Org Chart widget?
The Org Chart widget is available on all Miro plans, including Free, Starter, Business, and Enterprise. You can start creating organizational charts immediately without upgrading, though advanced features like AI capabilities and certain integrations may require paid plans.
Does using AI features for org chart analysis cost extra?
AI features in Miro, including the AI org chart generator, consume AI credits. Business and Enterprise plans include AI credits in their subscriptions. Free and Starter plans have limited AI access. Check your current plan's AI credit allocation in your account settings.
Where can I find organizational chart templates to start from?
Miro's template library includes dozens of pre-built organizational chart templates covering different company sizes, industries, and structures. Browse templates for startups, enterprise organizations, functional hierarchies, matrix structures, and more. Each template is fully customizable to match your specific needs.
Can I share my org chart template with the Miro community?
Absolutely. If you've created an org chart structure that works well for your team, you can publish it as a template for others to use. Go to your board settings, select "Publish as template," and share it with the community. Many of Miro's most popular templates started as user contributions.
Can I see examples of how other companies structure their org charts?
Yes. The Miro Community showcases real org chart examples created by teams across industries. You'll find examples from tech companies, nonprofits, agencies, and enterprises at various growth stages. These examples provide inspiration and practical reference points for your own org design.
Which HRIS systems integrate with Miro for org chart data?
Miro integrates with major HR platforms including BambooHR, Workday, and other systems via CSV export/import or through Miro's API. While direct real-time sync isn't available for all systems, you can set up automated data pipelines using integration platforms like Zapier or Make (formerly Integromat) to keep your org chart updated.
Can I import org chart data from Excel or Google Sheets?
Yes. Export your employee data from Excel or Google Sheets as a CSV file with columns for employee names, titles, manager names, and any other relevant information. The Org Chart widget maps this data automatically into a visual hierarchy based on reporting relationships.
Is Miro compliant with industry-specific regulations like HIPAA or SOC 2?
Miro maintains SOC 2 Type II certification and ISO 27001 compliance. For healthcare organizations requiring HIPAA compliance or financial services needing specific regulatory adherence, Miro's Enterprise plan offers additional compliance features and Business Associate Agreements (BAAs). Contact Miro's sales team to discuss specific regulatory requirements for your industry.
Author: The Miro team Last update: November 27, 2025