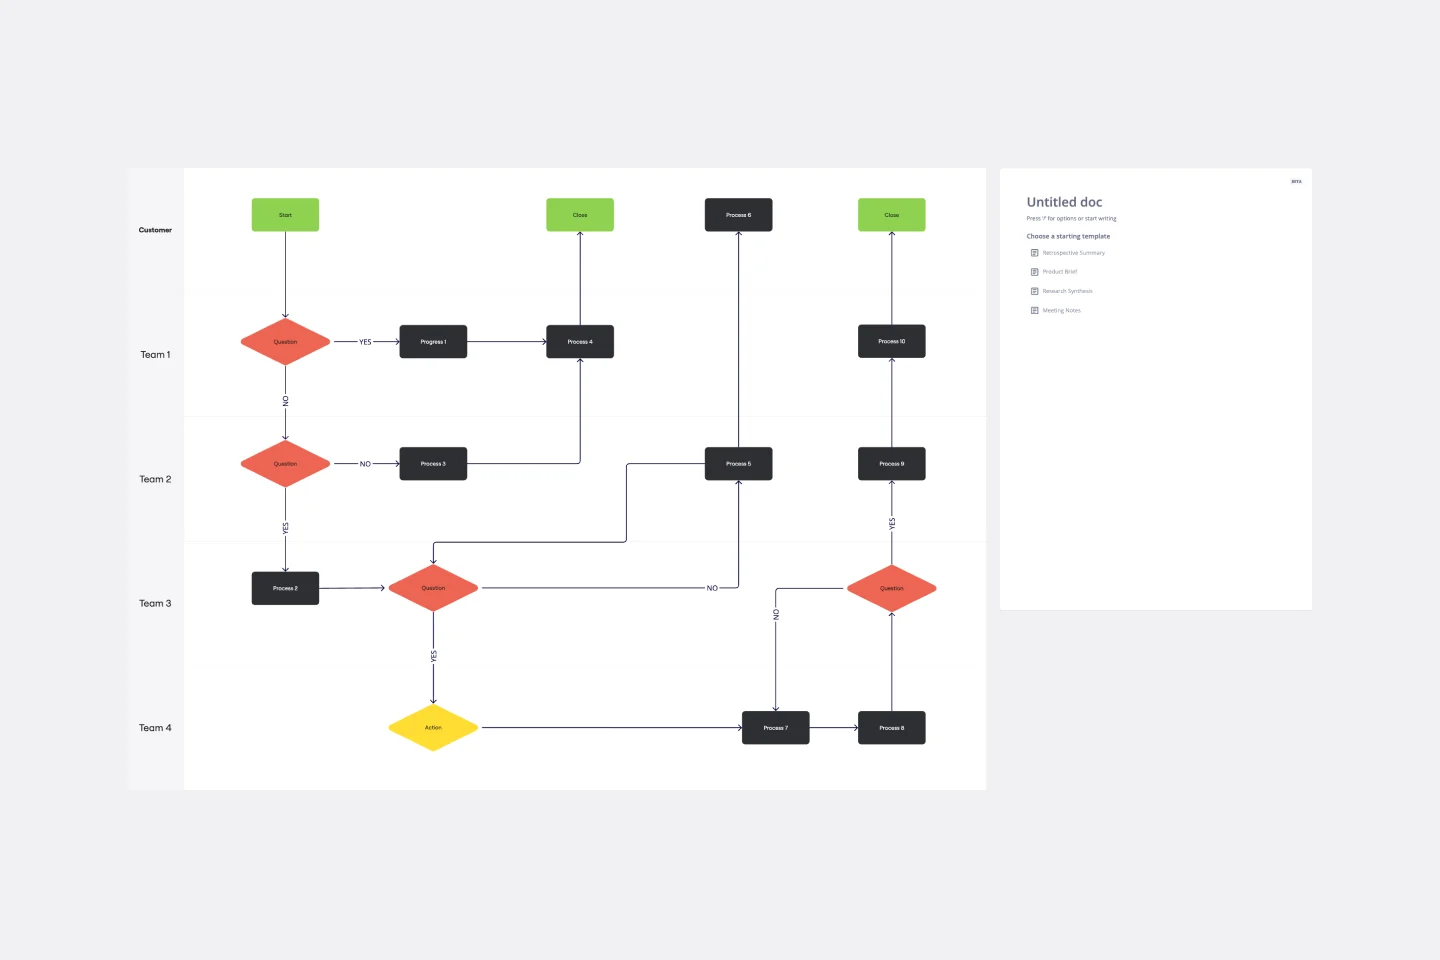
Logic Model Template
Outline your program’s activities and outputs with the logic model template. Map out the project lifecycle and bring alignment to teams.
About the Logic Model Template
This logic model template offers an illustrative approach to program planning, evaluation, and management. The template visually represents the connection between resources, activities, and desired outcomes, ensuring a clear roadmap for your project or initiative.
Businesses, nonprofits, and educators can use the logic model template to visually depict the relationship between program inputs, activities, outputs, and outcomes. It illustrates how the invested resources will be transformed into the anticipated results through interconnected steps.
Step-by-step guide to using the logic model template
Setting up the logic model template to fit your project or business is easy. Start by opening the template onto a Miro board, then follow this guide to customize it to your needs.
Edit the template: Click on any element within the template to quickly edit or change it. You can change text, colors, or reposition sections as needed.
Expand with automated diagramming: If you need to add more sections or components, use Miro’s automated diagramming feature by clicking on shapes and connector lines. This lets you seamlessly expand and edit the existing structure of the template.
Add artifacts: To make your logic model more comprehensive, drag and drop any documents, images, links, or other artifacts onto the board.
Collaborate in real-time: Invite team members to join the board. They can provide instant input, comments, or feedback, ensuring a collaborative approach.
Share and collect feedback: Once your logic model is complete, you can share the board with stakeholders or team members for further review or implementation.
Why use a logic model template?
Clear visualization: The template provides a visual map, enabling stakeholders to quickly understand the entire project lifecycle and its components.
Improved resource allocation: Clearly defining inputs and anticipated outcomes ensures resources are used efficiently and directed toward activities that genuinely matter.
Alignment with goals: The template ensures all activities align with the overarching project or program goals, minimizing deviations or distractions.
Facilitates evaluation: With the logic model, it's easier to monitor and evaluate a program's effectiveness, pinpointing improvement areas.
Stakeholder communication: The template acts as a shared language, making communicating complex ideas or plans to different stakeholders simpler.
If you'd prefer to start from scratch, Miro's flowchart maker is the perfect tool to diagram a logic model. You can add shapes and connector lines with just one click.
Can I customize the logic model template?
The template is designed to be flexible, allowing you to tailor it according to your specific needs and preferences.
Can multiple team members collaborate on the template in real time?
The template supports real-time collaboration, ensuring all stakeholders can provide input and feedback instantly.
What kind of projects or initiatives is the logic model template best suited for?
The template is versatile and can be used for various projects, from educational initiatives and nonprofit programs to business projects and strategic planning.
Do I need any special skills to use the logic model template?
Not at all! The template is user-friendly, and even if you're new to such tools, you'll find it intuitive and easy to navigate.
Get started with this template right now.
Value Stream Mapping Template
Works best for:
Project Management, Strategic Planning, Mapping
A value stream map can help you refocus your business on steps that actually provide value to your customers, cutting out wasteful and inefficient processes. With this template, you and your process team can collaborate on a value stream map today.
OutSystems Architecture Diagram
Works best for:
Diagramming
The OutSystems Architecture Diagram template offers a visual tool for designing and documenting software architectures using the OutSystems platform. It provides elements for modeling application components, data structures, and integration points. This template enables teams to visualize and communicate the architecture of their OutSystems applications, facilitating collaboration and alignment among developers and stakeholders. By promoting clarity and understanding of system architecture, the OutSystems Architecture Diagram empowers teams to build scalable, maintainable, and high-performance applications effectively.
Pie Chart Template
Works best for:
Education, Operations
Pie charts are an excellent way to present relationships between datasets graphically, where you can quickly compare information and see contrast right away. Professionals from many fields use pie charts to support their presentations and enrich their storytelling as it’s one of the most commonly used data charts.
UML Component Diagram Template
Works best for:
Mapping, Diagrams, Software Development
Use our Component Diagram template to show how a system’s physical components are organized and wired together. Visualize implementation details, make sure planned development matches system needs, and more — all in a collaborative environment.
UML Sequence Diagram Template
Works best for:
Software Development, Mapping, Diagrams
Analyze and showcase how external entities interact with your system using a sequence diagram. Get a bird’s-eye view of your work processes, business functions, and customer interactions using this diagram. Also, identify any potential problems early and solve them before implementation.
Production Flowchart Template
Works best for:
Flowcharts
The Production Flowchart Template is a well-crafted tool that clearly represents a production process from start to finish. It breaks down complex procedures into easy-to-understand segments, making it easier for stakeholders to grasp the entire process. One of the key benefits of using this template is that it helps to clarify complex production pathways. By mapping out operations visually, teams can identify potential bottlenecks or inefficiencies, facilitating timely and well-informed decision-making.