832 likes
3.8K uses
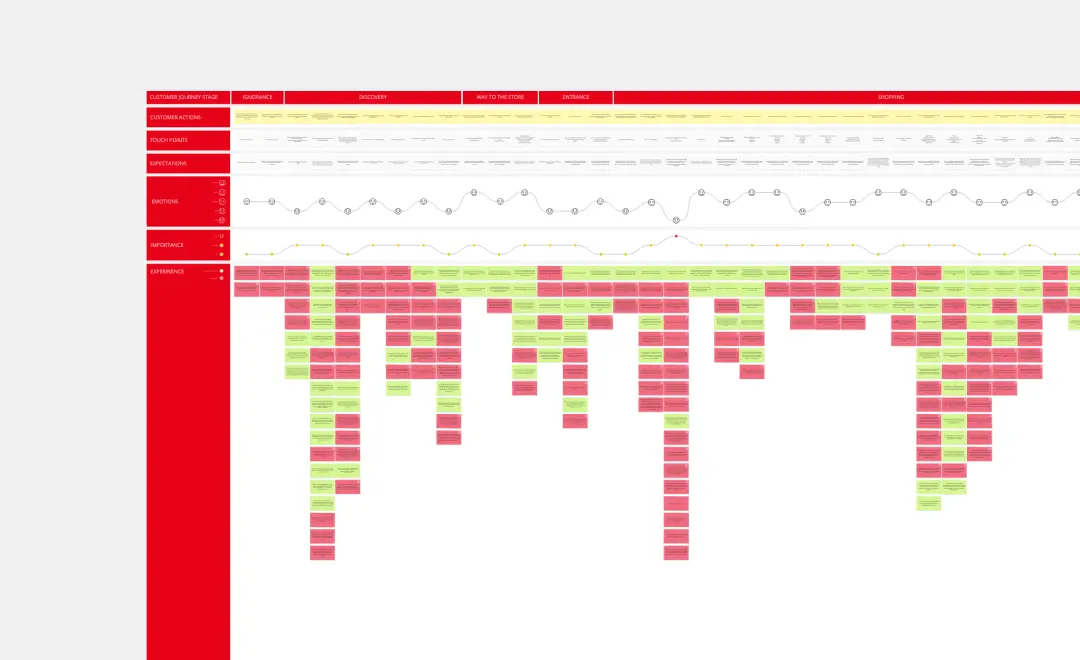
Customer journey mapping is a method that visualizes and narrates how users navigate a site or app to achieve their objectives. It divides the user's journey into individual steps, each characterized by multiple layers such as touchpoints with the company, user's intent, emotions, and relevant qualitative and quantitative data.
This map serves as a holistic visual representation of the relationship between the company's delivered touchpoints and the customer's personal experience. It aids in identifying areas for improving customer experience and aligning various teams and stakeholders on user experiences.
Customer journey maps are crucial for understanding users better, pinpointing investment areas to enhance customer experience, and improving customer satisfaction and retention.
Customer journey maps have several benefits:
Holistic User Experience Insight - Provides a comprehensive and structured understanding of the customer's journey from start to end, considering various viewpoints.
Deep User Empathy - Enables comprehension of user emotions and their reasons, framing their actions and feelings in a relatable narrative.
Cross-Functional Synergy - Facilitates alignment of different teams by integrating their specific interests (design, engineering, marketing, etc.) on a common map, fostering shared understanding and company focus.
Problem Identification and Solution Suggestions - Highlights major issues to address and potential remedies by linking customer objectives with their interaction points and subsequent emotions.
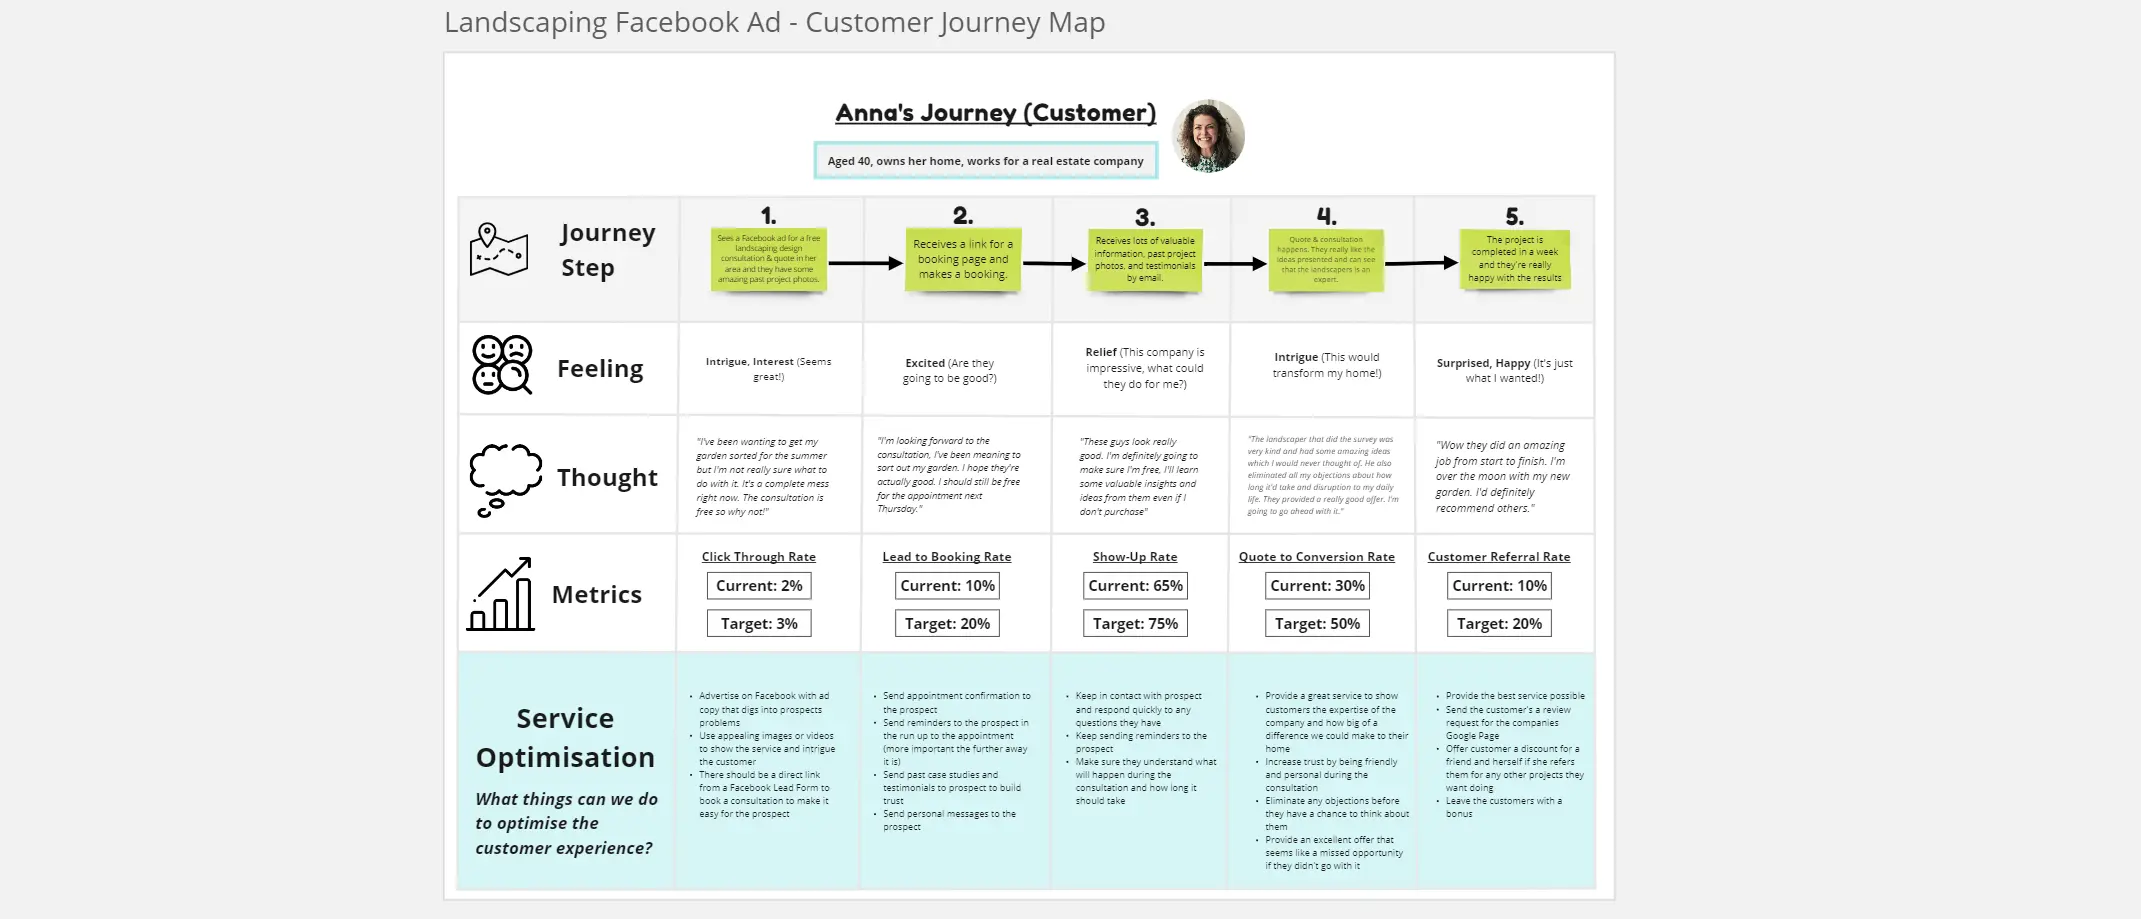
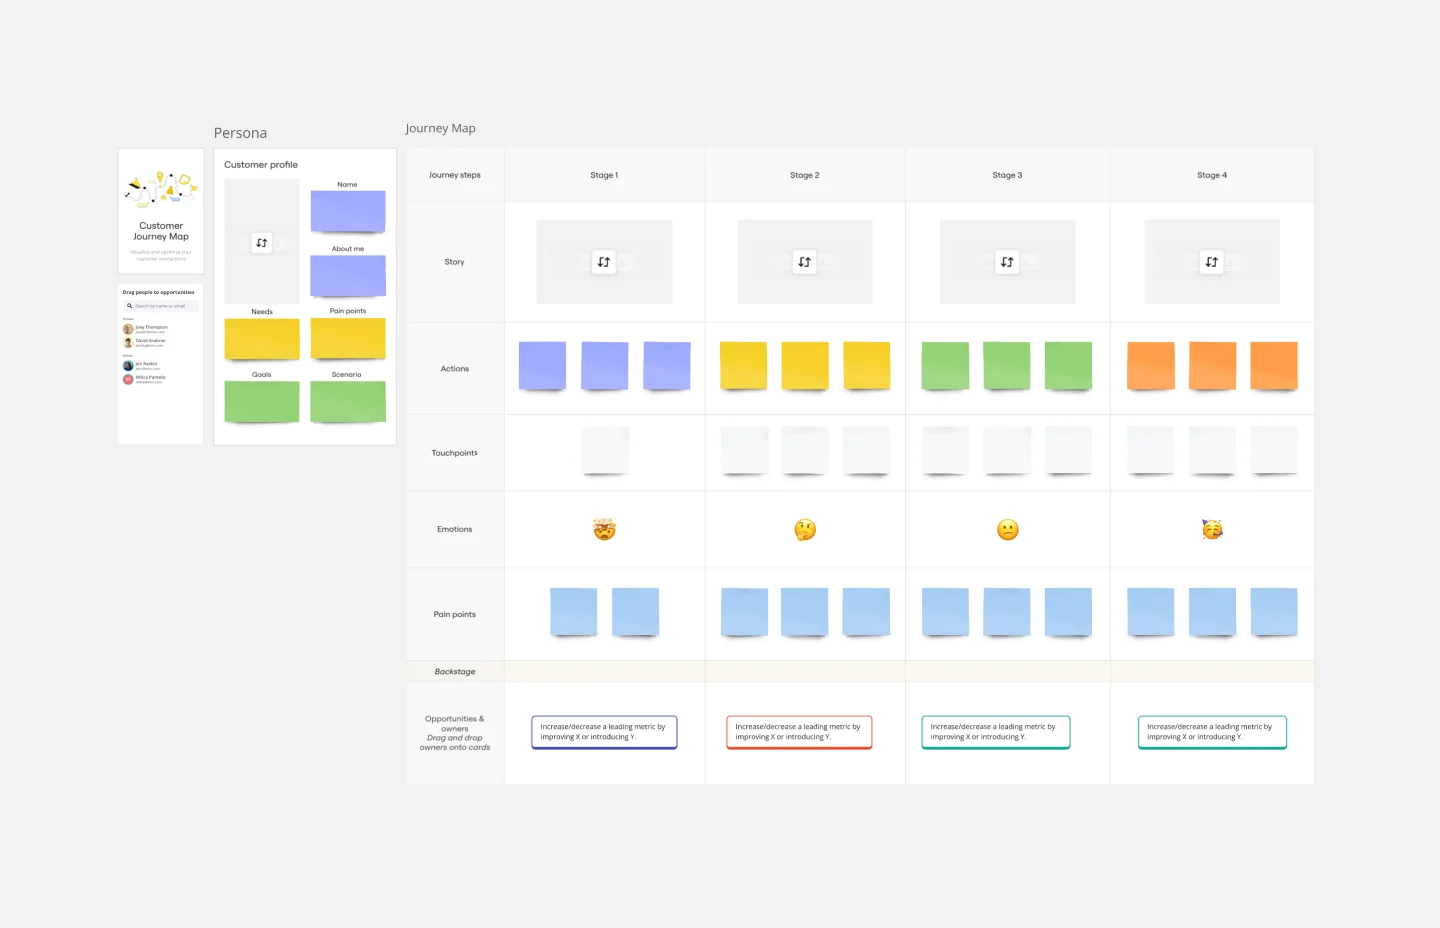
A customer journey map is a visual tool used by businesses to understand the steps a customer takes to reach a goal, reflecting their motivations, needs, and issues throughout the user experience. It commonly includes:
Customer Persona - a hypothetical profile reflecting your typical customer's traits, needs, and motivations.
Stages - the various phases a customer encounters while interacting with your product to reach their objective.
Touchpoints - the interactions between your customers and your product, such as visiting your website, receiving an email, or speaking to customer service.
Emotions - the varying feelings experienced by customers at each stage, used to pinpoint areas to enhance the customer experience.
Opportunities - identified issues worth addressing based on customer emotions, along with potential solutions for exploration.
Every customer journey will be different, but they all follow certain key principles:
Customer-Centric - Maps should present the customer's experience from their perspective to foster empathy and understand their motivations.
Multi-Channel - All touchpoints, digital or physical, should be included to provide a holistic view of the customer's experience, avoiding isolated touchpoint analysis.
Integration of Touchpoints and Experience - Pairing objective touchpoints with subjective feelings offers insights into customers' emotions and their reasons.
Visualization - Representing the customer experience visually enhances understanding, providing a more digestible format than text or slide presentations.
Goal-Orientation - Journey maps should depict the customer's path towards a goal, implying that enhancing the journey should increase goal achievement, thus benefiting the company.
There are 7 steps to creating a customer journey map:
Define your customer persona
Select the customer goal
Define the journey steps
Add customer touch points
Add customer thoughts and feelings
Further enrich the map
Identify where to act
Creating a basic customer journey map can be done individually and quickly, but involving a cross-functional team in a workshop can provide a richer, more diverse map. It also helps to highlight user issues and align multiple stakeholders.
For such workshops, allocate 90 minutes to 2 hours and consider including people from various functions such as:
User research or design
Engineering
Marketing (especially CRM)
Customer Service
Sales and account management
Sector experts
CEO, founder, or General Manager
The process of each step in the workshop will be guided to aid in building your customer journey map.
Creating a basic customer journey map can be done individually and quickly, but involving a cross-functional team in a workshop can provide a richer, more diverse map. It also helps to highlight user issues and align multiple stakeholders on change justification.
For such workshops, allocate 90 minutes to 2 hours and consider including people from various functions such as:
User research or design
Engineering
Marketing (especially CRM)
Customer Service
Sales and account management
Sector experts
CEO, founder, or General Manager
The customer is the main figure in a customer journey map, necessitating a clear understanding of who they are. Personas should be defined by their needs written in the format “I want … “ or “I need … “, for example:
I want to find what I’m looking for as fast as possible
I need to know my item will turn up
I want my item to arrive really quickly
Decide what the goal you are mapping out for your persona, e.g.:
Tier: book an e-bike and get to my destination
Moonpig: send someone a birthday card
Sky: watch a movie
Or it could be a smaller, specific journey, e.g.:
X: create an account
Zalando: send a return
Revolut: resolve a billing error
Break down the journey the customer goes through to reach their goal into 6-10 steps. This is the horizontal axis of the map.
For each step in the customer journey, add the touchpoints that they have with the company:
Using the app
Visiting the website
Emails, notifications and ads
Speaking to a customer service agent on the phone or via chat
Using a physical object (e.g. using a Tier e-bike)
Add how customers think and feel at each step, based on their interactions and the touchpoints. This is best based on user research, but you can empathize with your users to get going and update these sentiments with what you've heard from customer research later.
Add any other layers to the map that you think will be useful, e.g.:
Provocations - state the key problems to solve in the format “how might we…”?
Feature ideas - any ideas for new features or changes to existing features you can think of
Quotes - actual quotes from customers in interviews or via social media and customer service
Insights - quantitative insights and analysis that help you understand user behavior through the customer journey
Metrics - any KPIs that you want to measure whether you are improving the customer journey objectively
Tech stack - the internal and 3rd party systems that help you deliver the customer experience
Again, there’s no right or wrong here, it all depends on the sorts of conversation that you want to drive.
You should now be able to see where there are gaps in the customer journey, and identify opportunities to fix these gaps . Highlight these on the map so that anyone can see them.
For more Hustle Badger templates and how-to guides, visit www.hustlebadger.com

Hustle Badger
Head Badger @ Hustle Badger
We provide a wiki, templates and how-to guides for people in the tech industry. Find out more at
Journey Map To Plot the Customer Experience
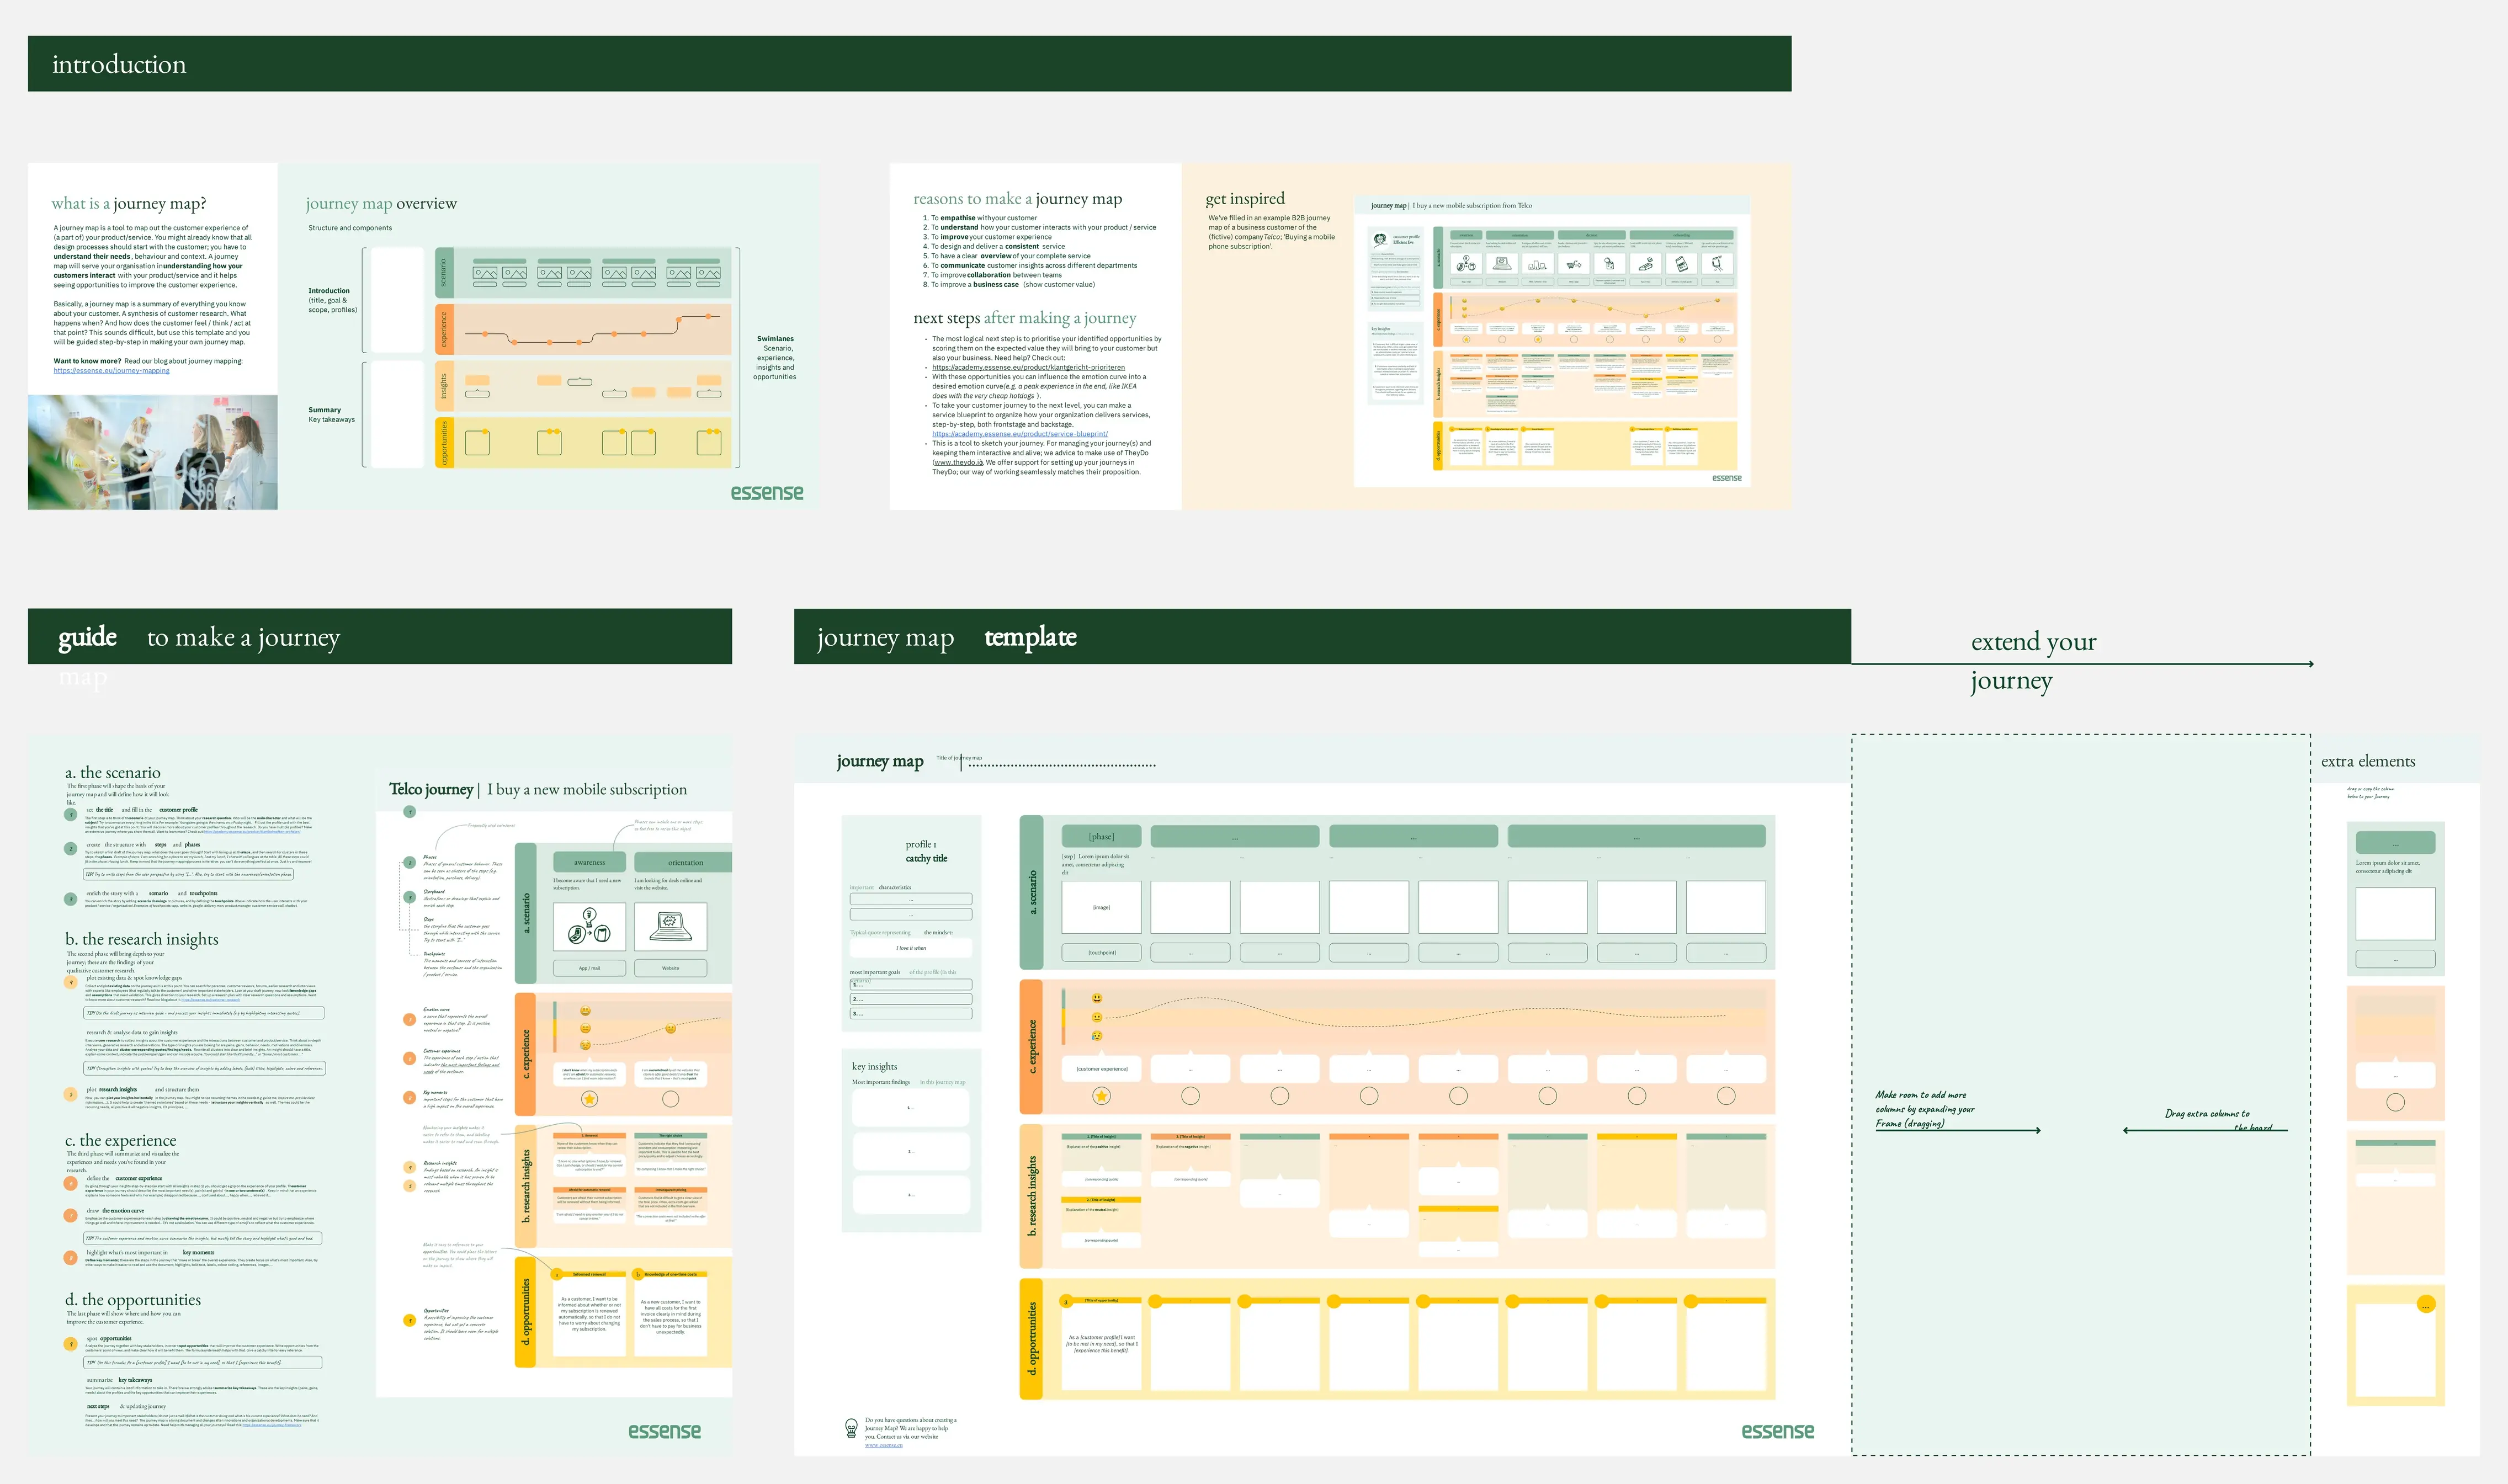
A journey is a tool to map out the customer experience of (a part of) your product/service in a visual way.
AI Accelerated
Customer Journey Map AI Template
A customer journey map (CJM) is a visual representation of your customer’s experience. It allows you to capture the path that a customer follows when they buy a product, sign up for a service, or otherwise interact with your site. Most maps include a specific persona, outlines their customer experience from beginning to end, and captures the potential emotional highs and lows of interacting with the product or service. Use this template to easily create customer journey maps for projects of all kinds.
Journey Map To Plot the Customer Experience
A journey is a tool to map out the customer experience of (a part of) your product/service in a visual way.
AI Accelerated
Customer Journey Map AI Template
A customer journey map (CJM) is a visual representation of your customer’s experience. It allows you to capture the path that a customer follows when they buy a product, sign up for a service, or otherwise interact with your site. Most maps include a specific persona, outlines their customer experience from beginning to end, and captures the potential emotional highs and lows of interacting with the product or service. Use this template to easily create customer journey maps for projects of all kinds.