Meet deadlines with a Gantt chart maker
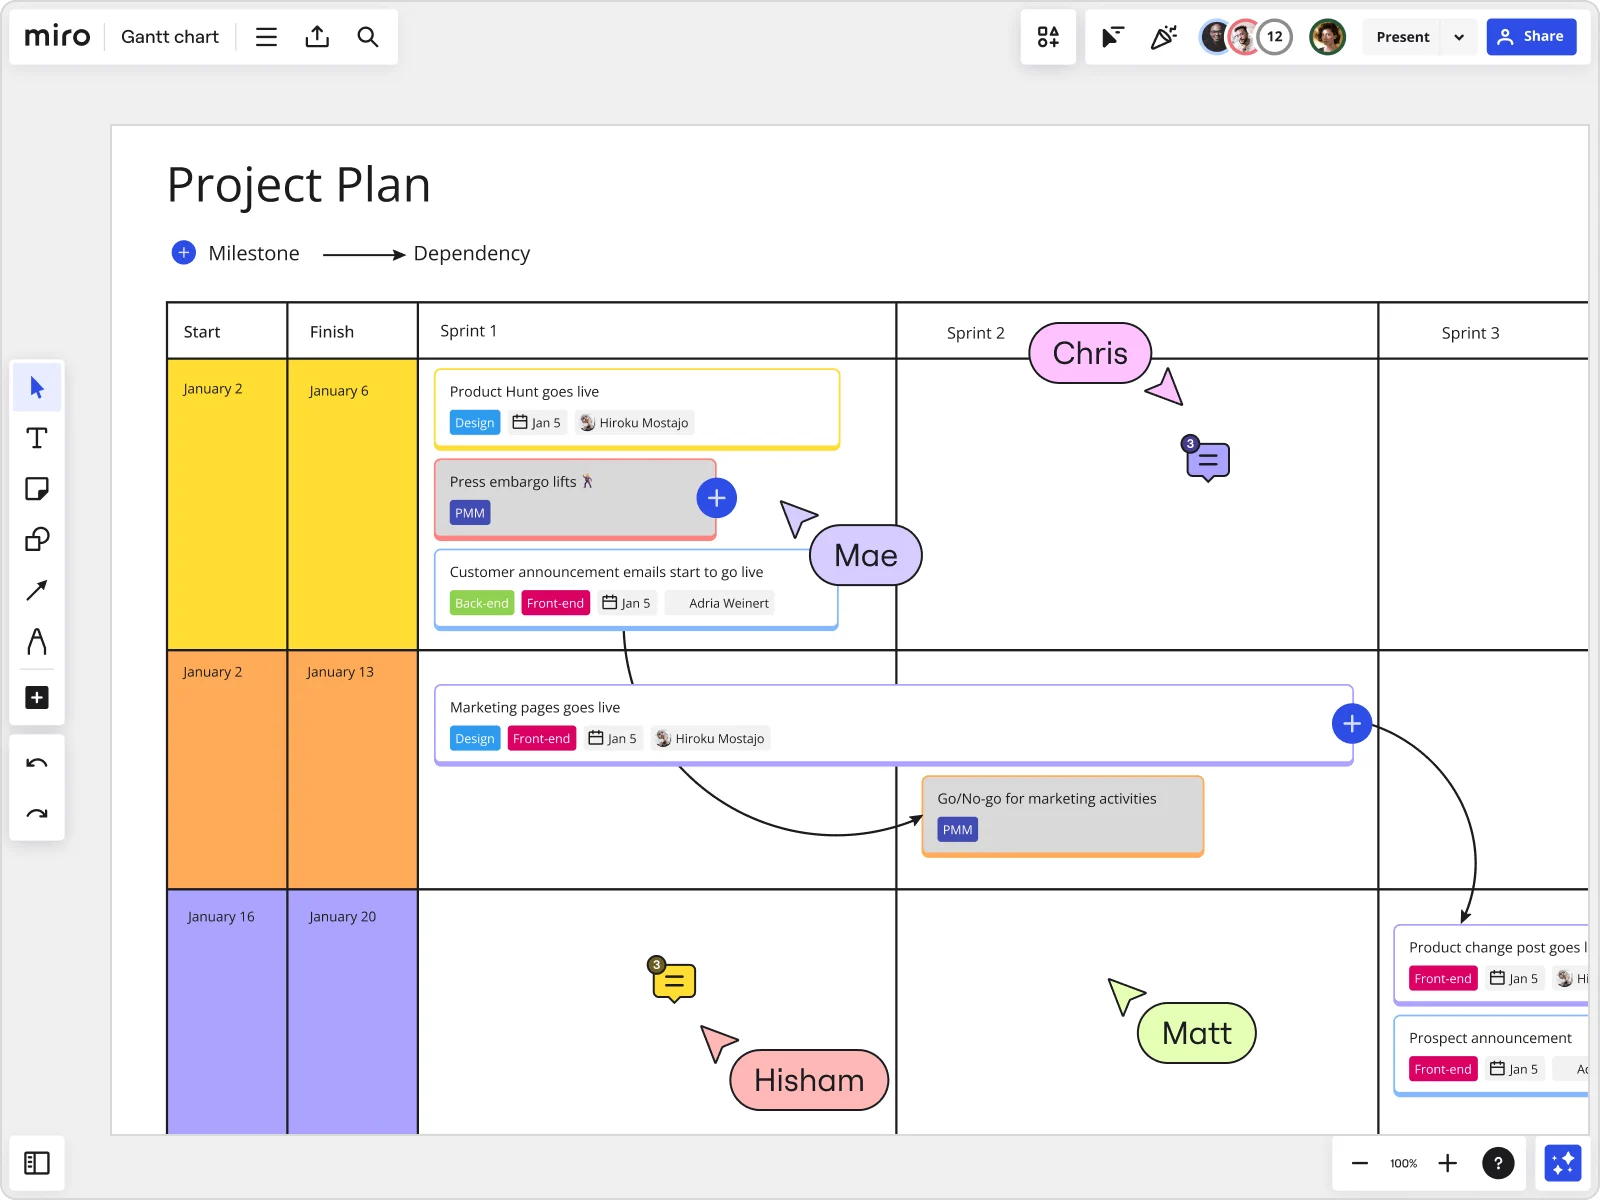
Planning made easy with a Gantt chart creator
Why use Miro’s Gantt chart maker?
Project management made easy
Brings tasks, files, and conversations onto one collaborative board where you can build Gantt charts and orchestrate everything from daily work to strategic initiatives, all without leaving your workspace.
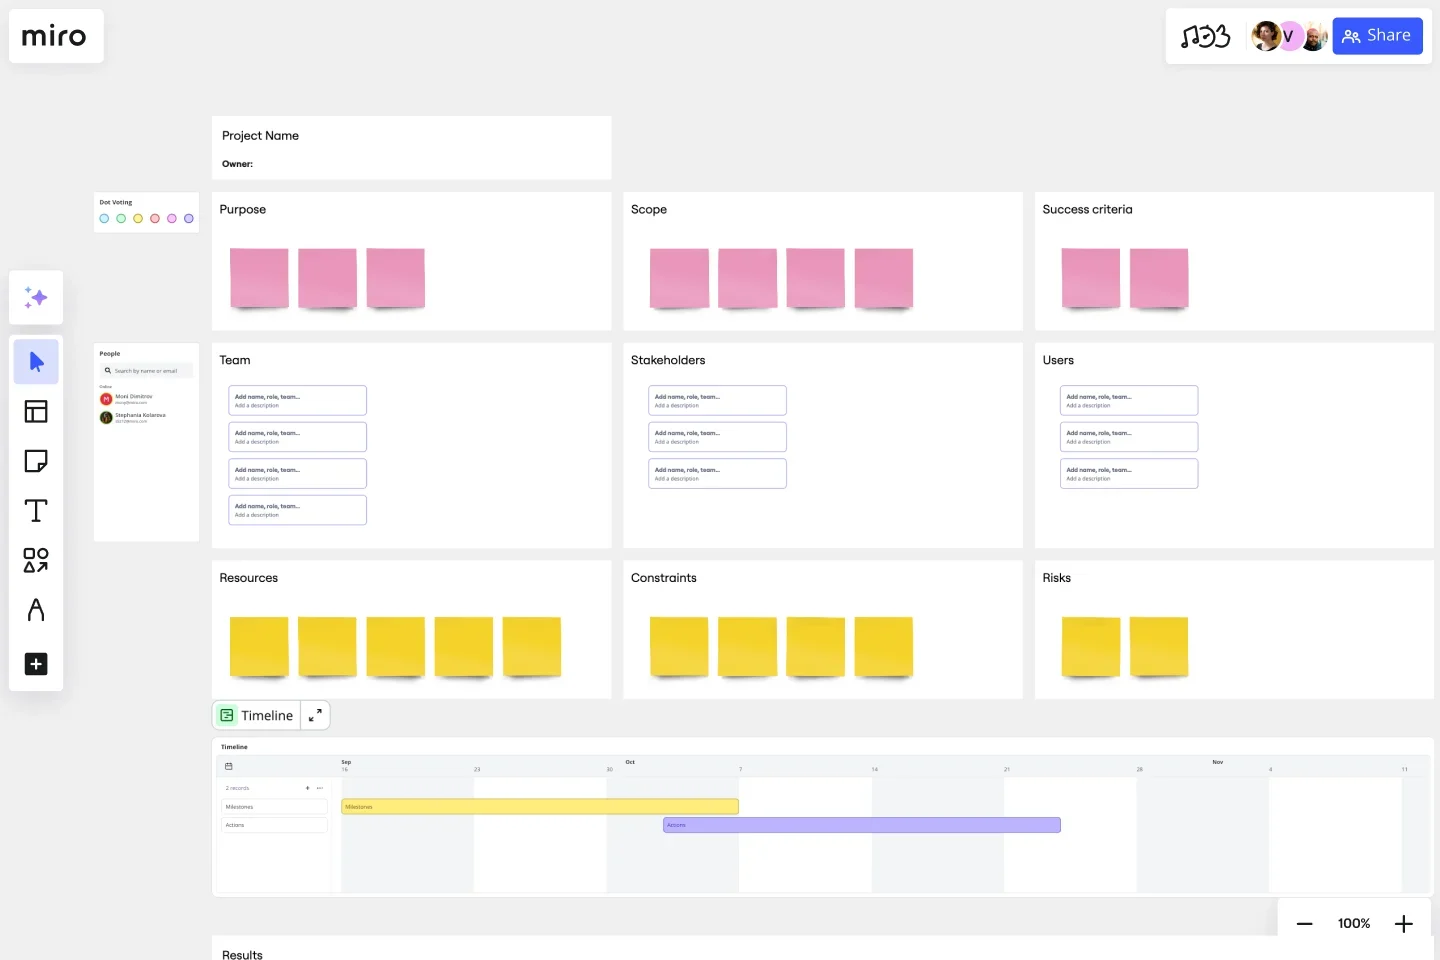
Diagramming magic
Use Miro's built-in Mermaid app to create Gantt charts in minutes, or jump-start your planning with ready-made templates. Everything you need for visual project planning lives in one place—no copy-pasting required.
Collaboration that works
Messy handoffs and siloed updates kill momentum. With Miro’s Gantt chart creator, your team can brainstorm, assign tasks, and share updates all in one shared space. Whether you’re online together or working async, everyone stays aligned without extra meetings.
Power your Agile team
Create a culture of trust and transparency through visibility & inclusion with Miro’s collaborative platform. Maximize resource and time efficiency, managing projects at ease with a Gantt Chart maker designed for unbiased estimation and better outcomes.
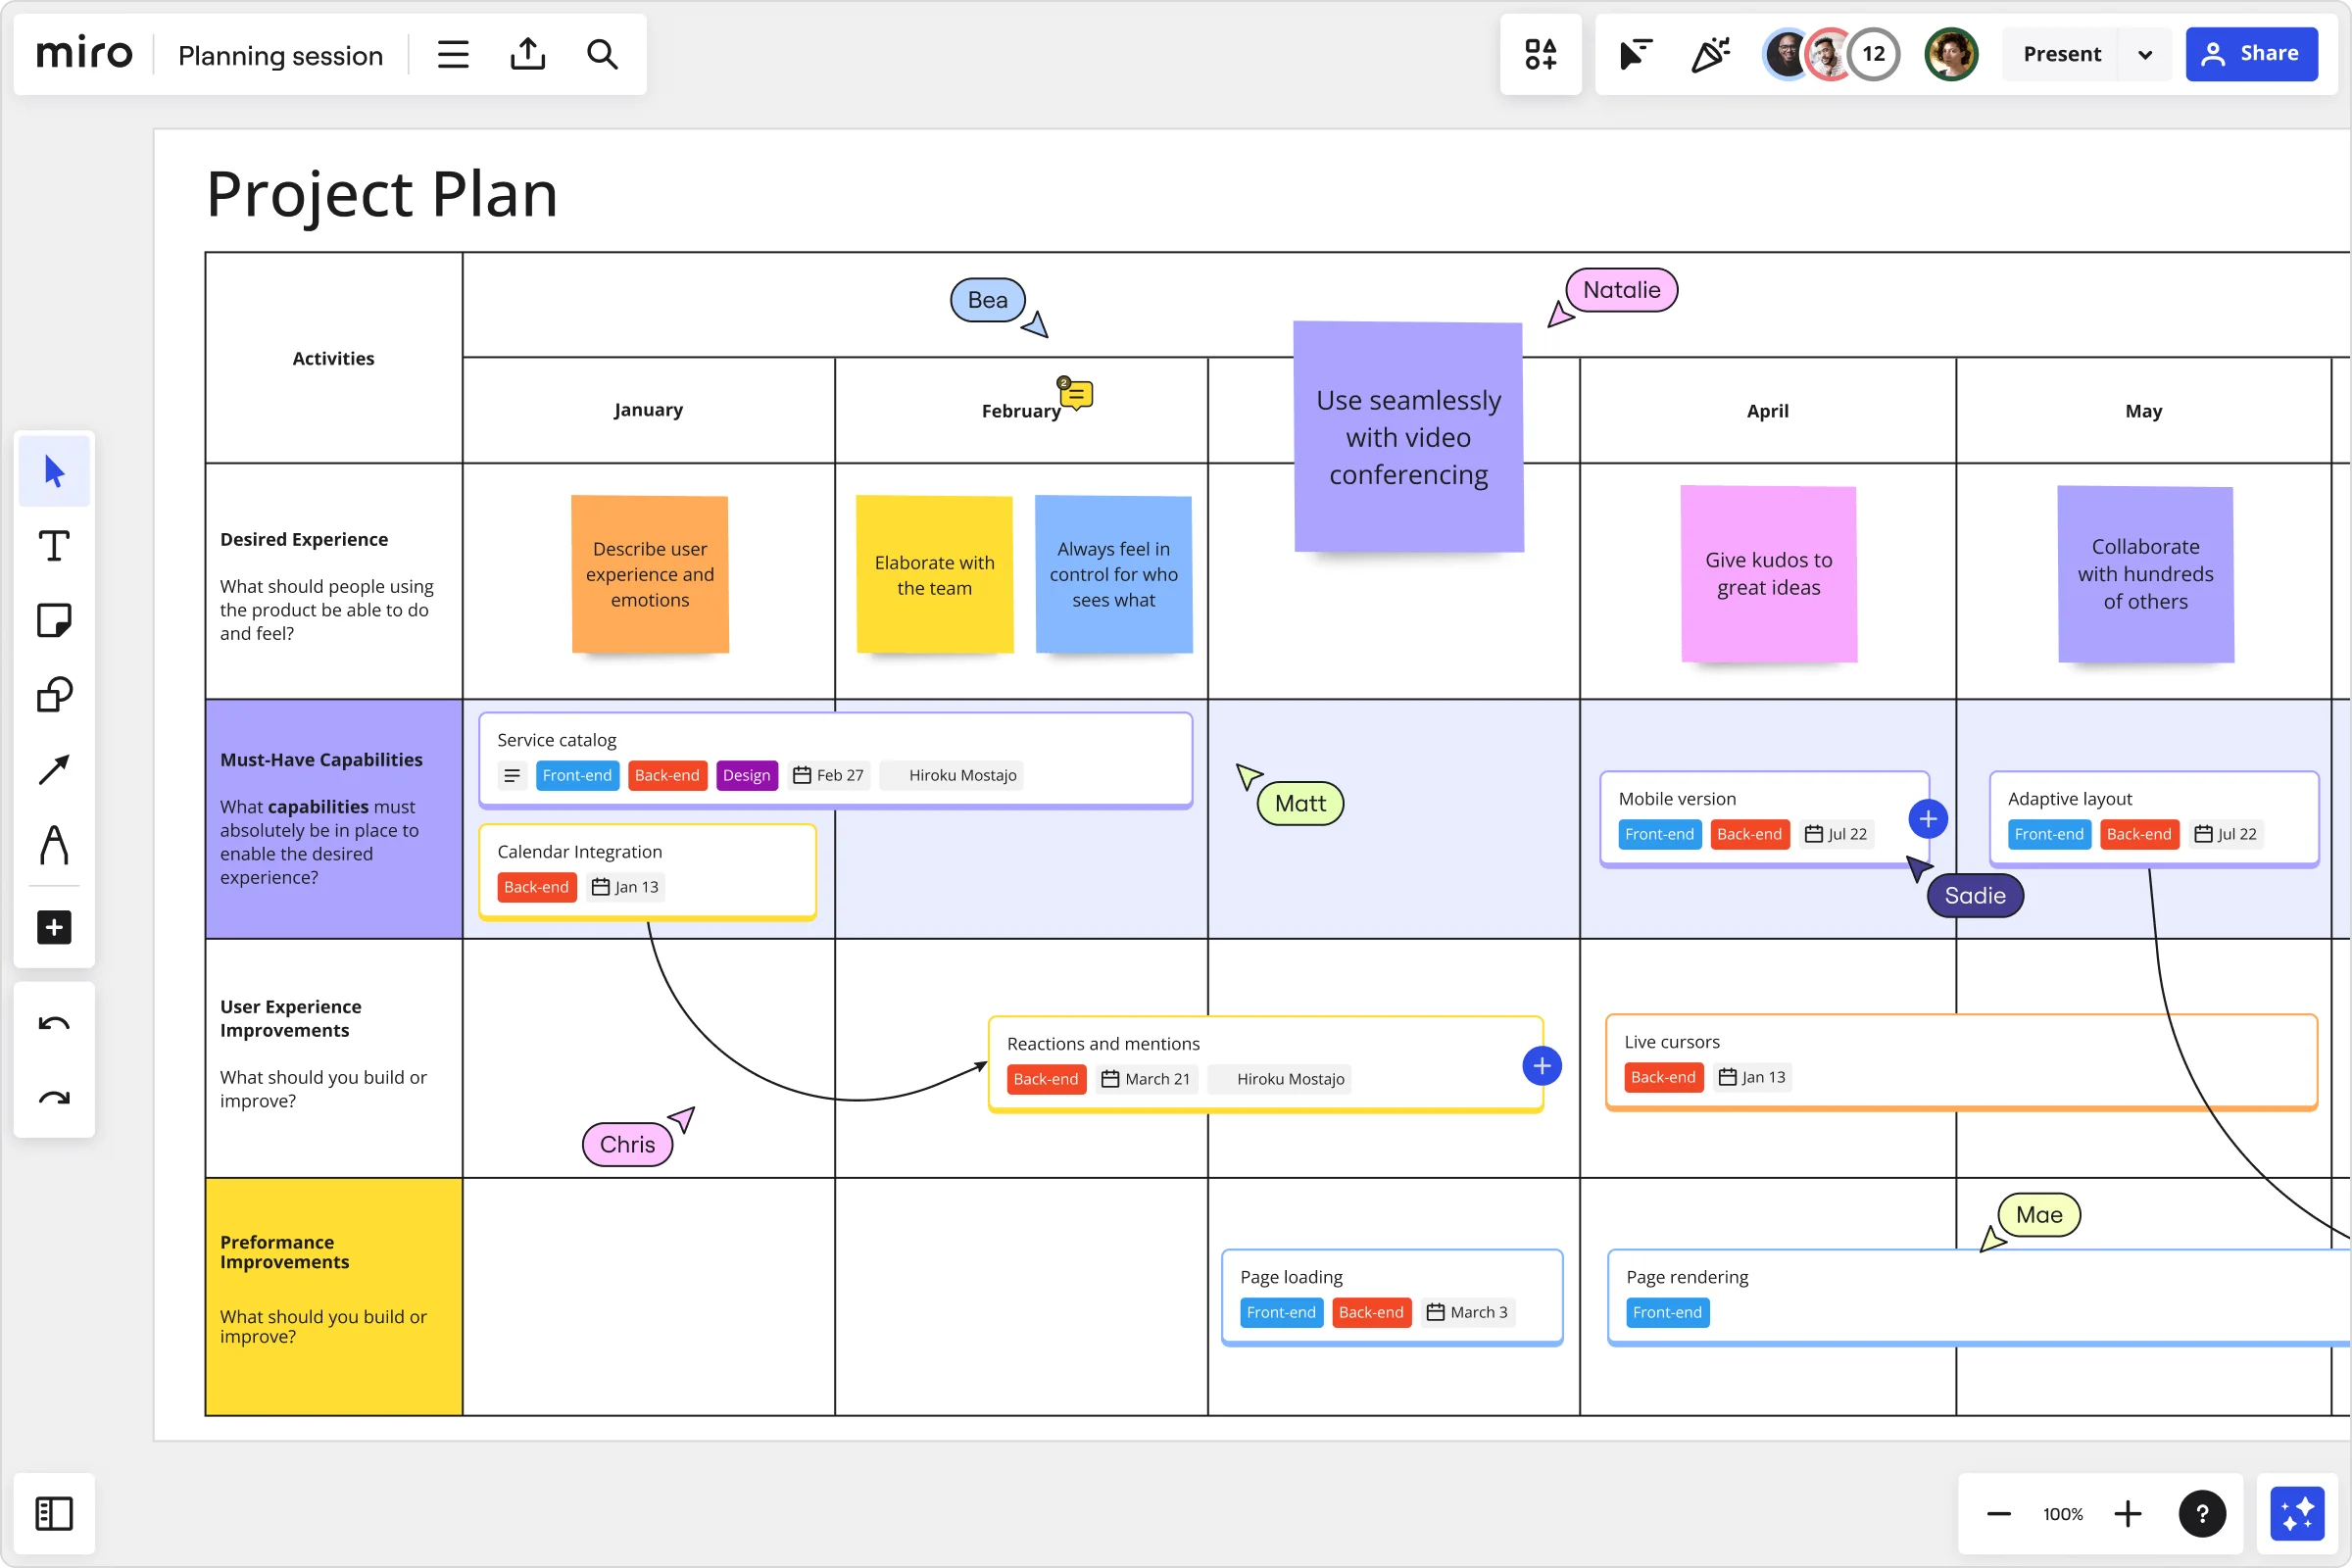
Run dynamic sessions
Feedback sessions can drag when stakeholders aren’t engaged, but Miro keeps things interactive. Get stakeholder buy-in and make final decisions collaboratively by using timers, voting, and facilitation tools to keep discussions focused. When you map progress on a Gantt chart together, buy-in comes faster and decisions stick.
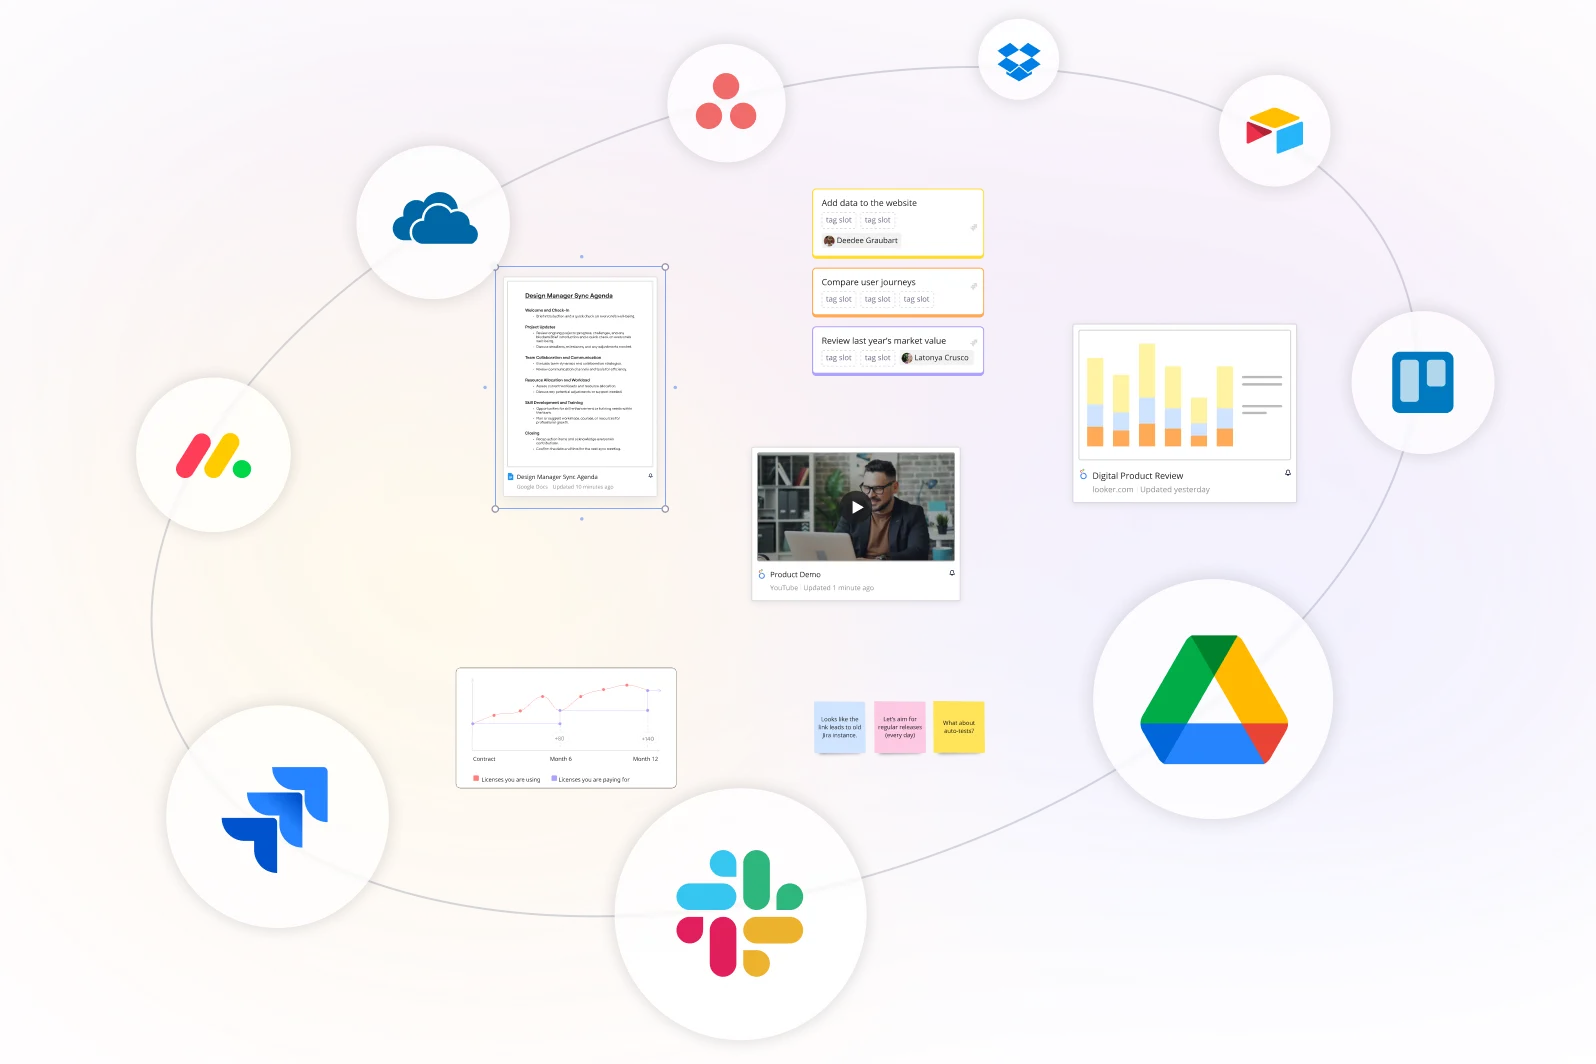
Work with your favorite tools
Miro’s extensive integrations make it easier to pull up-to-date info from apps like Jira, G Suite, Salesforce, and more directly into your board. Make a Gantt chart online with everything you need and quickly bring your team up to speed.
Integrated with your favorite tools
Related templates


What are Gantt charts?
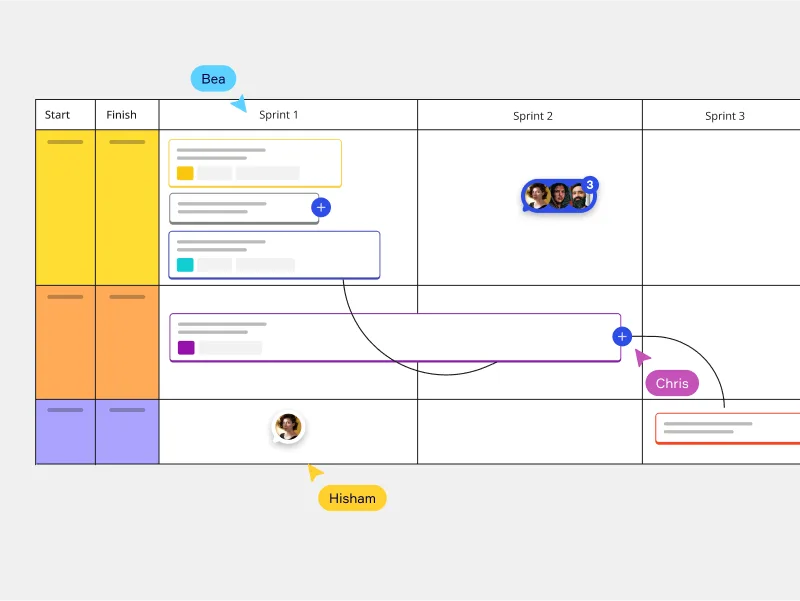
How to make a Gantt chart with Miro
Once your chart is set, share it with your team and stakeholders. Miro makes it easy to gather feedback, confirm priorities, and keep everyone committed to the same timeline. If you want to go further, check out our comprehensive guide to building a Gantt chart for a full breakdown of best practices.

Discover Miro's capabilities

The world's most innovative companies are collaborating in Miro, everyday
“With Miro, we went from project brief to in-market launch in 10 months. That usually takes 3 years at PepsiCo.”
Caroline de Diego
Senior Manager, Global Design & Marketing Innovation at PepsiCo

“Bringing everyone together to plan in Miro means the most impactful initiatives will happen at the right time.”
Lucy Starling
Product Operations Lead at Asos

“The team onboarded in 10 minutes to use Miro for workshops. Getting our organization to adopt this product was a no-brainer.”
Konrad Grzegory
Agile Transformation Lead at CD PROJEKT RED

“Miro templates helped us go from scratch to a full-fledged plan where we mapped activities, ideas, and dependencies.”
Marc Zukerman
Senior Director of Project Management at Hearst

“Miro allows all our teams to align themselves with certain tools and models: they work independently and create products that really meet our customers' needs.”
Luke Pittar
Sustainability Innovation & Design Coach at The Warehouse Group

“To be truly innovative, everyone needs to have a voice, and everyone needs to be able to iterate on each other’s ideas. Miro has made that possible for us.”
Brian Chiccotelli
Learning Experience Designer at HP

Users love Miro for end-to-end innovation. We're the G2 leader in visual collaboration platforms and are rated in the top 50 enterprise tools. Miro helps large companies get meaningful work done.
Top 50 Products for Enterprise
G2 reviews

Gantt chart maker FAQs
How do I create a custom Gantt chart?
First, select our ready-made template or create your Gantt chart from scratch using Miro’s diagramming tools. To customize it to your needs, add your project tasks, timeline, and task duration. Color-code tasks per department or assignee and assign them to the respective stakeholders. With Miro’s Gantt chart maker, it’s easy to edit colors and fonts and adjust your chart layout.
How can I present my Gantt chart?
If you use Miro, you can build your presentation and make your Gantt chart on the same board. Make sure you add your Gantt chart to the correct presentation frame. If you use other presentation tools, download your Gantt chart as an image or PDF file.
How does Miro help my team collaborate on Gantt charts?
Miro keeps collaboration connected by letting teams build, edit, and comment on Gantt charts in real time or asynchronously. You can assign tasks, @mention teammates, and track dependencies all on one shared canvas.
Are there templates available to speed up Gantt chart creation?
Yes. In Miroverse, our community library, you’ll find templates for Gantt charts, project roadmaps, and other workflows shared by teams across industries. You can customize them instantly to fit your project and avoid starting from scratch.
What’s the learning curve for using Miro AI with Gantt charts?
Miro AI is simple to learn because it builds on workflows your team already knows. Just describe your project or select content on your board, and the AI will help structure timelines, tasks, and dependencies automatically. Most teams see value in their first planning session.
How much does Miro AI cost?
Miro AI is included on all plans, from Free to Enterprise, through a shared credit system. Each AI action - like generating a Gantt chart outline, adjusting dependencies, or summarizing updates - uses one credit.
Plans come with different credit amounts, and additional bundles are available if your team needs more.
Can Miro handle complex, large-scale projects?
Absolutely. Miro is built to manage projects of all sizes, from small team sprints to global initiatives. You can layer multiple timelines, integrate with tools like Jira, and keep everything linked back to your broader strategy.
Can I adapt Gantt charts in Miro to match my workflow?
Yes. You can create Gantt charts from scratch or start with a template, then customize colors, milestones, and dependencies. You can also combine Gantt charts with other Miro features, like brainstorming boards or journey maps, for a tailored workflow that fits your team.
Does Miro connect Gantt charts with tools like Jira?
Yes. Miro integrates with over 160 tools, including Jira, Asana, and Google Workspace. You can drag Jira issues directly onto your Gantt chart, and updates will stay synced between platforms - keeping planning and execution aligned.
How do I know my team’s project data is secure in Miro?
Miro is built with enterprise-grade security to protect your data. We provide advanced controls for user and access management, ensuring you can manage who sees what. You can plan and execute with confidence knowing your team’s sensitive work and strategic projects are secure.
What is the difference between a Gantt chart and a project timeline?
A project timeline is a high-level visual showing milestones and key dates in chronological order. It's simple, easy to share with stakeholders, and useful for communicating the big picture. A Gantt chart goes deeper: it breaks the project into individual tasks, shows their duration as bars on a timeline, maps dependencies between tasks, and often includes resource assignments. Use a timeline for strategic communication, and a Gantt chart for active project planning and execution.