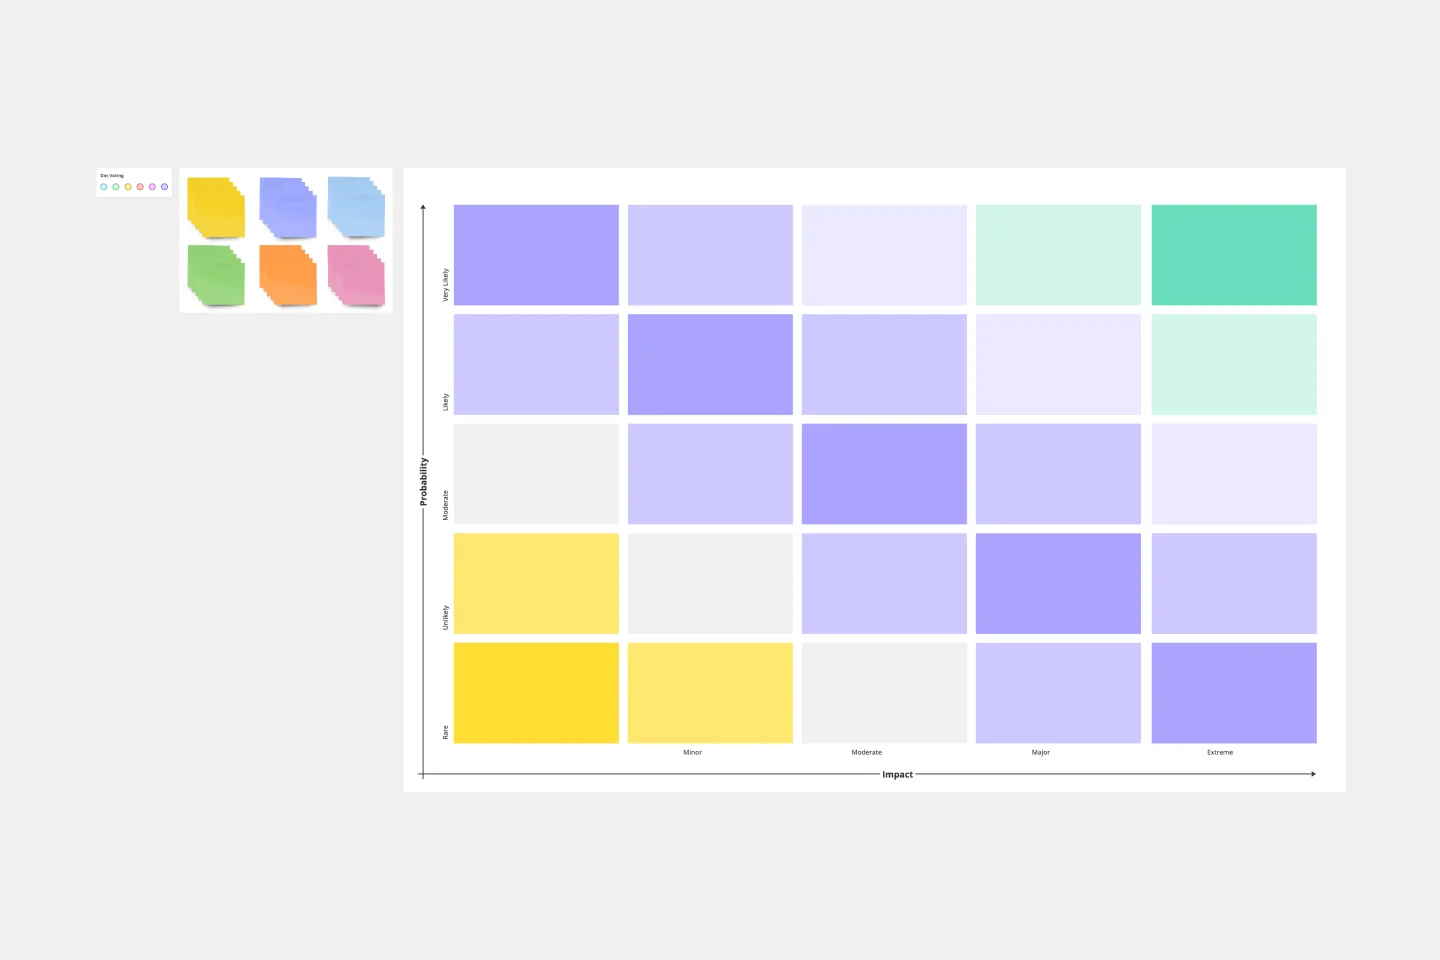
Also known as a Probability and Impact Matrix, the Risk Heat map represents the urgency of risk response planning in 'traffic light' colours, which allow teams to visualise and prioritise risks that need urgent mitigation.
For a quick introduction, visit: Probability And Impact Matrix.
For in-depth information, visit: Risk analysis and management a vital key to effective project management
Credits: The origin and original creator of the Risk Heat Map republished here is not known. Please reach out if you know the creator as I would like to credit them.