
Alon Binman
Sr Solutions Architect @ Mixpanel
Sr. Solutions Architect at Mixpanel - Helping the worlds leading product teams build better products. Understanding the need behind the customer need and creating a solution that really-fits and simplifying the needs into actions that support the client results.
Categories
Similar templates
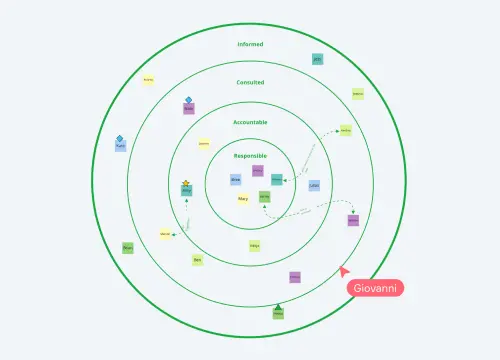
Stakeholder RACI Map
512 likes
3.5K uses
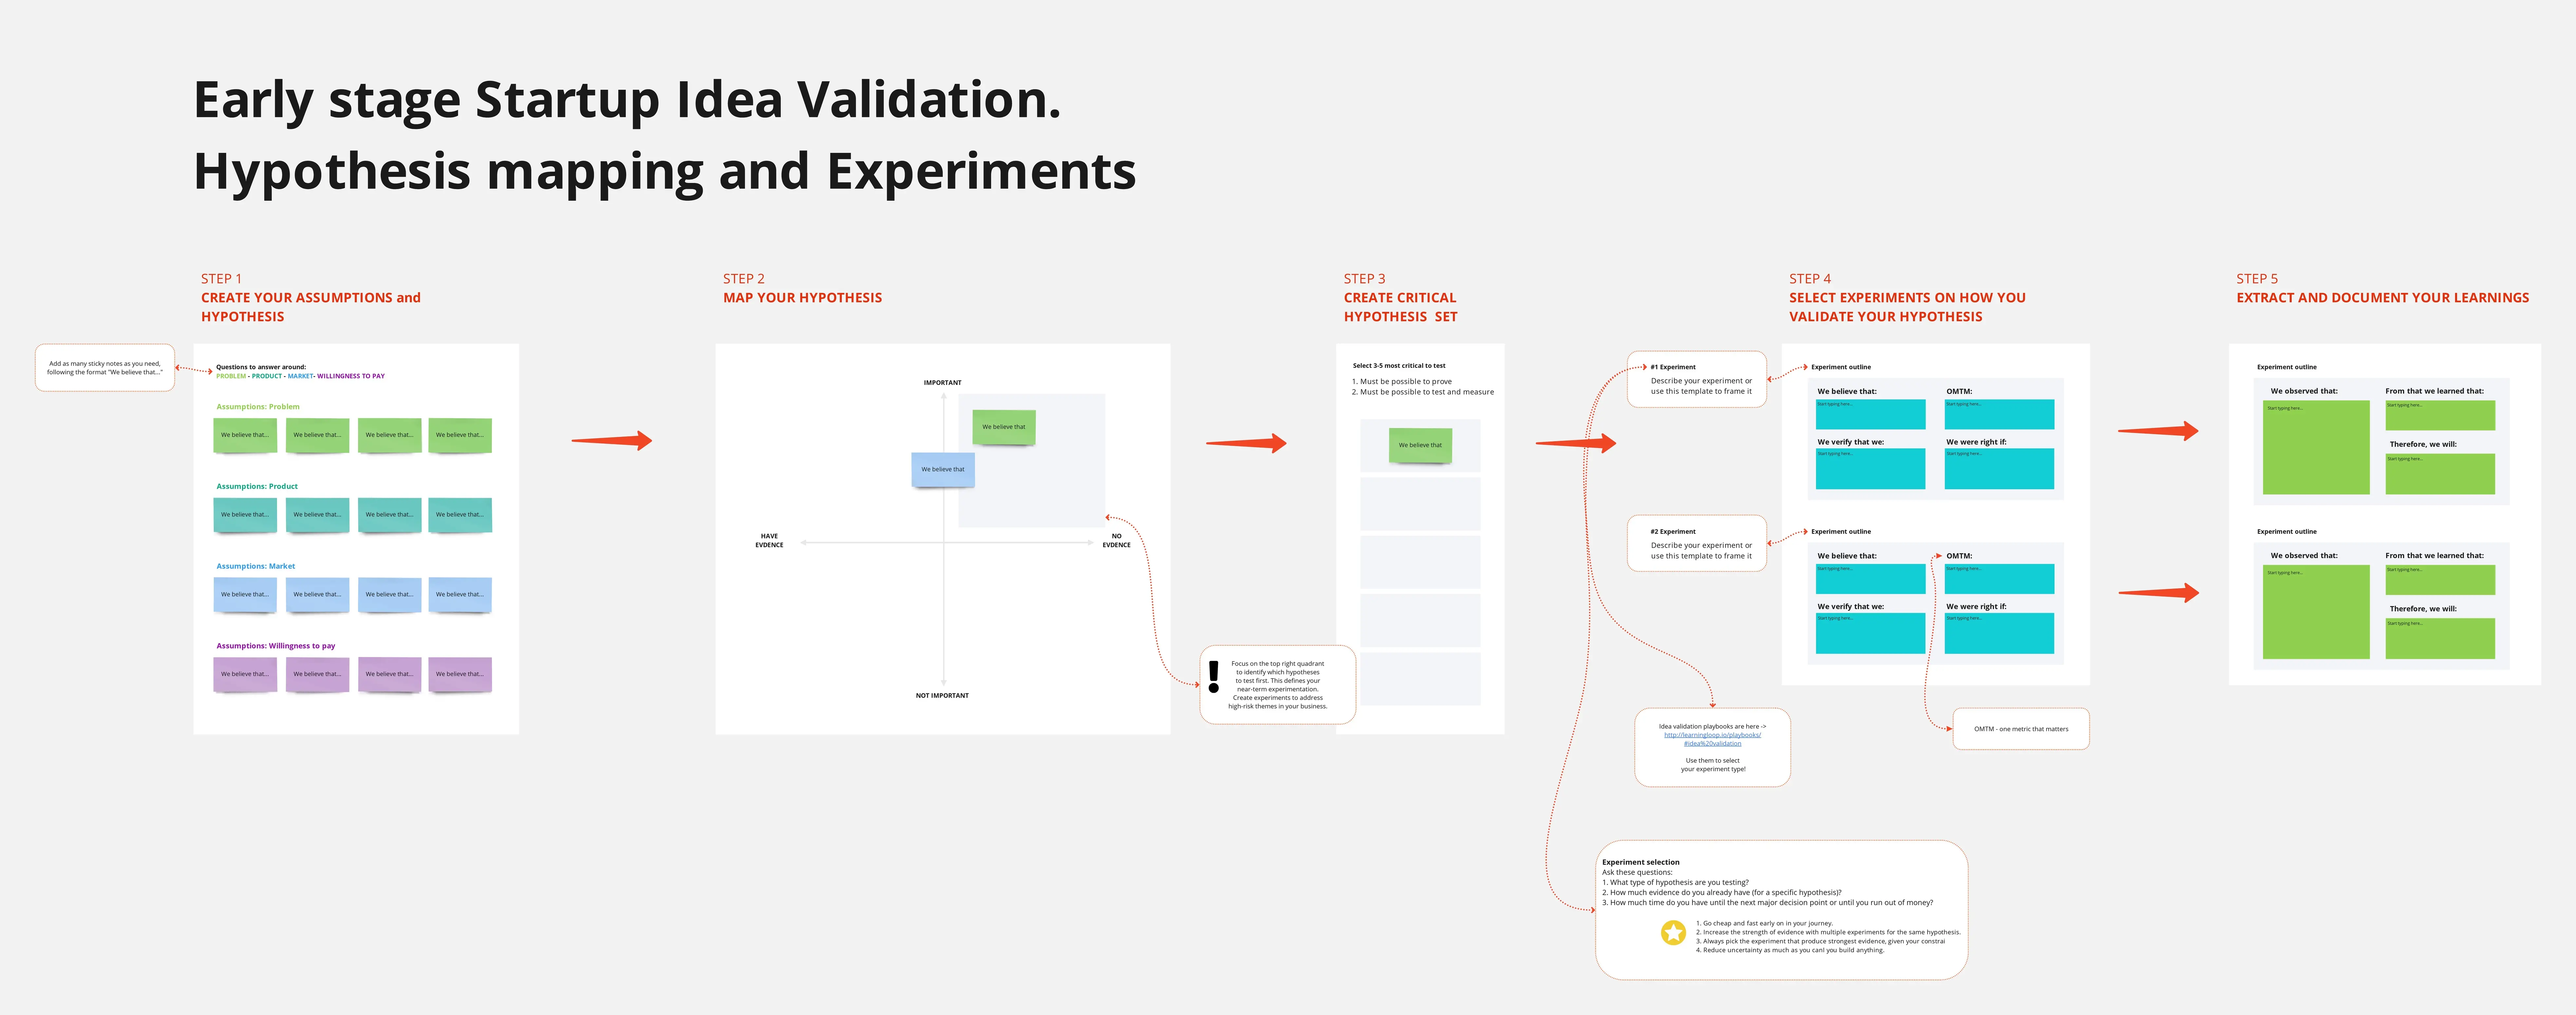
Early Stage Startup Idea Validation
362 likes
1.5K uses
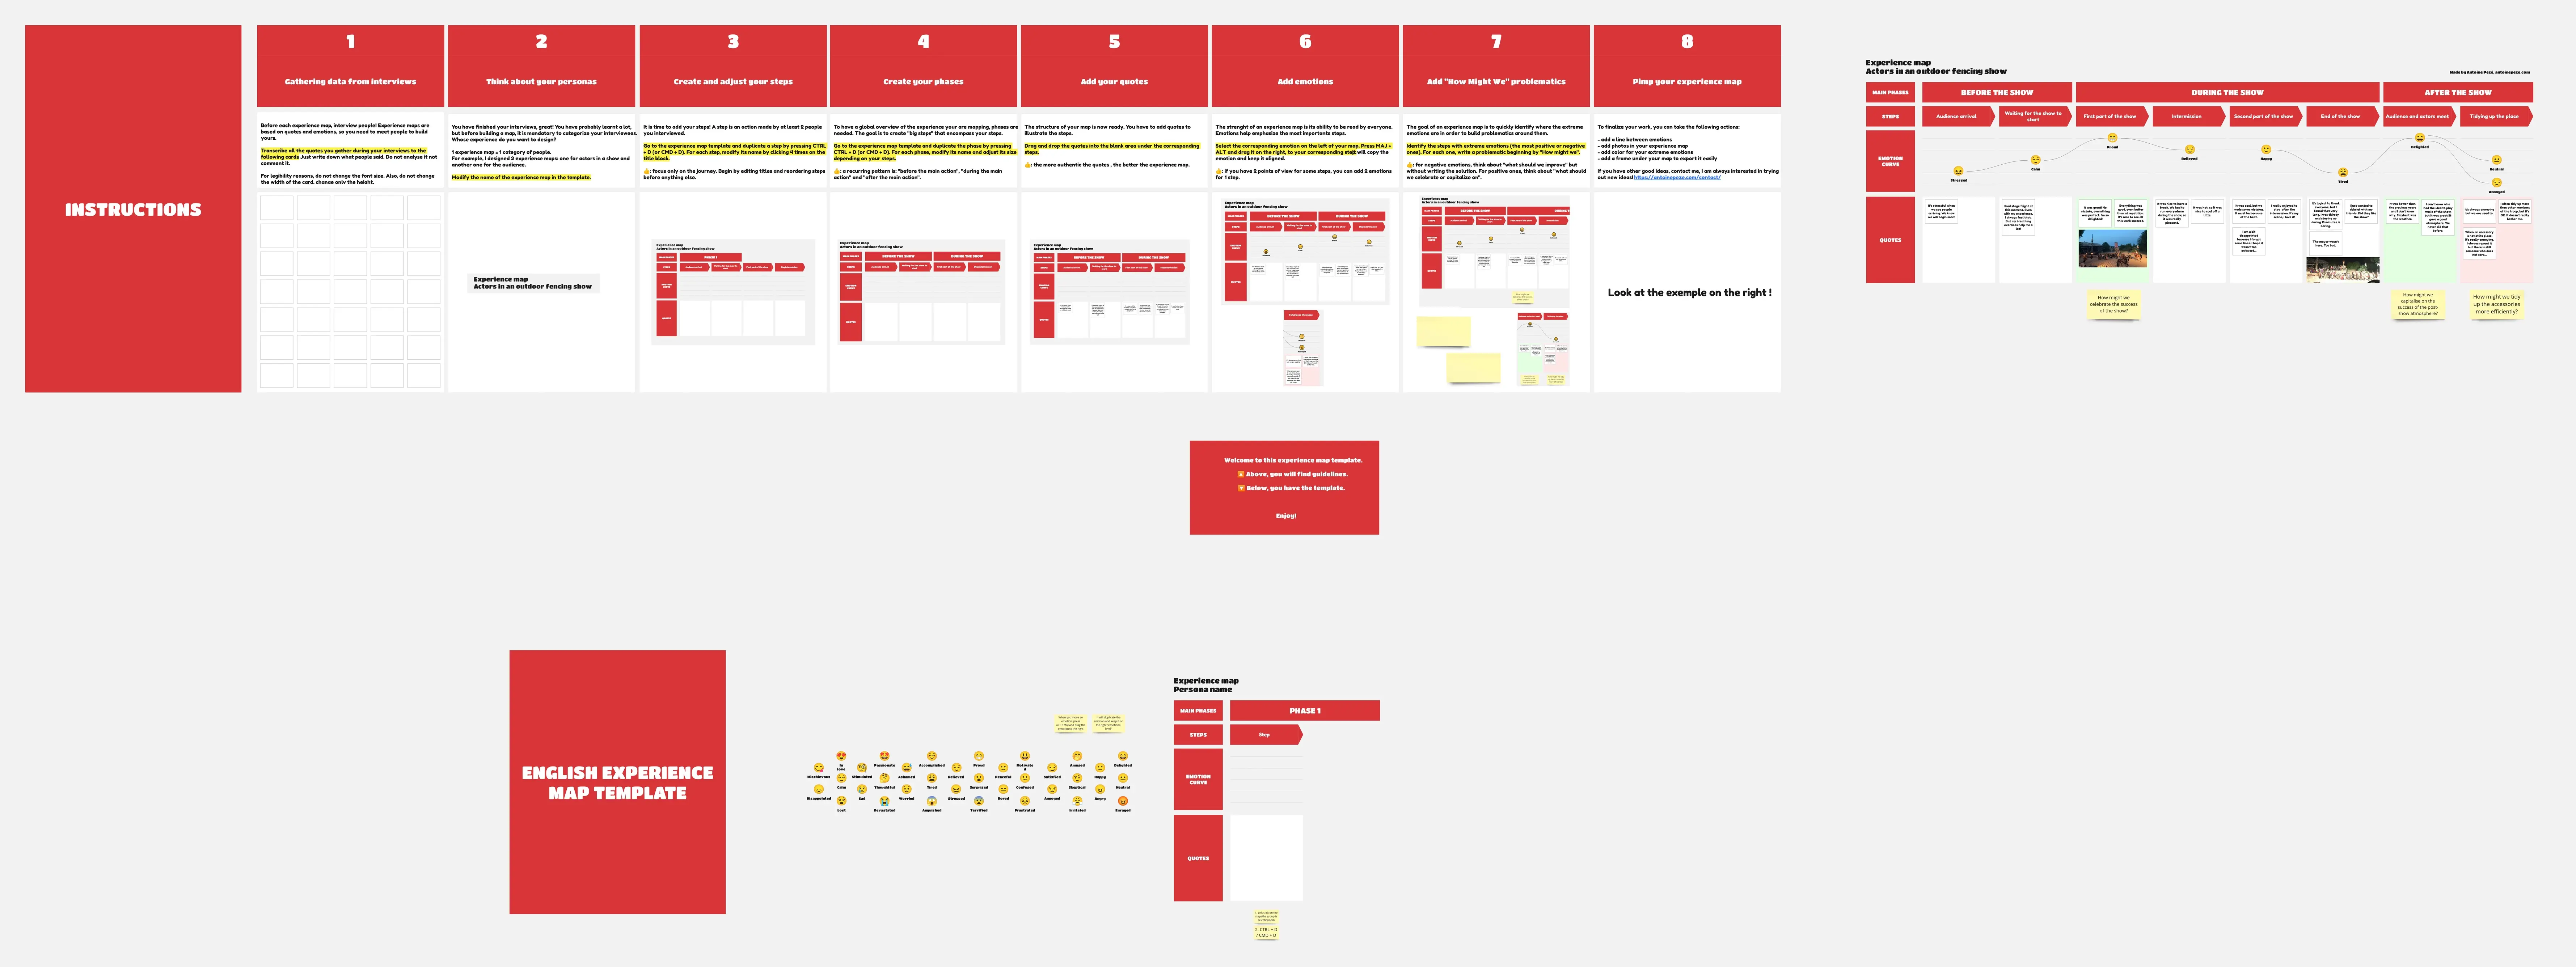
Experience Map Template
333 likes
1.9K uses
Stakeholder RACI Map
512 likes
3.5K uses
Early Stage Startup Idea Validation
362 likes
1.5K uses
Experience Map Template
333 likes
1.9K uses