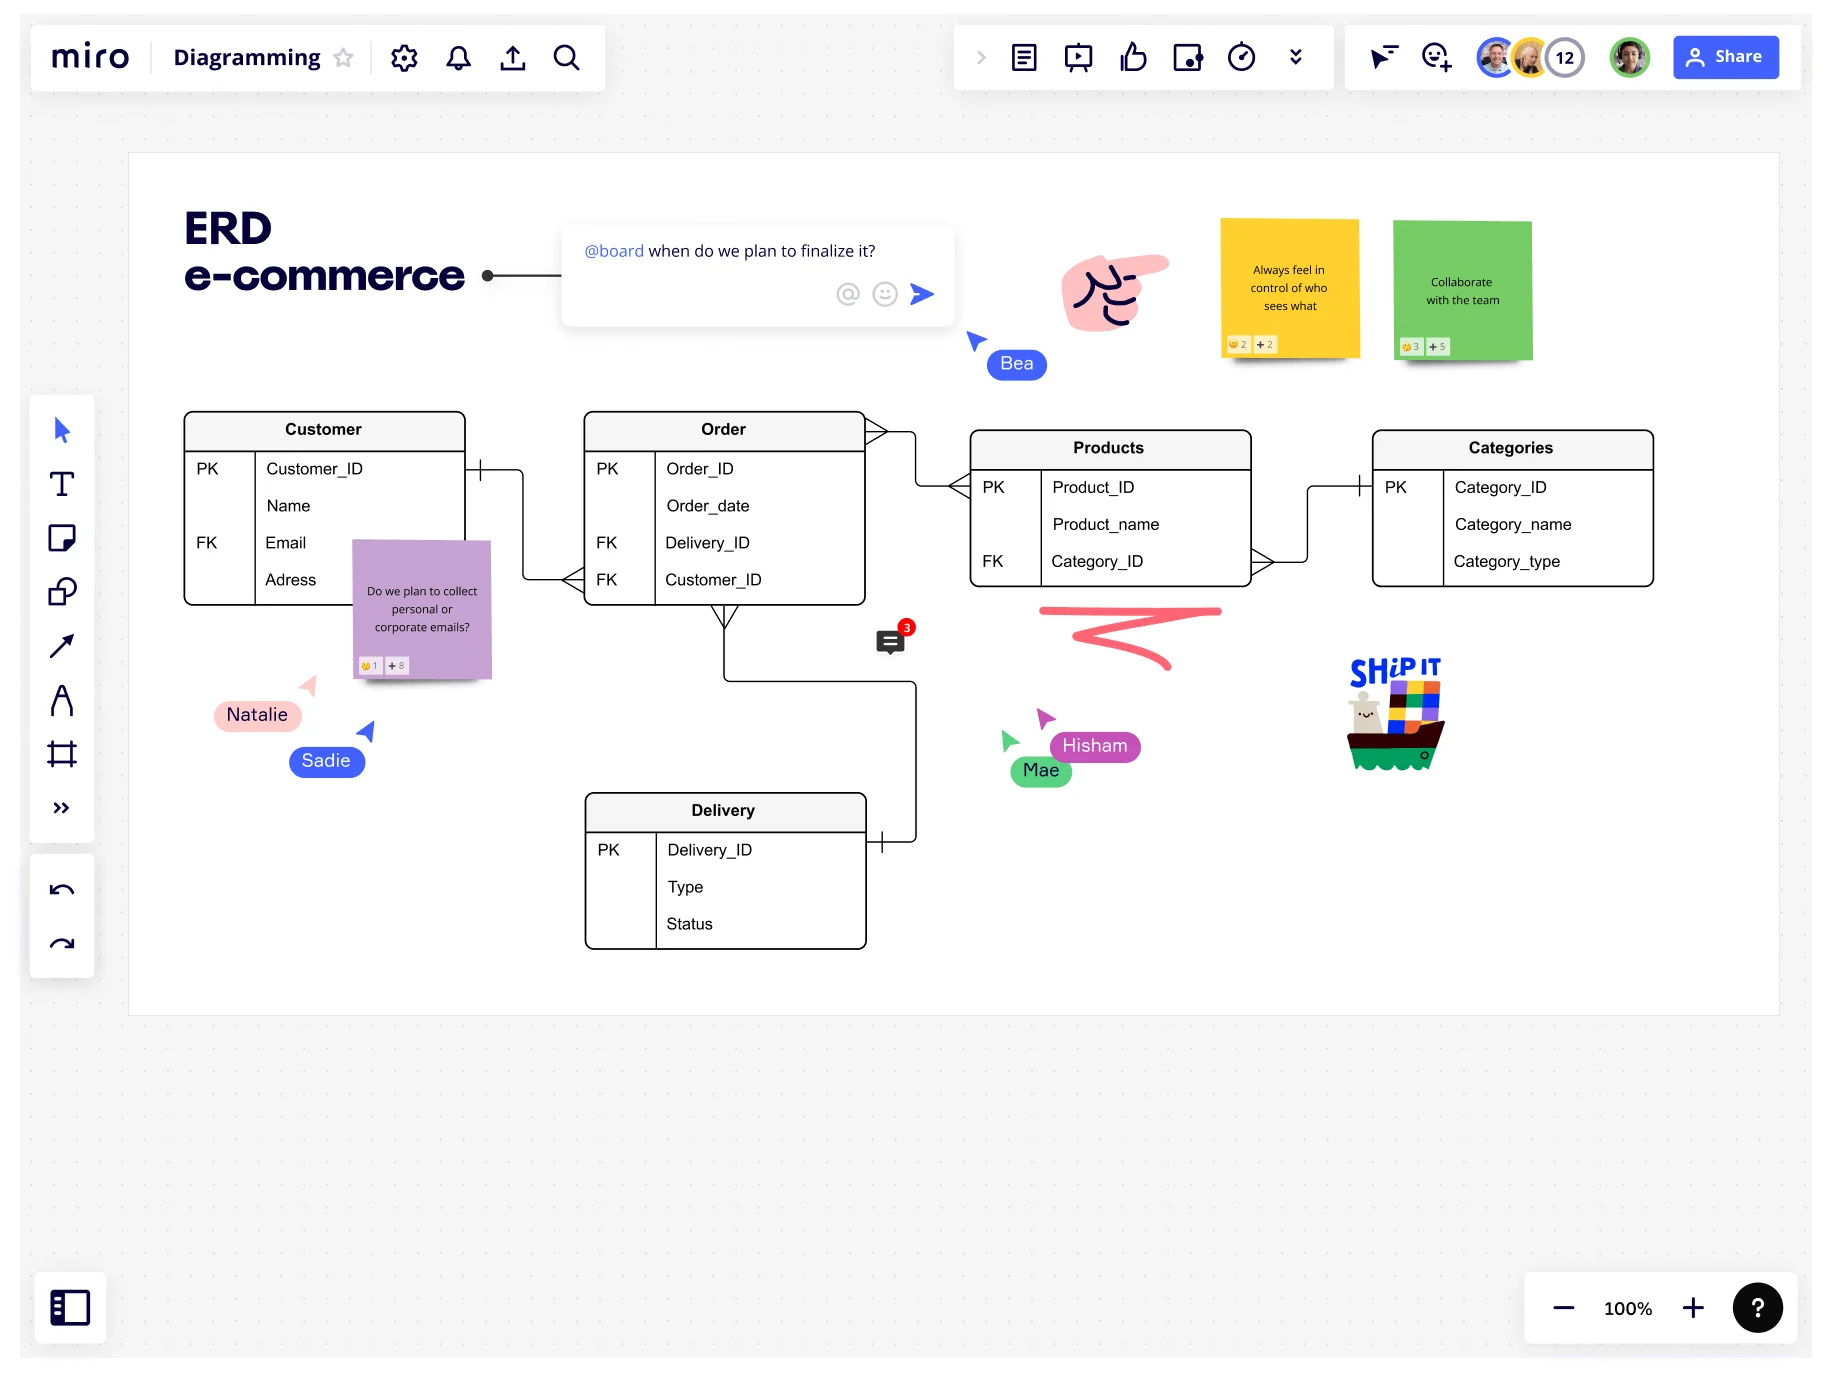
ER Diagram symbols

Summary
In this guide, you will learn:
- Basic ER diagram symbols: rectangles for entities, ovals for attributes, and diamonds for relationships.
- How to represent many-to-many relationships in ER diagrams.
- Advantages of using Miro’s ER diagram tool for database modeling.
- Ways to build ER diagrams efficiently in Miro.
- Importance of cardinality notation and current limitations in Miro.
- Practical applications of ER diagrams in database schema design.
Try Miro now
Join thousands of teams using Miro to do their best work yet.
ER Diagram Symbols: A Comprehensive Guide
Entity-Relationship (ER) diagrams are a cornerstone in the world of database design and engineering. They provide a visual representation of the data and its relationships within a system. In this article, we will give a quick look on ER diagram symbols, exploring their significance, variations, and applications in engineering and related fields. Understanding these symbols is crucial for professionals who aim to design efficient and effective database systems.
Quick overview of ER diagrams
ER diagrams are a type of data modeling technique used to represent the logical structure of databases. They illustrate how entities (such as objects, people, or concepts) relate to each other within a system. The primary purpose of ER diagrams is to provide a clear and organized visual representation of data requirements and database components. You can also check this complete guide about Entity-Relationship Diagrams (ER).
Basics symbols of ER diagrams
Rectangles
In ER diagrams, rectangles are used to represent parent entities. For instance, a rectangle labeled "Employee" might depict the employee entity in a database. A notable variation of this symbol is the use of double rectangles, which denote weak entities. These weak entities, such as a "Contract" labeled double rectangle, rely on a parent entity for their existence and cannot stand alone.
Ovals
Ovals in ER diagrams symbolize the attributes, which are characteristics or properties of an entity. For example, ovals connected to the "Employee" rectangle could include attributes like "Employee ID," "Name," and "Date of Birth." A special variation of this symbol is the double oval, used for multi-valued attributes. These attributes can have multiple values for a single entity, such as a double oval connected to "Employee" representing "Skills," indicating that an employee can possess multiple skills.
Diamonds
Diamonds are employed to show the relationships between different entities. A diamond labeled "Manages" placed between "Employee" and "Department" entities, for example, indicates a management relationship. In some cases, diamonds are expanded into rectangles to represent associative entities. These associative entities encapsulate a relationship with attributes, like a rectangle labeled "Project Assignment" that connects "Employee" and "Project" entities.
Arrows and Connection Lines
Lines and arrows are crucial in illustrating the connections and relationships among entities. A line connecting the "Employee" and "Department" rectangles, for instance, shows their association. Directed arrows, a variation of this symbol, indicate the direction of a relationship, particularly in one-to-one or one-to-many relationships. An arrow pointing from "Employee" to "Department" might signify that each employee belongs to one department.
Cardinalities
Cardinalities in ER diagrams outline the nature and degree of relationships between entities, such as one-to-one, one-to-many, or many-to-many. An example of this is a '1' near "Employee" and an 'N' near "Project" on a connecting line, indicating that one employee can work on multiple projects. Participation constraints, another variation, indicate whether the participation of an entity in a relationship is optional or mandatory. For example, a line connecting "Employee" to "Project" with a small circle on the "Project" end suggests that participation in a project is optional for employees.
Additional Symbols
ER diagrams also include ellipses for derived attributes, which represent attributes that are derived from other attributes. An ellipse labeled "Age" connected to "Date of Birth," for instance, indicates that age is calculated from the date of birth. Another symbol is the use of dashed lines for inheritance or subtyping. This indicates that an entity inherits attributes from another entity, such as a dashed line from "Manager" to "Employee" showing that "Manager" is a subtype of "Employee" and inherits its attributes.
Understanding these symbols and their variations is essential for accurately interpreting ER diagrams. For those seeking a more comprehensive understanding, resources like how to read an ER diagram offer in-depth insights.
The 3 core components of ER Diagrams
Entities
Entities are the fundamental components of ER diagrams. They represent real-world objects or concepts within a database. In an engineering context, an entity could be a machine part, an employee, or a project. Entities are characterized by their attributes and defined by a unique identifier, often referred to as a primary key.
Attributes
Attributes provide details about entities. They are the properties or characteristics of an entity. Attributes can be key (unique identifier), descriptive (providing details about the entity), or composite (consisting of multiple properties). Attributes play a crucial role in defining the properties and characteristics of entities, making them an integral part of ER diagrams.
Relationships
Relationships depict how entities interact with each other within the system. Relationships can be one-to-one, one-to-many, or many-to-many, each representing different types of associations between entities. They are crucial in defining how entities are interconnected and interact within the database.
Conclusion
ER diagram symbols form the language of database design and modeling. Their understanding is imperative for professionals in engineering and related fields. As we advance technologically, the role and complexity of ER diagrams are set to increase, making them an indispensable tool in the world of data and system management. Be sure to choose an ER diagram maker like Miro that covers all the standard shape packs and has features to make your diagramming process effortless.
Author: Miro Team
Last update: October 7, 2025