
Trying to make high-level decisions about the future of your company can feel overwhelming. Trust us — we know first-hand what that feels like here at Miro. Companies often set up special committees that take months — or even years — and dozens of meetings before committing to a path.
But in the 21st century, the first mover’s advantage is more crucial than ever. You need to prioritize fast without letting biases affect how you invest your capital and effort.
That’s where the BCG (Boston Consulting Group) Matrix comes in. It’s a portfolio management tool that helps your company prioritize different businesses or products to get the best long-term results.
Let’s dive into everything you need to know about a BCG Matrix.
Try Miro’s BCG Matrix Template
BCG Matrix definition: What is a Growth Share Matrix?
The Growth Share Matrix, also known as the BCG Matrix, is a portfolio management framework developed by the Boston Consulting Group’s founder in 1968.
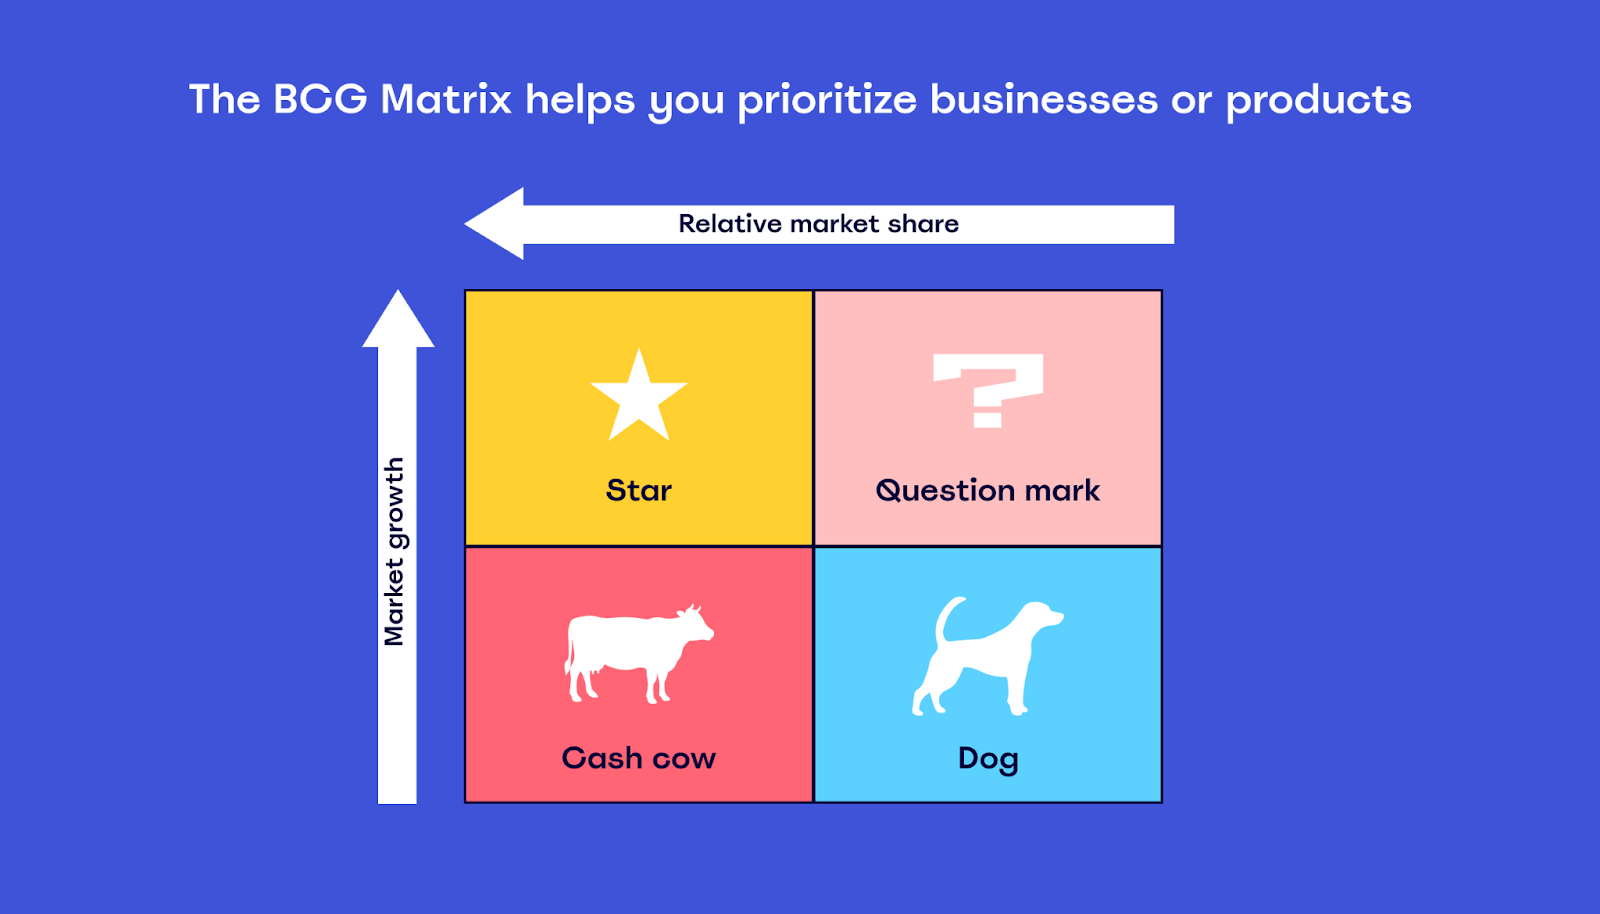
It divides a company’s business units into categories based on their respective market shares and market sizes. To help you roughly estimate the profitability of a business, the matrix uses the two metrics of relative market share and market growth rate.
- Relative market share: Your share of the market compared to your largest competitor.
- Market growth rate: The rate at which a certain market grows in revenues compared to the previous year.
Based on these two metrics, you divide your company’s businesses or products into four categories:
- Stars: High market share in a high-growth market.
- Cash cow: High market share in a mature market.
- Dogs (or pets): Low market share in a market with a slow growth rate.
- Question marks: Currently low market share in a fast-growing market.
The different categories help you simplify complex decision-making about investment and business focus. Companies use the framework to decide which businesses or products to invest in to maximize growth potential and profitability.
While first created to manage product lines for manufacturing companies in the ‘60s and ‘70s, it’s equally relevant for tech startups that offer a variety of digital services. Just because you deal in pixels doesn’t mean you’re immune to regular business mistakes like overspending on a product with little potential.
The BCG Matrix can help you make sense of your portfolio of products and make smarter decisions about future investments in both R&D and marketing. If you’re struggling to visualize it, don’t worry. Below, we’ll cover a real example and showcase how the different categories work.
BCG Matrix example
The table below shows a fictitious company’s product line, including necessary metrics for using the BCG Matrix.
It includes the revenues, the largest competitor’s market share — the local market leader — the product’s market share, and the market growth rate.
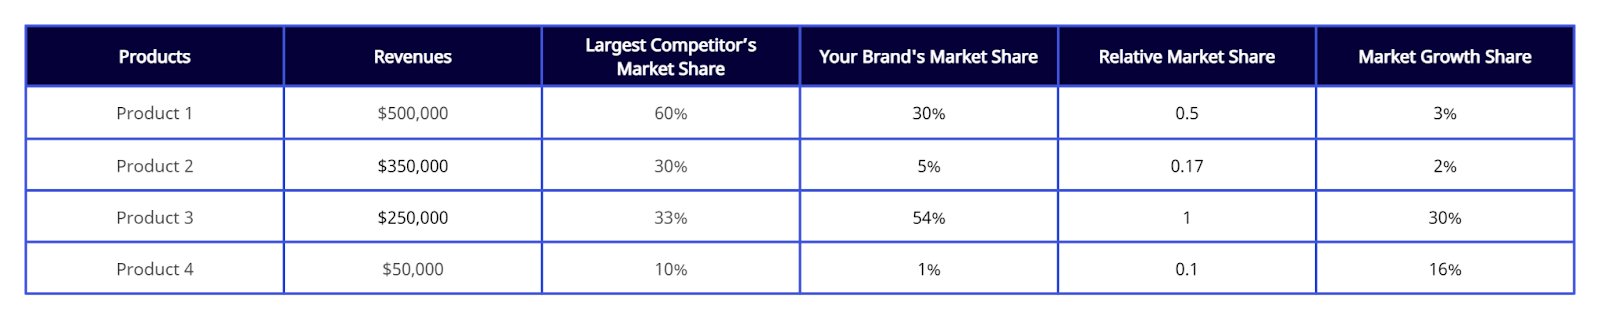
If we put these products through the BCG Matrix, #1 is a dog, #2 a cash cow, #3 a star, and #4 a question mark.
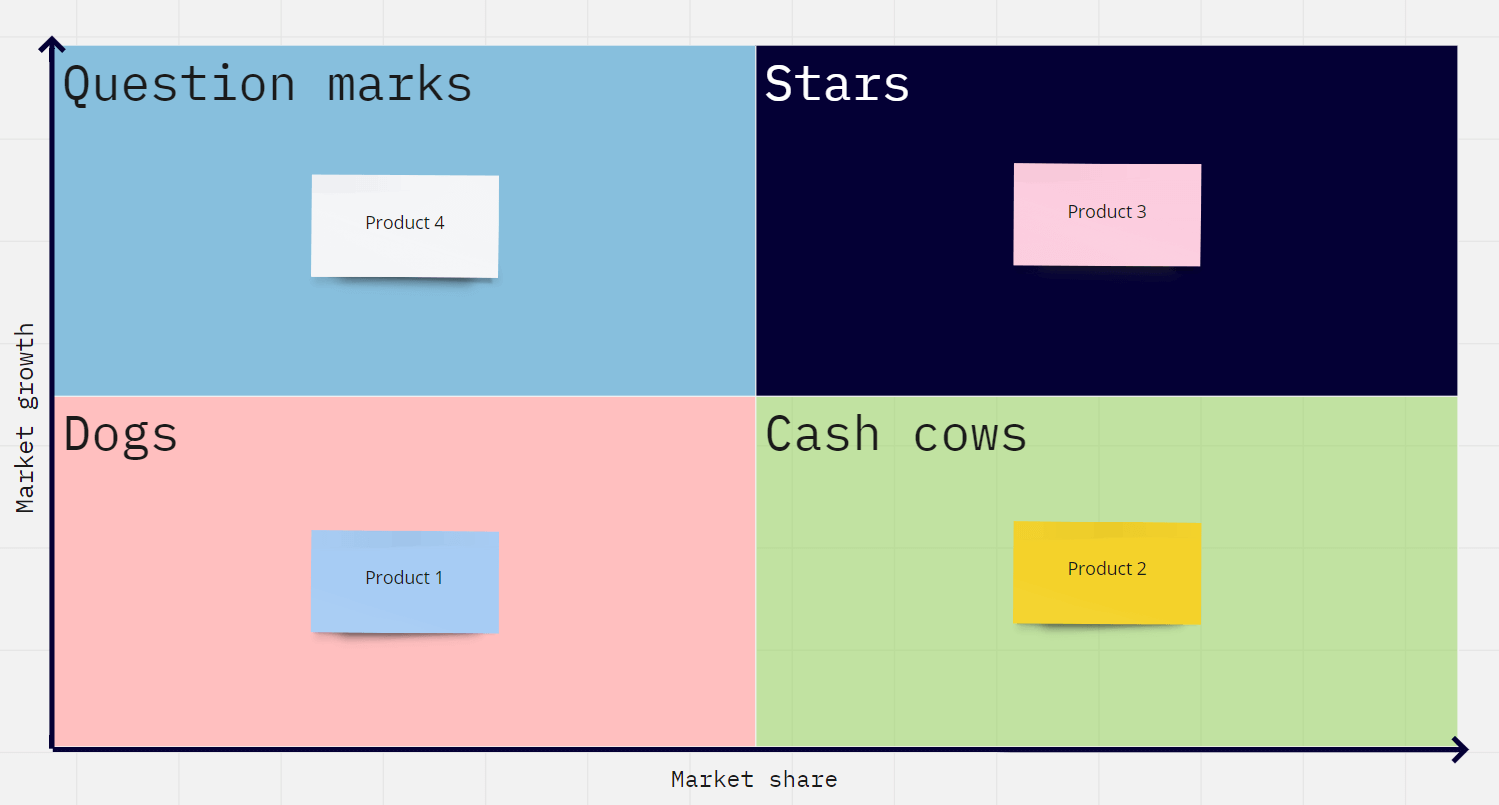
As you can see, the quadrants have nothing to do with the objective revenue numbers. It’s all about where the market is going and how your product’s doing within that market.
But before you dive in and create your own, you should understand the benefits and your ultimate goal for creating a BCG Matrix in the first place.
Why you should use a BCG Matrix — key benefits
You should use a BCG Matrix because it helps you prioritize business and products, cut waste, and create a robust portfolio.
Let’s break down these benefits.
Prioritize the right business or product quickly to establish a first-mover advantage
Instead of focusing on dying products or cash cows that sustain themselves without much effort, your company can focus on creating new winning products and businesses.
For example, your star product has the lion’s share of the market in a marketplace that’s growing at a rapid pace. Focusing on this business unit would be the smart move going forward.
Eliminate wasteful spending by cutting your losses
A dog product or product line can weigh down your company’s capital and manpower when you’d be better off selling it off and focusing on your winners.
By identifying a business as a dog — something with limited growth potential — you can cut your losses by selling the business or even, if it’s not profitable, simply closing it down.
For example, realizing that its TV business was a dog, Phillips decided to sell off its TV business unit in 2012. The company was coming off record deficits in 2011 and decided to cut its losses.
Since that decision, the company has refocused on other areas and regained healthy profitability.
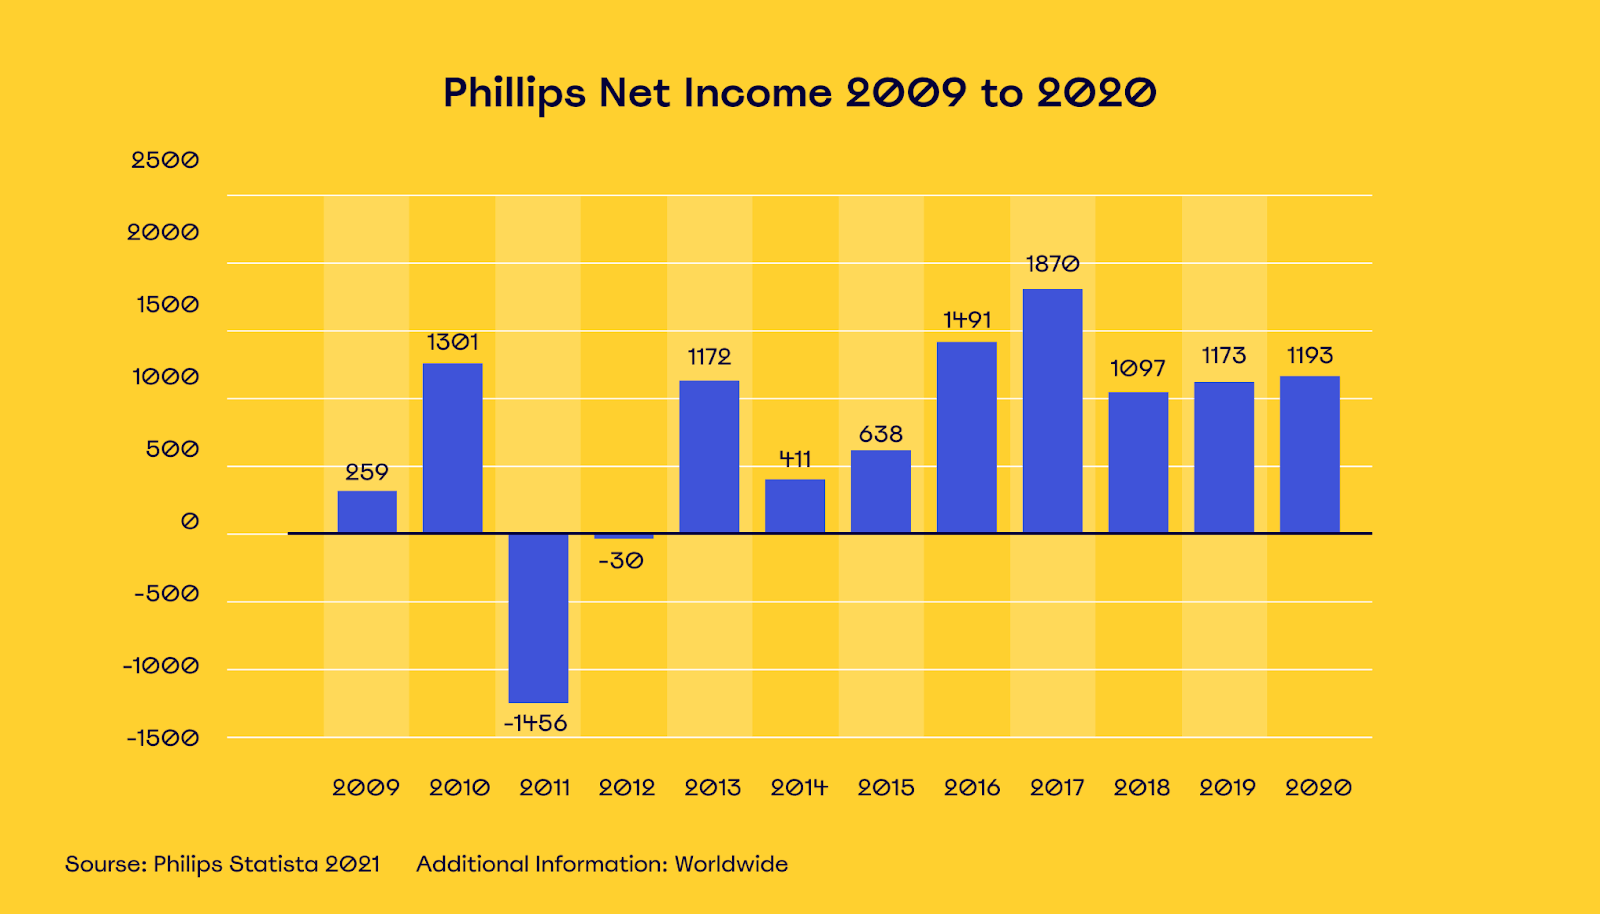
It is one of the most iconic success stories of selling off and divesting from a “dog” product line in modern history.
Create a more robust and balanced portfolio
Ultimately, the goal isn’t to succeed in one area but to better balance your company’s investment of capital and effort across your entire portfolio. By placing bets on high-growth markets while maintaining healthy cash cows, you can future-proof your company.
If you’re looking for a similar tool to help you plan the journey of a single product, you could try impact mapping.
What are the four quadrants of the BCG Matrix?
The four quadrants of the BCG Matrix are stars, dogs, cash cows, and question marks.
While we’ve roughly covered them above, let’s explore each category a bit closer, using real product examples.
Cash cow
A cash cow is a well-established business with stable brands in a mature market.
An example of a cash cow business is the domestic soft drink business in the U.S. for Coca-Cola, where the company maintains a 44% share of all revenue.
The market has long since matured and is growing at a fairly slow rate at about 5.1%, which is currently lower than the U.S. rate of inflation.
So, it’s a low-growth market with little potential for future growth, but the business is a winner — AKA a cash cow.
Star
An example of a star is Amazon’s Amazon Web Services business that provides cloud services to B2B customers. The company has a 32% market share, and the public cloud industry is growing rapidly, forecasted to grow 21% in 2021 alone.
This type of market-leading product in an industry that’s virtually exploding is what we call a star.
Dog (pet)
Phillips’ television business — which we covered earlier — is an example of a dog, where the company had a low market share in a mature marketplace.
Question mark
Kia’s electric vehicle business is a good example of a question mark. Although it currently has a small market share of around 2.1%, the EV market is rapidly growing globally, at an expected average rate of 24.3% in the U.S. until 2028.
Because of the rapid growth of the market, there’s plenty of opportunity for new players to establish themselves.
How to calculate relative market share in the BCG Matrix
Before you can categorize your businesses, you need real data to see where they stand in the marketplace. The relative market share is one of the key metrics you use in the BCG Matrix.
Let’s break down how to calculate it.
Find a reliable source for up-to-date marketplace data
There are a plethora of market research firms that sell industry data of varying levels of accuracy online.
Either find a firm that specializes in your industry and locations and offers the most accurate data, or establish your own in-house research team.
The important thing is to find a reliable source of the latest, up-to-date market information. Without accurate data, your product portfolio decisions are going to be more luck than judgment.
Identify your largest competitor’s market share
Examine the marketplace data and find your largest competitor for the specific product you’re researching.
Try to find its latest revenue numbers. The company may release revenue data by sector or even product in its quarterly reports. Get as specific as possible to use accurate numbers on the actual business area you want to compare.
Divide your market share by the largest competitor’s market share
The formula to find your relative market share is super simple — just divide your market share (or revenues) by that of your largest competitor.
For example, if your main competitor sells $600,000,000 in tablets and you sell $150,000,000 worth of tablets per year, your relative market share is 0.25.
The relative market share focuses on the importance of “owning” a market, which typically means stable income even without large marketing efforts.

The role of the BCG Matrix in strategic management
Strategic management is the process of using objectives, procedures, and initiatives to make a company more competitive.
Instead of vague guesswork and thinking, you use formalized processes and real data to come up with objectives and strategies.
For example, this could be investing in researching competitors to explore where your products stand in the marketplace.
The BCG Matrix in itself isn’t the end-all-be-all of strategic management. It’s only a single tool in a larger process.
Start with a planning workshop and creating a big-picture strategy
Don’t try to create a BCG Matrix in a vacuum. Before your company will get anything of value out of it, you need the big picture figured out.
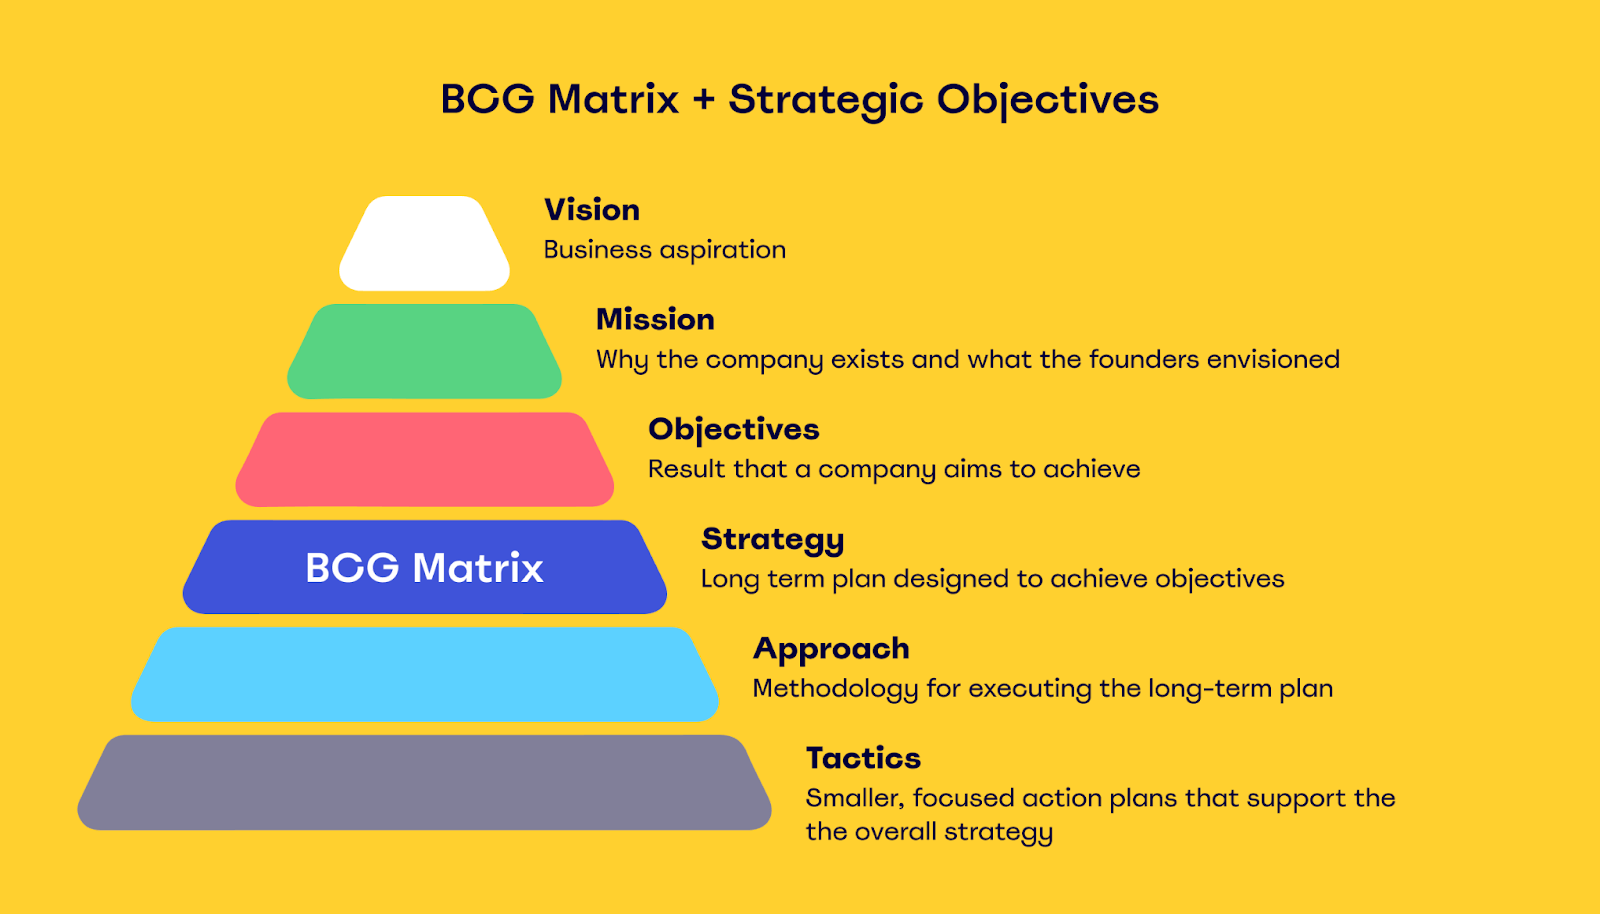
You wouldn’t try to build a house without setting up a robust foundation. So first, you should come up with a vision and strategic objectives for your company based on real data like market research.
A practical way to do this is to arrange a planning workshop with executives and key stakeholders involved with your entire portfolio.
Using a framework like OKR (Objective & Key Results) makes it easier to avoid wild guessing and personal biases.
Combine with strategic objectives to prioritize investments
If your objective is to focus on innovation, double down on stars and question mark businesses in rapidly growing markets, and move some of the marketing and R&D budgets away from stable cash cows.
If it’s to expand globally, focus on the market expansion of an existing cash cow product.
Revise and adapt as circumstances change
It’s important to understand that you’re not going to perfectly predict the path to bombastic success for your company in a single planning workshop and your first BCG Matrix.
As markets and competitors change, you need to adapt your plan and revise your BCG Matrix and priorities.
For example, as market growth peters off, a previous question mark could quickly become a dog, with no real prospects of becoming a winning product for your company.
How to use the BCG Matrix to improve your marketing strategy
The BCG Matrix can also help you optimize your marketing strategy and grow your business with better promotions.
Let’s look at how.
Re-adjust budgets based on the growth Matrix quadrants
The first step is to use the BCG Matrix to recalibrate your marketing budget.
Ideally, you’d do this in a live meeting with every key stakeholder on board. Of course, if everyone doesn’t work in the same office, which is often the case, this can be difficult. But with our BCG Matrix Template, your team can remotely collaborate on a virtual board in real-time.

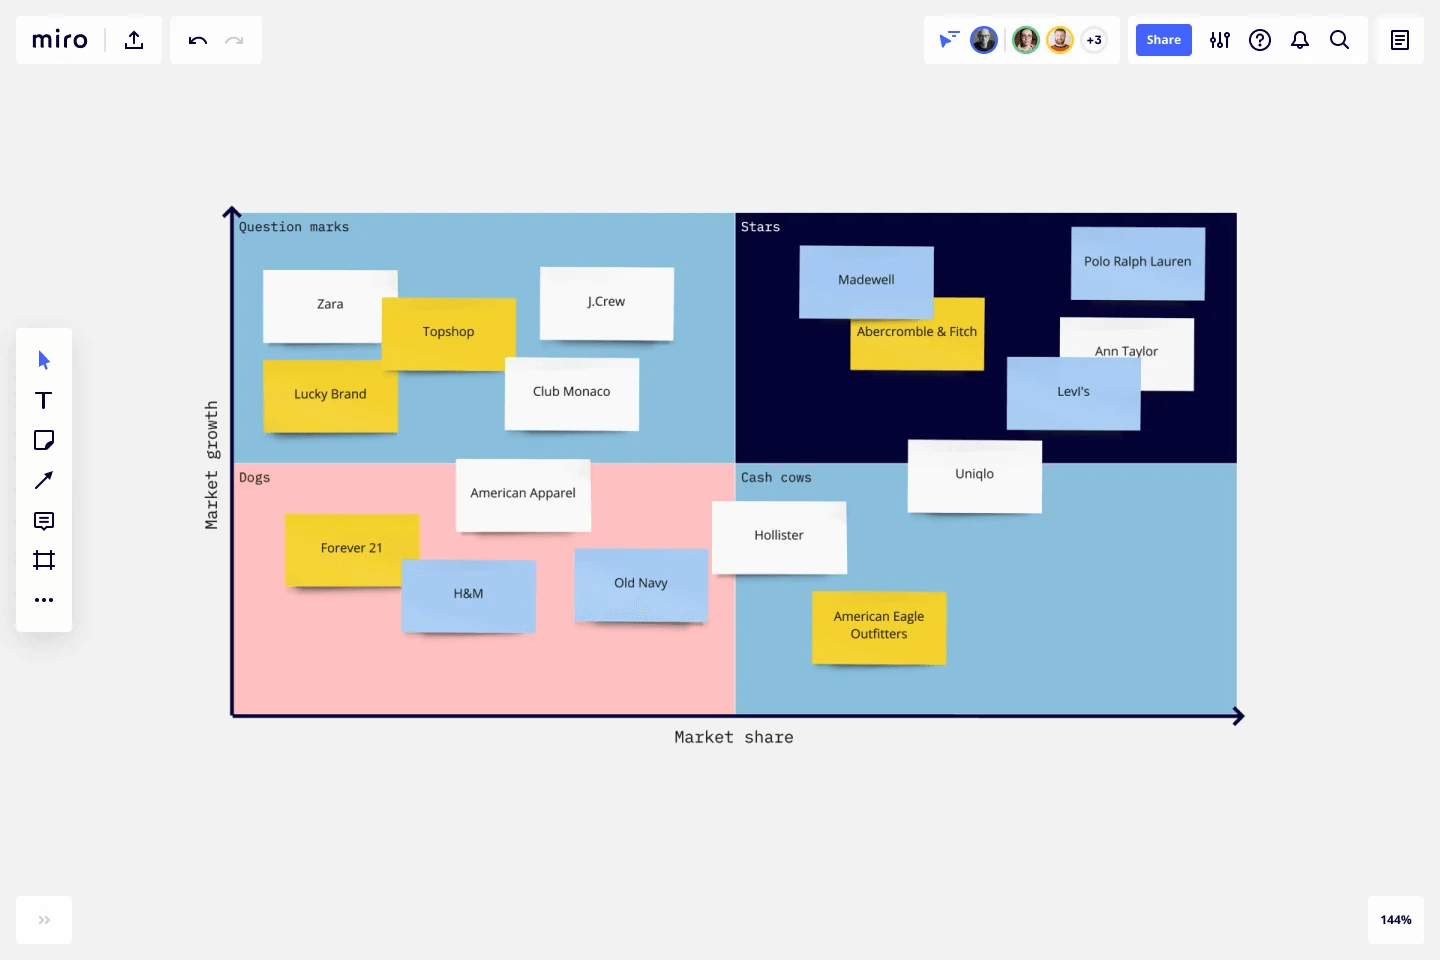
With a visual representation of where the products are in their market, it’s easier to accurately distribute the budget.
If you want to be more aggressive, you can focus on question marks and star products with growth potential rather than the safe and steady cash cows.
Adjust your marketing message based on the state of the market and your brand
If you’re pushing an up-and-coming product, you can’t use the same message as you use for markets where you’re already the go-to brand.
You need to adjust based on your place in the market. For example, Avis had a legendary marketing campaign where the company pointed out that it wasn’t the market leader.
By making the argument that “we work harder since we’re second,” Avis experienced rapid growth and established itself as a strong contender to Hertz in the rental car market.
The average consumer tends to default to familiar products and market leaders because it’s a “safe choice.” Find a unique angle to turn your underdog status into a perceived benefit, not a risk.
Disadvantages of using the BCG Matrix
Just because you can use the BCG Matrix in various areas of your business doesn’t mean you should trust it blindly.
This framework has a number of limitations and issues that make it an imperfect tool for strategic planning.
A high market share doesn’t equal profitability
Just because your product has a high market share doesn’t mean it’s a profitable business. It could be a cut-throat market with high costs, leaving you with bad margins and poor cash generation.
Depending on variations in market size and product type, dogs can actually earn more than cash cows.
It doesn’t account for external factors
The BCG Matrix doesn’t leave room to account for crucial external factors outside the market. For example, the Covid-19 pandemic decimated the tourism sector as a whole, with over one trillion dollars in lost revenue in 2020.
If your company had a plan to expand your tour bus offerings, it’s probably a good idea to put that on hold, even if you could win market share.
Lack of middle ground — only classified low or high
The BCG Matrix tends to deal in extremes — a product either has a low market share or high, with no in-between.
But that’s an overly simplistic outlook on marketplace dynamics. For example, could you truly describe PepsiCo’s share of the U.S. beverage market as low? That’s what you’d have to do if you followed the BCG Matrix formula.
The model is simply too simple
Market growth rates and your relative market shares are important metrics, sure. But on their own, that’s not enough data to make a solid investment or other business decisions.
To make a truly educated decision about your company’s future, you must also consider overall market size, profit margins, operating costs, cash flow, and much more.
So for best results, use it in combination with other frameworks and data when planning budgets and marketing campaigns.
Use the BCG Matrix as a starting point to make better long-term strategic decisions
The BCG Matrix alone isn’t a complete framework that will help you predict the future and always make the right business decisions.
But it’s a great starting point to help you live up to your strategic objectives over the long term.
It forces you to dig up data on your competition and put your products into context, which can help you identify new marketing opportunities.
It’s not a solution on its own, but it can become a valuable tool in your strategic management toolbox.