
To develop products in the right direction, we need to research the experiences of our users, discover their needs and unpack the insights. That’s how we build and design solutions, and the user plays a lead role in this fascinating process. As product managers, designers and researchers, we have a large toolset to discover what our users want and how it corresponds with business needs. But how should we figure out what matters the most? This is where a thoughtful UX survey can be useful. Here are some steps that can help you get the most out of a survey.
Step 1. Make sure a survey is what you actually need
The truth is that not every research project needs a survey. A large number of respondents is often necessary for a hypothesis to be validated quantitatively. Are you sure that you need a survey? If so, for what purpose? Maybe a quick corridor test in the office would be enough. A survey may be a useful tool in these cases:
 You need to validate your hypothesis on a huge population to make a decision about a particular solution, product feature or experiment.
You want to gather information about a large group of users (e.g. more than 10), and it’s faster and cheaper to set up a survey than to conduct dozens of interviews.
You need to collect data quickly.
You have the resources to analyze the results (divide the data into segments, consider insights from open-ended questions, etc.).
Step 2. Prepare a list of powerful questions
Before doing this, you have to figure out which hypotheses you want to validate and develop questions that correspond to them. Every survey question should provide you with an answer to check a certain hypothesis. Here are some other general rules for preparing a list of questions:
Try to avoid leading questions, as they may give you deceptive answers.
Don’t overuse open-ended questions, as they require more cognitive effort from the user. Open-ended questions can lead to more insightful answers, though, especially if you’re surveying engaged users.
Give users an “other” option where appropriate . It will help avoid gaps and provide you with more insightful results.
Use appropriate question types. Matrix, rating and group questions might be convenient sometimes, but be careful not to overuse them.
Try to limit the number of questions to 10–12 so that the overall response rate is higher.
I highly recommend the book The Mom Test by Rob Fitzpatrick, where you can learn more about how to ask the right questions and other customer development practices. Engaged users usually actively respond to open-ended questions. Here are some open-ended questions about working with information that gave me insightful responses (feel free to use them in your surveys!):
What prevents you from working with the information efficiently in our product?
Please name at least one problem you consistently encounter when working with the information for the project.
If you have any feedback and suggestions about our product, please share it!
Step 3. Choose the right tool for you
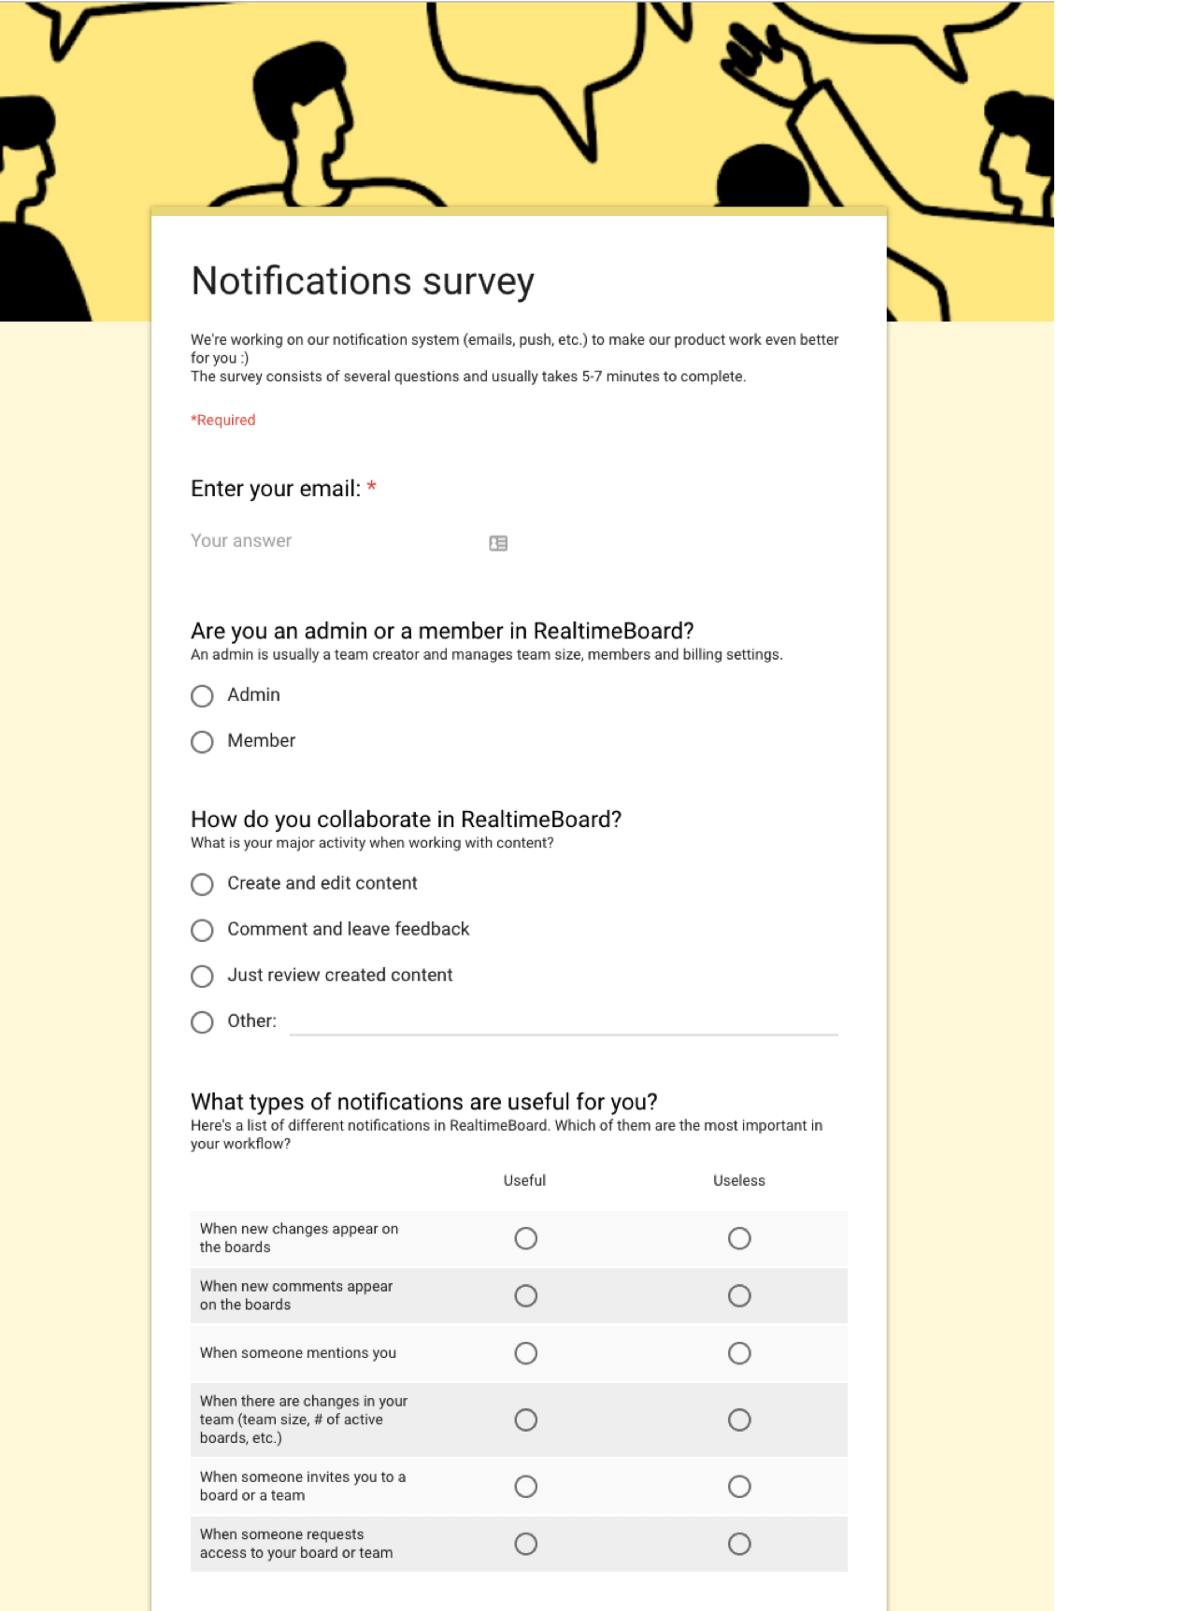
Typeform and Google Forms are popular survey tools. The former can make your survey look very fresh; the latter is a bit more old fashioned. But nevertheless, Google Forms has a compact look and feel using matrix questions. Typeform uses group questions, which can make the survey look longer. Sometimes the compact view and visual consistency are more important than a fancy UI, and this may be a reason to choose Google Forms. Let’s compare how the same survey looks in different tools.
Why Typeform?
Pros ?
Cool UI/UX
Nice adaptivity and mobile version
Lots of templates and room for customization
Logical transitions between all questions
Simple and beautiful dashboard with results
Cons ?
No matrix questions
Why Google Forms?
Pros ?
Familiar UX
Matrix questions
Logical flows and customization
Dashboard with results
Cons ?
Logical transitions only between section
UI isn’t as smooth, not enough customization
Bad adaptivity on mobile devices

Step 4. Create a survey
Now that you’re familiar with the tools, all you need to do is complete the survey template using the appropriate question types. Here are some simple steps you can follow:
1. Invite the respondents
Don’t forget to outline the main topic, goal and approximate time needed to complete your survey. Here’s a template that you can use to invite people:
Hey [Name],
Thanks for choosing [product name]! We’re working on [the topic and goal of research]. It would be great if you could complete a quick survey. It will take you [average time] minutes. We will use your feedback to improve our product and make it more useful for you. Thanks for your help!
Cheers, [your name and role in the company]
Be creative and use a call to action in the subject line in order to increase the open rate of your emails. Don’t be shy about using emoji and evocative titles to trigger a response. Here are some examples:
Let’s improve your experience in [product name] together ?
[Product name] needs your help ?
[Product name] loves you and needs a little attention ?
2. Start with the segmentation questions
If you need to segment the answers by user role, activity or other characteristics, include a couple of multiple choice questions.
3. Develop the main questions
It depends on your research, but in general, don’t use too many questions – 6 to 8 is usually enough. Try to make them logically connected and use transitions according to segmentation rules when necessary. If your respondents are engaged enough, don’t be afraid to ask them open-ended questions about the product.
4. Leave room for feedback
Don’t forget to reserve the last question for feedback, which can provide you with useful insights. It’s also a nice place to invite the users for an interview, asking them “Are you open to conducting a 30-minute follow-up interview?”
When your survey is ready, look through it one more time to make sure it’s not over complicated and that all the essential questions are correct and correspond to the hypotheses.
Looking for a tool to present your research findings in a visual way?
Try Miro free
Step 5. Analyze the results
If you’ve ever launched a survey, you know that another huge part of your work begins when you get the responses. It’s very exciting; you can’t stop reading the answers and clustering them to figure out the insights. If your questions have multiple choices, sophisticated diagrams can be generated automatically in different survey tools. But sometimes it’s better to dig deeper and match collected data with useful properties. It all depends on the topic and the goal of your survey, but if we’re talking about SaaS products like Miro, the general properties may look like this:
Subscription type (free or paid)
Account size
User type (new or engaged)
User activity (type of actions, type of created content, etc.)
As for the open-ended questions, these are even more exciting to analyze. Take a cup of tea, sit back and relax by clustering all the responses into large groups. It’s better to create large categories while dividing the responses into different groups from the start. Miro can help you create a map with sticky notes and color coding for specific categories.
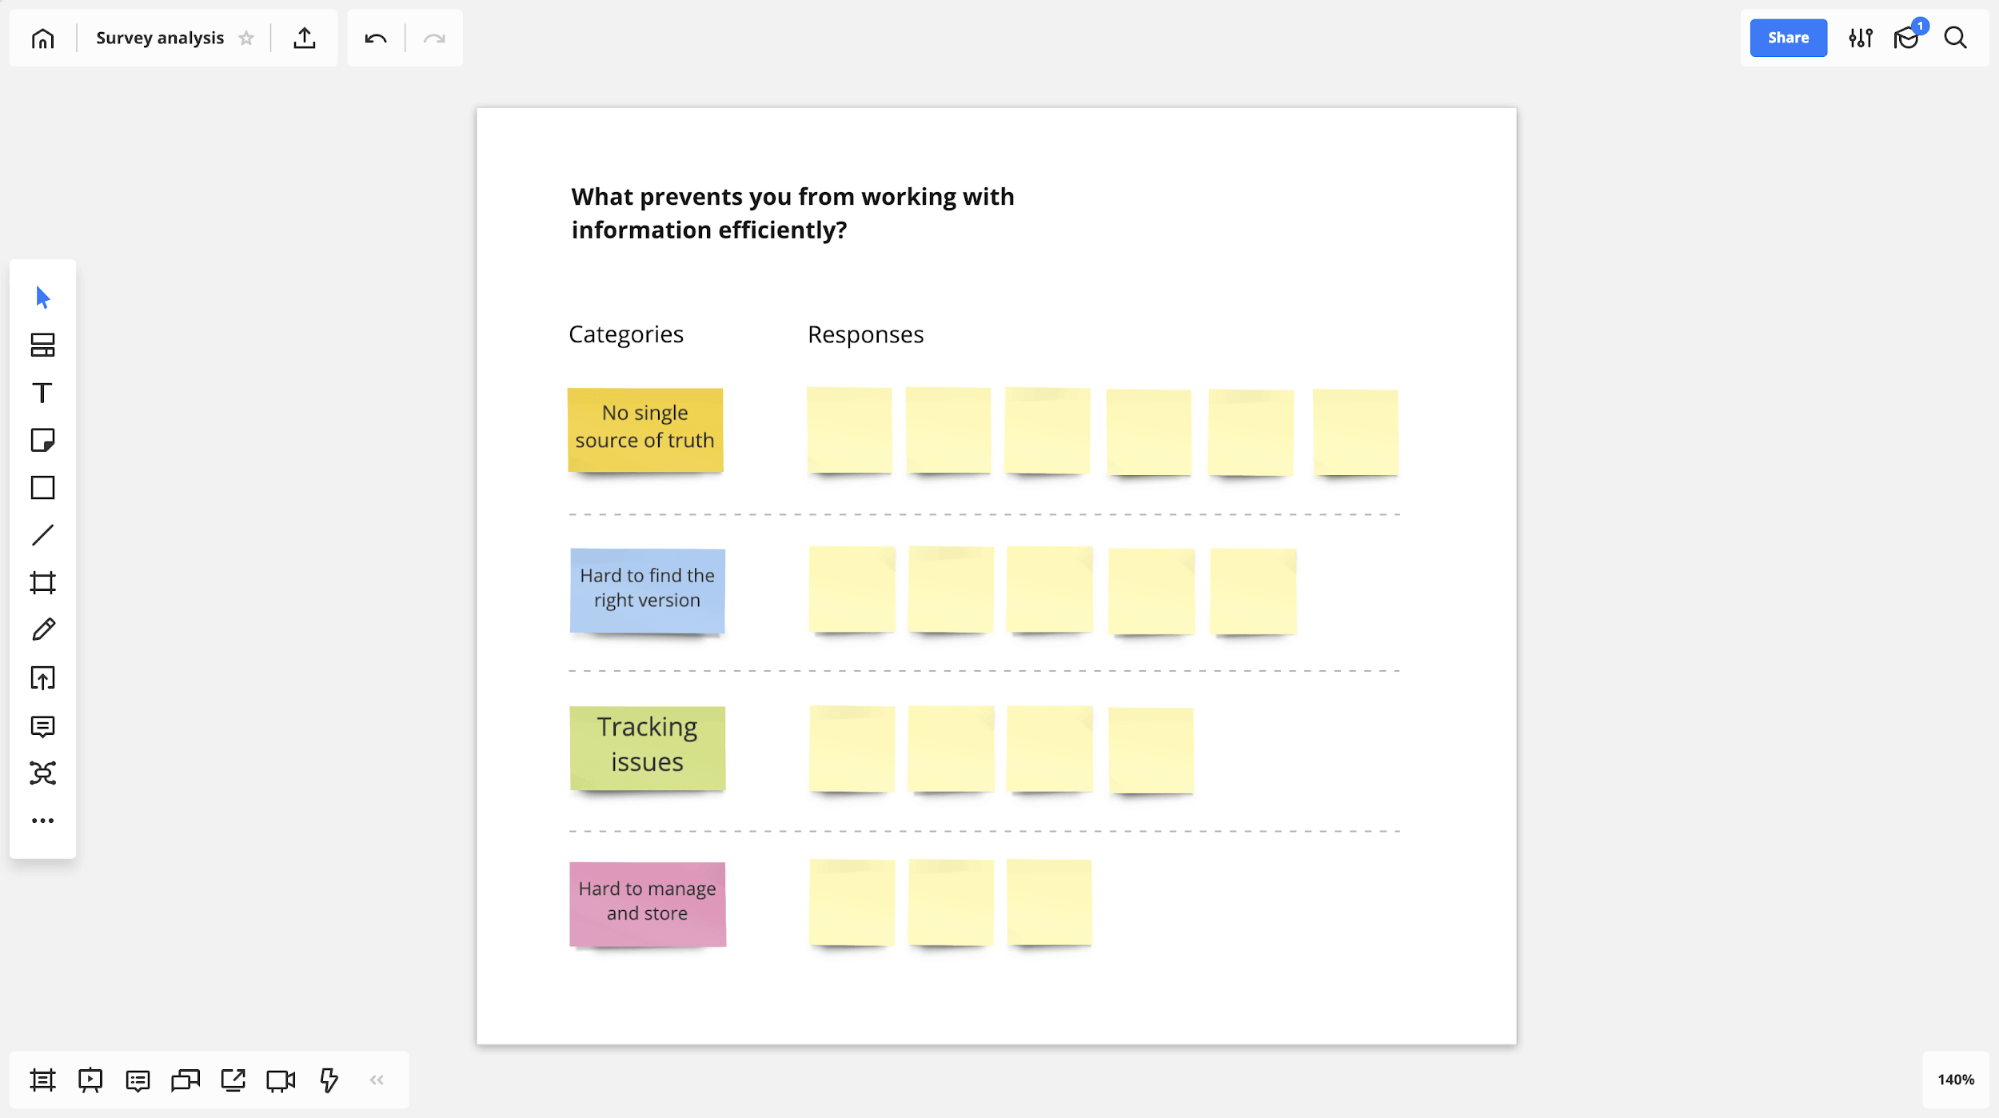
During this process, you can highlight the most insightful responses and then conduct in-depth interviews. All in all, match collected data with relevant properties and be curious – you’ll be surprised by the insights you discover.
Eventually you will find the keys to all the locks and can start designing data-informed solutions. If you still have unanswered questions, analyze the data and conduct in-depth interviews. Dig deeper and you’ll find the answers!