
Are you looking to upgrade or launch a new software system?
If the answer is yes, a context diagram could be exactly what you need.
Whether you’re improving your current booking system or creating a new eCommerce website, you need to know how the external elements (for example, your customers) will interact with your software.
If you don’t, you risk launching new software that’s not fit for purpose.
But this is where a context diagram helps.
In this article, we’ll take you through the ins and outs of context diagrams. We’ll look at the pros and cons of using them, when it’s best to use them, and how to create your own.
What are context diagrams?
A context diagram outlines how external entities interact with an internal software system.
It’s primarily used to help businesses wrap their heads around the scope of a system. As a result, they can figure out how best to design a new system and its requirements or how to improve an existing system.
Context diagrams are high-level diagrams, meaning they don’t go into the detailed ins and outs of the system. Instead, they map out an entire system in a way that’s simple, clear, and easy to understand.
For example, arrows are used to represent the flow of data between the system and each external element.
Whether you’re a seasoned developer or a complete technophobe, everyone can understand how the system works.
Use case for a context diagram: A hotel reservation system
Let’s use an example of a context diagram to demonstrate how it works.
Imagine you’re a hotel manager. You want to upgrade your online hotel reservation system to provide a better experience for customers. To do this, you use a context diagram.
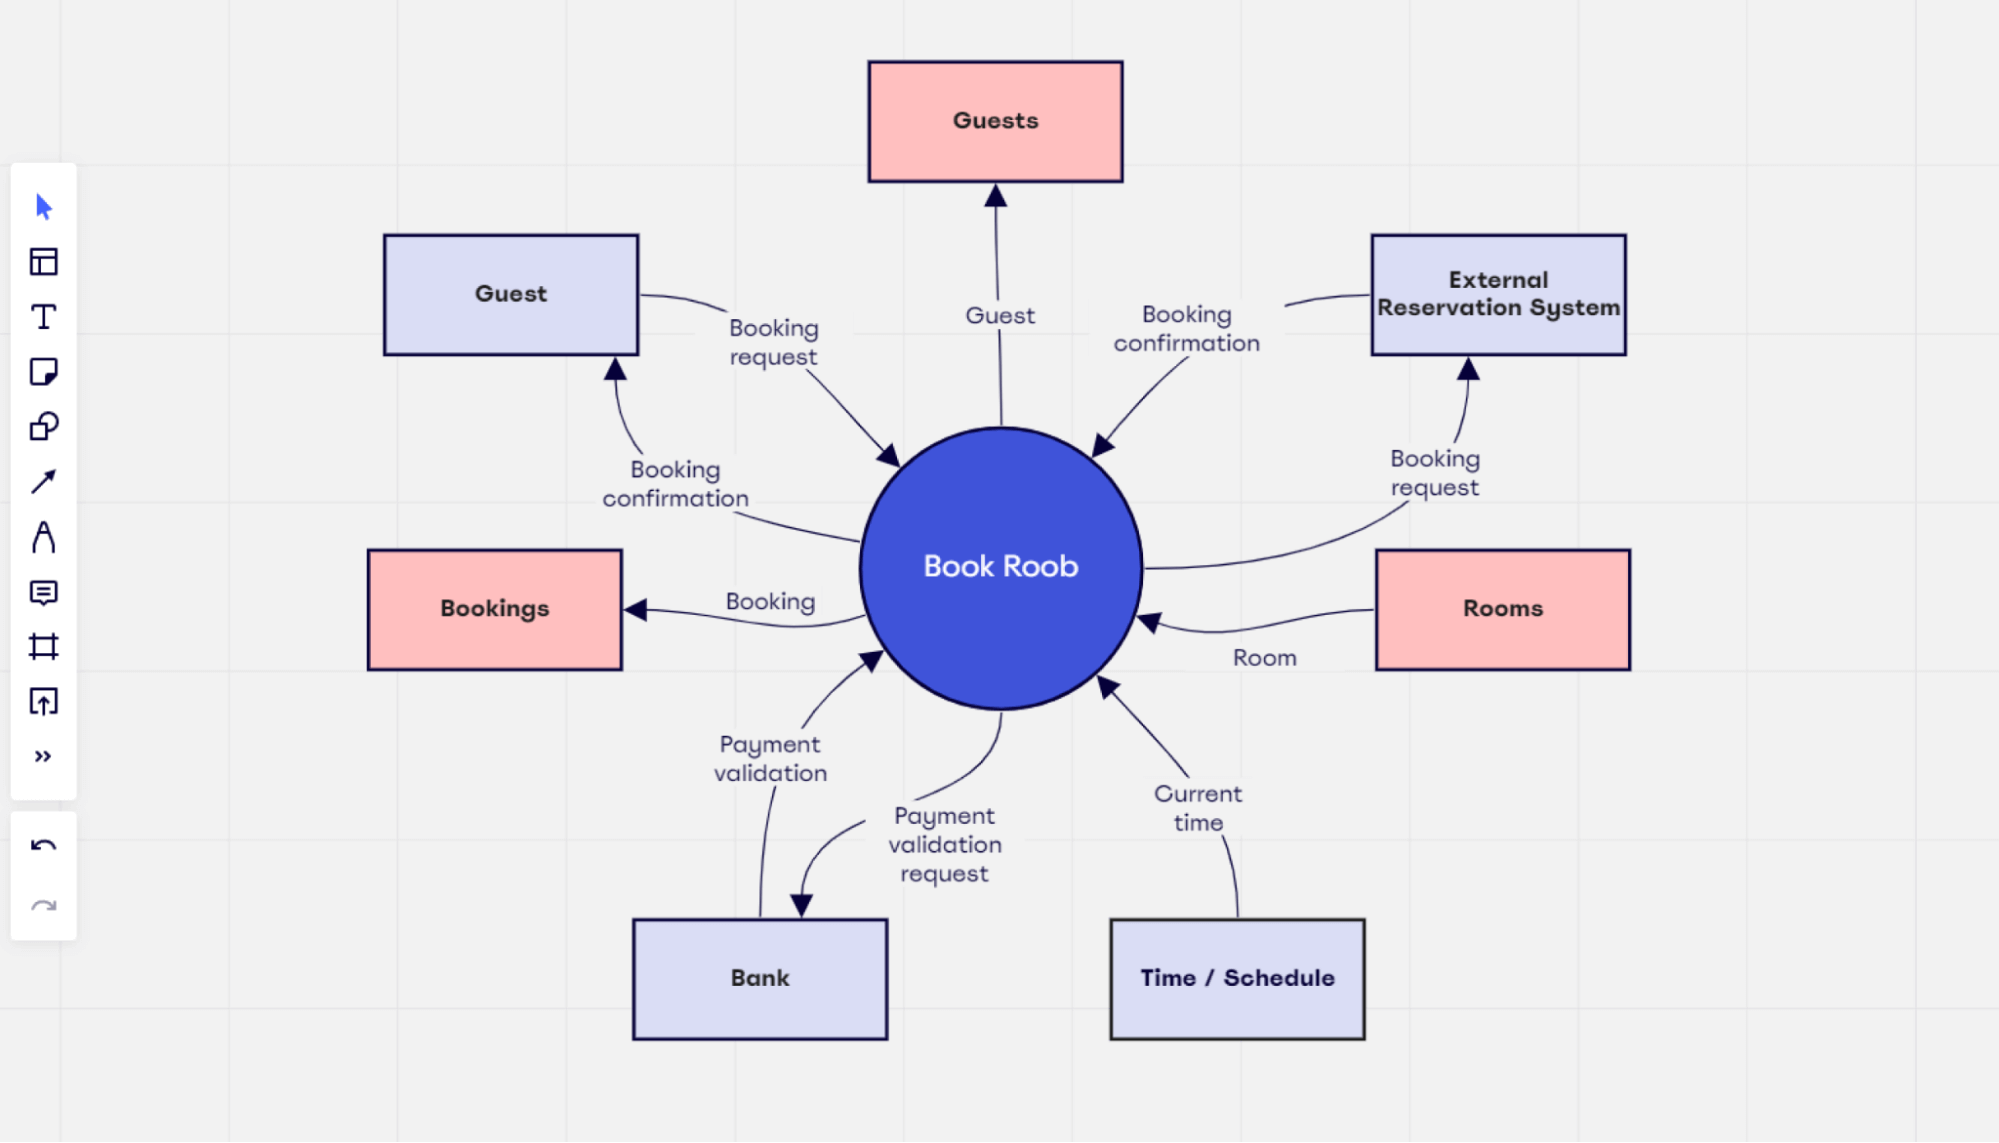
Using the context diagram, you can see all the elements that need to be included in the system and how they interact. With this information, you can make informed decisions about how to structure the entire software to better serve your customers.
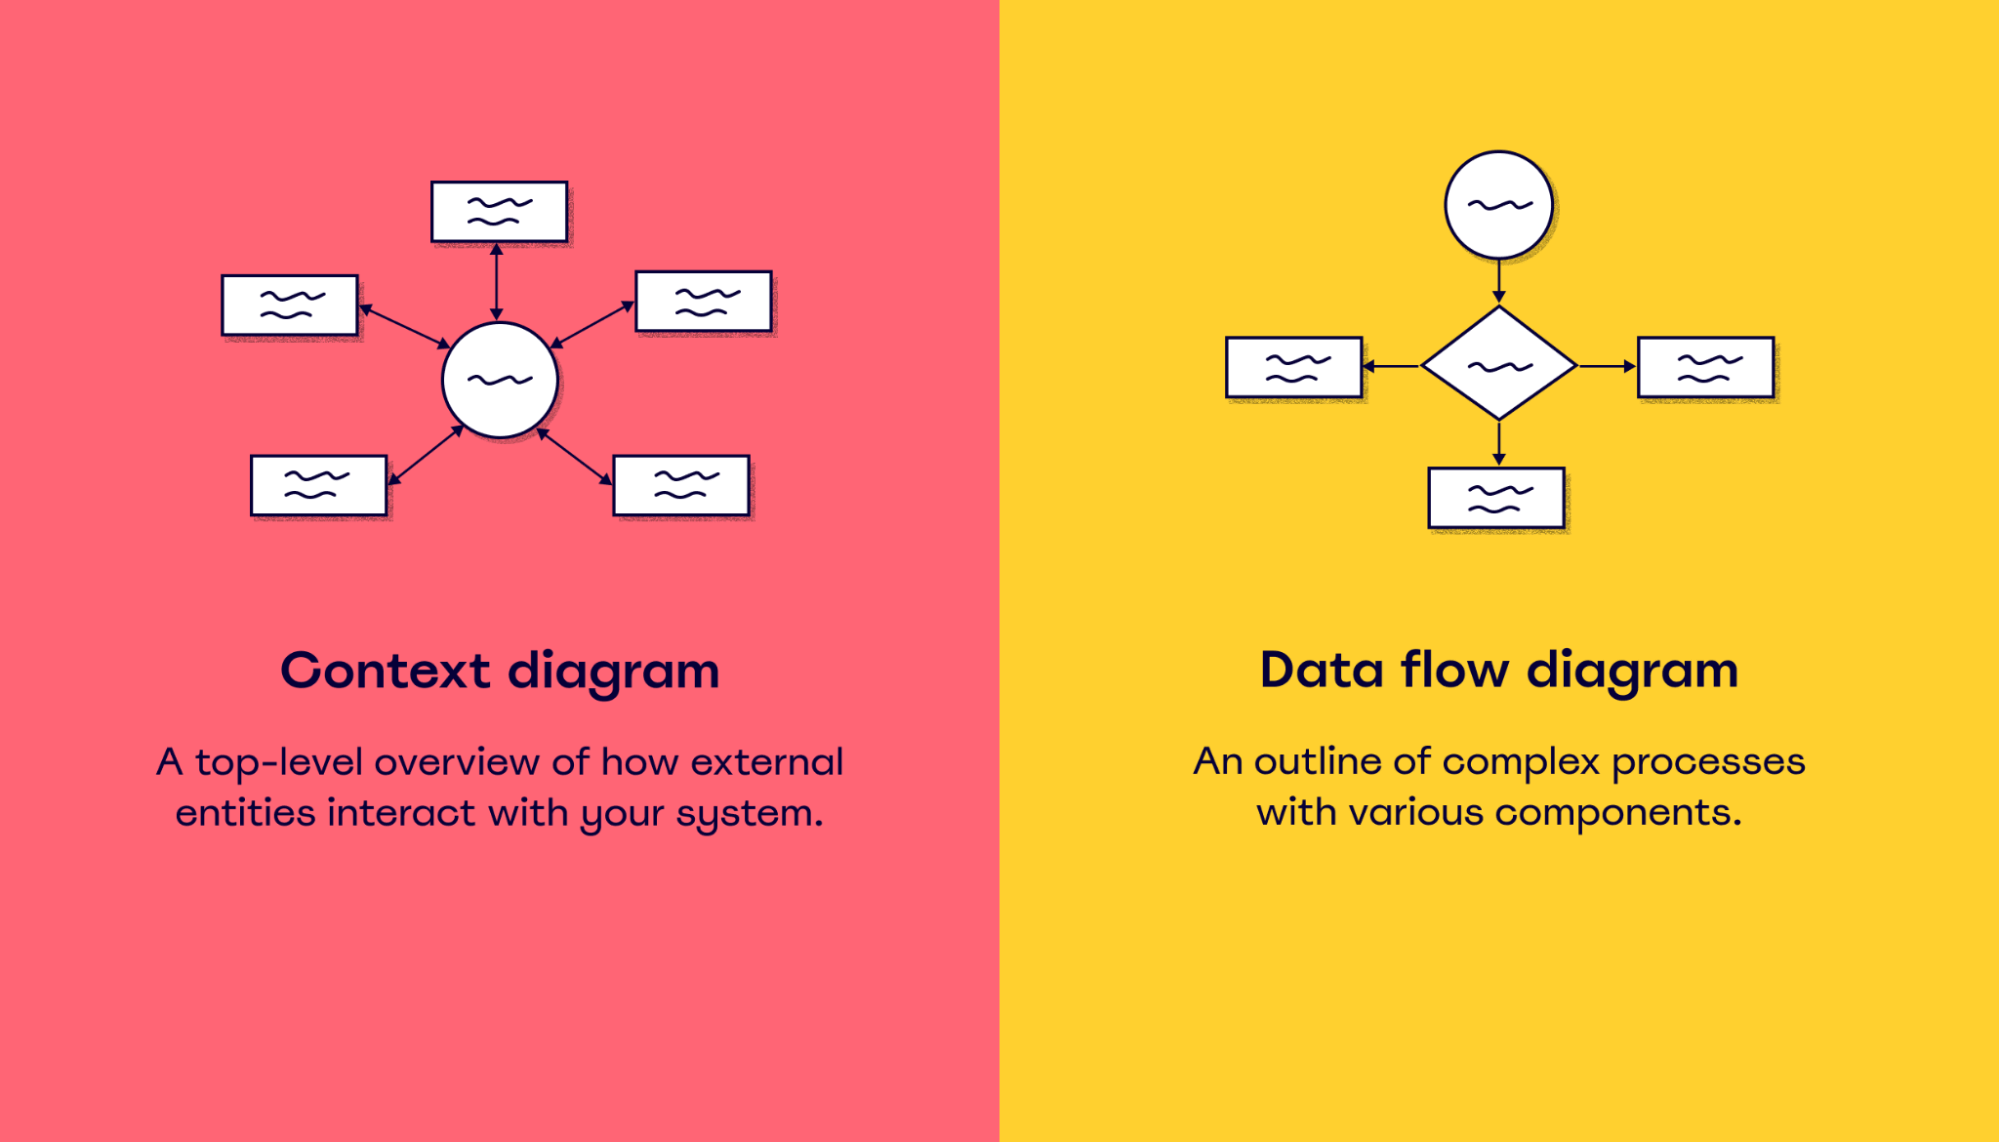
Context diagrams vs. data flow diagrams
Context diagrams and data flow diagrams are often used interchangeably, but they aren’t the same. There are key differences between using the two.
Context diagrams focus on how external entities interact with your system. It’s the most basic form of a data flow diagram, providing a broad view of the system and external entities in an easily digestible way. Because of its simplicity, it’s sometimes called a level 0 data flow diagram.
Data flow diagrams contain additional information about a system that a context diagram doesn’t.
They focus on how your system works (the inputs, outputs, and processes) to offer more detail and depth. With the help of a data flow diagram tool teams can visualize the four main components of a system: the entities, processes, data stores, and data flows.
Although these diagrams are used for different purposes, they both have the same outcome. They help businesses better understand their systems, processes, and data flows.
What are the benefits of using a context diagram?
Now that we know what a context diagram is and how it differs from a data flow diagram, let’s look at some of its benefits.
Easy to understand
Because a context diagram is a top-level overview, it’s easy for everyone to follow and understand. You don’t need technical knowledge or expertise to know what it means.
This is also helpful when it comes to sharing this information with external parties. For example, if you need to get input and feedback from stakeholders outside the business. You don’t have to worry about explaining everything in detail because the diagram itself is self-explanatory.
Depending on the software you use, creating a context diagram is also a pretty straightforward process.
Take Miro, for example. With our collaborative whiteboard, you can add lines, shapes, and text to create a context diagram that perfectly outlines your system.
We even have a ready-made context diagram template so you can jump straight in and get to work.
Reduces risks
Context diagrams allow you to plan how your system interacts with external entities before going live. This gives you the chance to identify potential issues before they happen and put preventative measures in place.
As a result, you mitigate risks and reduce the likelihood of problems after launch.
Let’s use an ATM system as an example.
You create a context diagram to outline how your banking ATM process will work. The diagram shows all the external units that interact with the ATM system and how data flows between them.
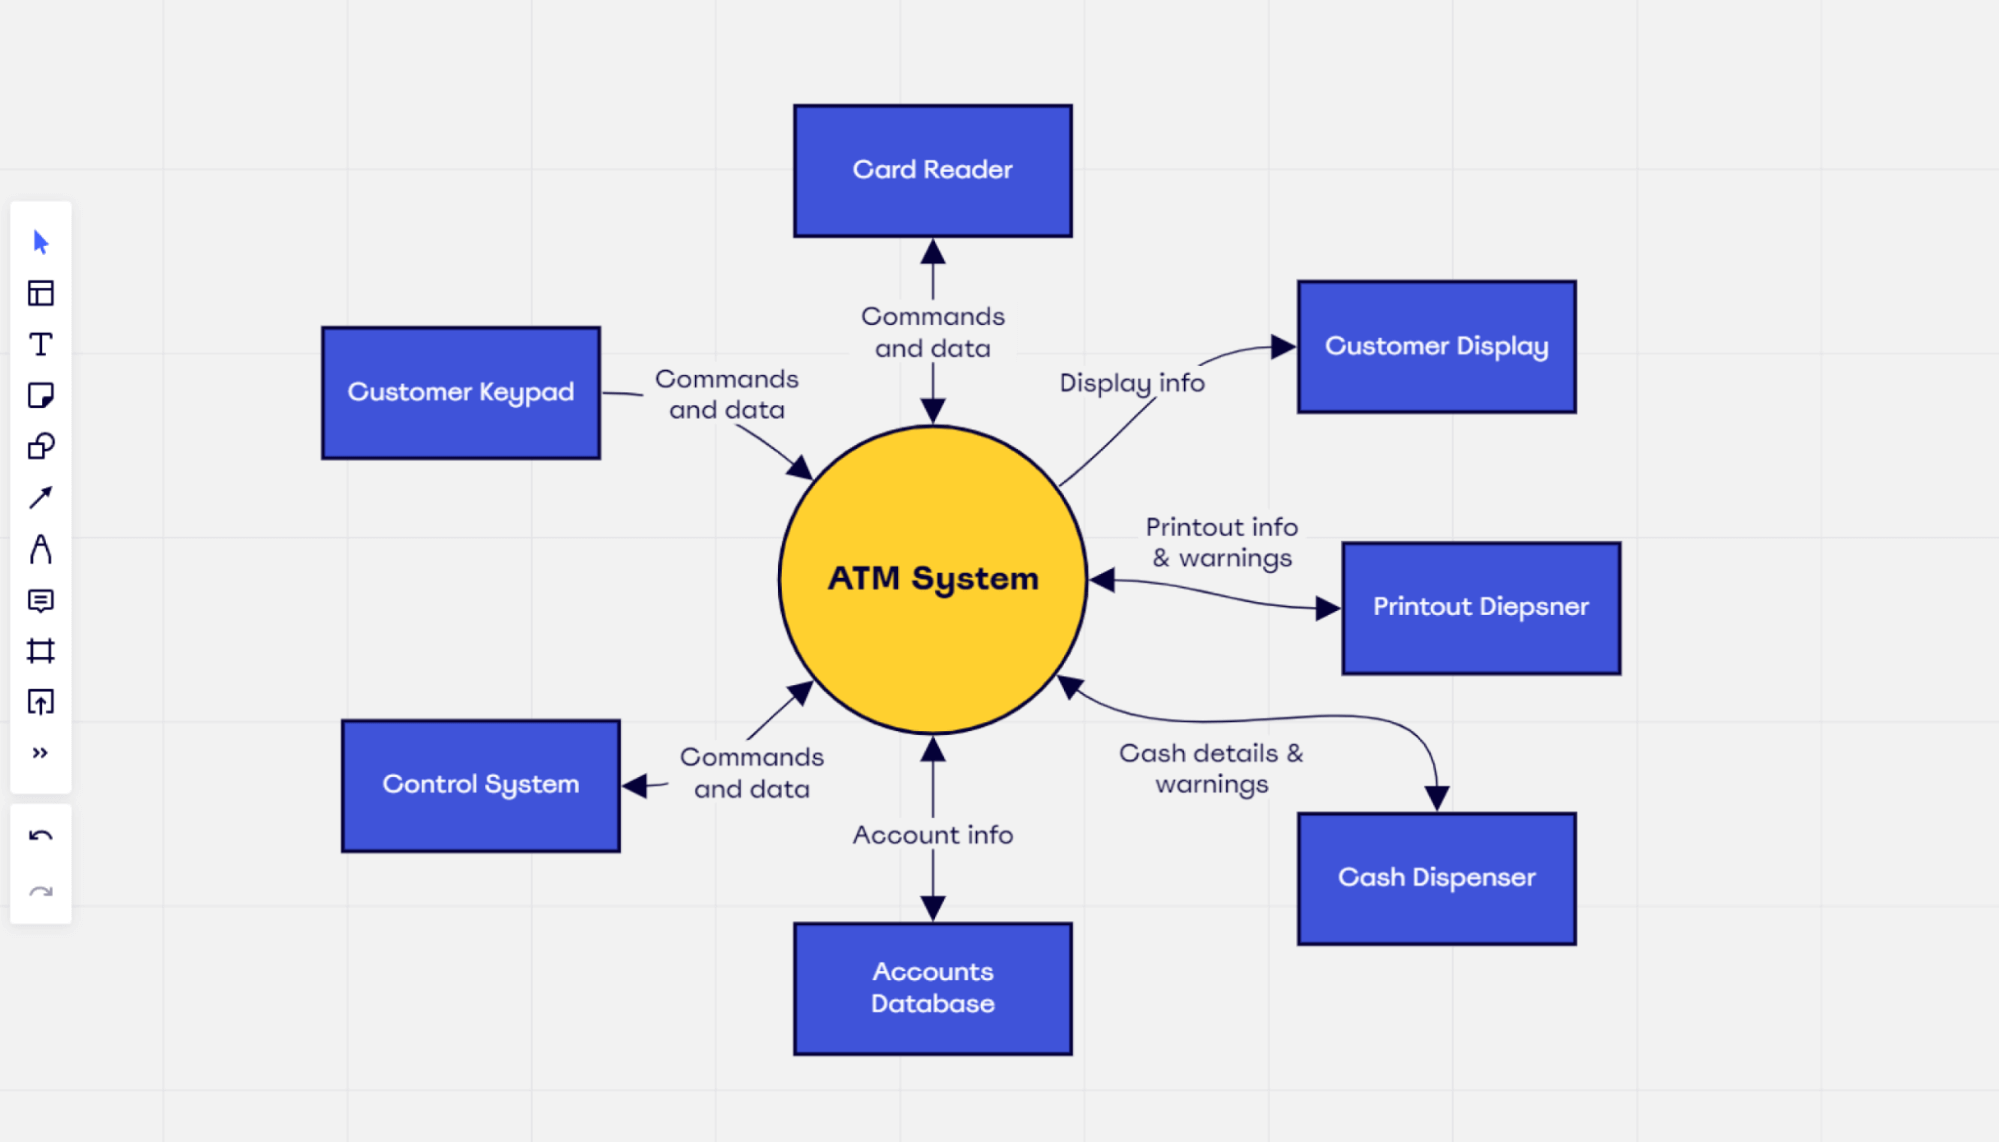
By doing this, you can see the single process as a whole and identify any potential issues with the system. And because the diagram is so flexible, you can easily make changes.
Enables collaboration
Having a context diagram in place makes it easier for your team to collaborate.
Think about it. You can share the diagram with anyone you want. From colleagues to management and even key project stakeholders, everyone can be involved in the process.
You can take everyone’s feedback into account and make the necessary changes to accommodate their perspectives. And if you’re using a collaborative platform, you can easily share your diagram virtually and collaborate on the same diagram in real-time.
By collaborating throughout the process, you’re far more likely to achieve the best software structure possible. Everyone has different ideas and perspectives to bring to the table, giving you a wide variety of perspectives to take into account.
Are there any downsides?
Although there are definite upsides to using a context diagram, there are some drawbacks to be aware of.
Lack of depth and detail
If you’re looking for a detailed diagram, a context diagram isn’t the right choice.
Let’s use the ATM example again. In your ATM context diagram, you can see that the control system connects to your ATM. But how exactly does the control system work with your ATM? And what’s involved in the control system itself?
You won’t get these answers from a context diagram.
A control system is one of the key infrastructures in your banking network, so it’s pretty complex. To fully understand the ins and outs of this system, you’ll need a more in-depth diagram, like a data flow diagram.
So although a context diagram helps visualize the top-level structure of your systems, it sometimes lacks the depth and detail you need to fully understand how everything works together.
Time-consuming
Creating the actual diagram itself can be a time-consuming process, especially if you’re using a platform like Word or Excel.
Although you can create context diagrams in these programs, they’re not quite as intuitive as some online platforms. Not only does this make the process longer, but it also makes it harder for you to collaborate with your team.
Speaking of collaboration, this process can also be quite laborious, particularly if you have a lot of people working on the diagram. You’ll need to review all their feedback and make the required changes, meaning it can sometimes take a while to get to the final diagram.
If you want to save time and streamline the diagram creation process, consider using an intuitive platform like Miro that has a ready-made template.
When should you use a context diagram?
A context diagram is helpful in a variety of situations. Here are some of the common scenarios:
- Implementing or updating software: A context diagram helps you figure out how new systems will work or how to improve existing systems.
- Reviewing a business process: During the discovery phase of an upcoming project, a context diagram can outline how the business system relates to other systems. This makes sure that your systems and processes align with business requirements.
- Tackling resource management: Teams can use the context diagram to better understand how their budget should be spent and what resources are needed in different areas of the business. This is particularly helpful when it comes to identifying a project scope.
These are just a few key examples of when to use a context diagram.
Ultimately, you can use this diagram whenever you want to visualize how your system relates to external units — whether that’s to review your software or business processes.
How to create a context diagram
At this stage, you’ve got a solid understanding of what a context diagram is and when to use it. Now, let’s take a look at the steps required to create a successful context diagram.
1. Understand your system
Before you create the diagram, you need to fully understand what you want your system to be. Understanding how it currently works will help you identify areas of improvement throughout the rest of the process.
So if you’re looking to upgrade an existing system, review how it works. Use this time to visualize how you plan to create the software, how it’ll interact with external systems, and get input from relevant parties.
Think about your goals and what you want the system to be. This will be what’s placed in the center of the diagram in the next stage.
If you’re creating the context diagram for a new system, use this opportunity to figure out what you want from this system. This will help keep the entire process on track and aligned with the end goal.
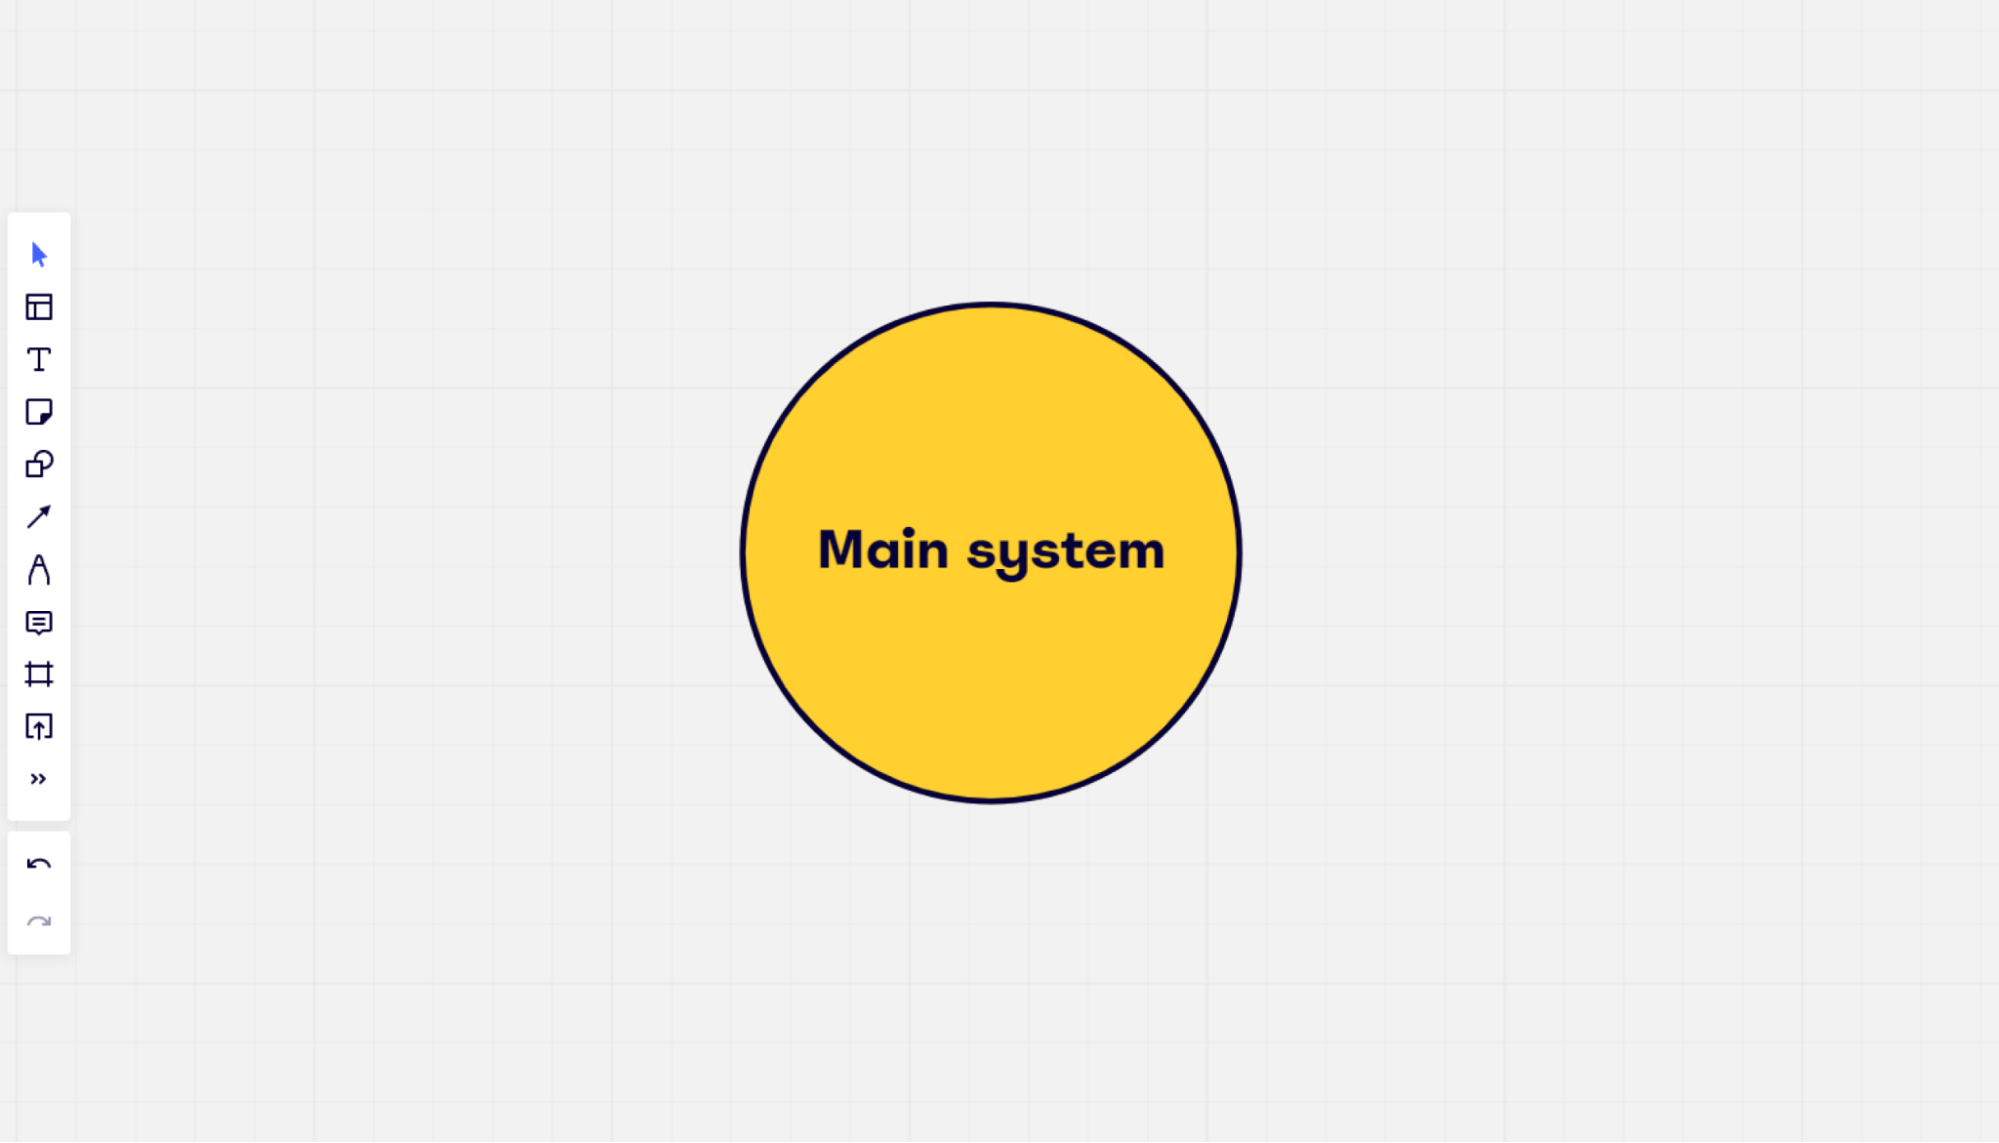
2. Add your system to the diagram
Once you’ve got a firm handle on what the system should be, you can add it to your context diagram.
So how exactly do you put your system into a context diagram?
It depends on the structure you want to use. Most context diagrams will have the main system in the center circle, which is the focal point of the diagram. All the external elements interact with this circle.
Although this is the way most context diagrams are structured, it doesn’t mean you have to do it the same way. For example, you might prefer the system to sit at the top of the diagram and feed downwards to the external elements.
Create your diagram in a way that best illustrates your system.
3. Add your external entities
Now that the system is in place, you can start to add the external elements.
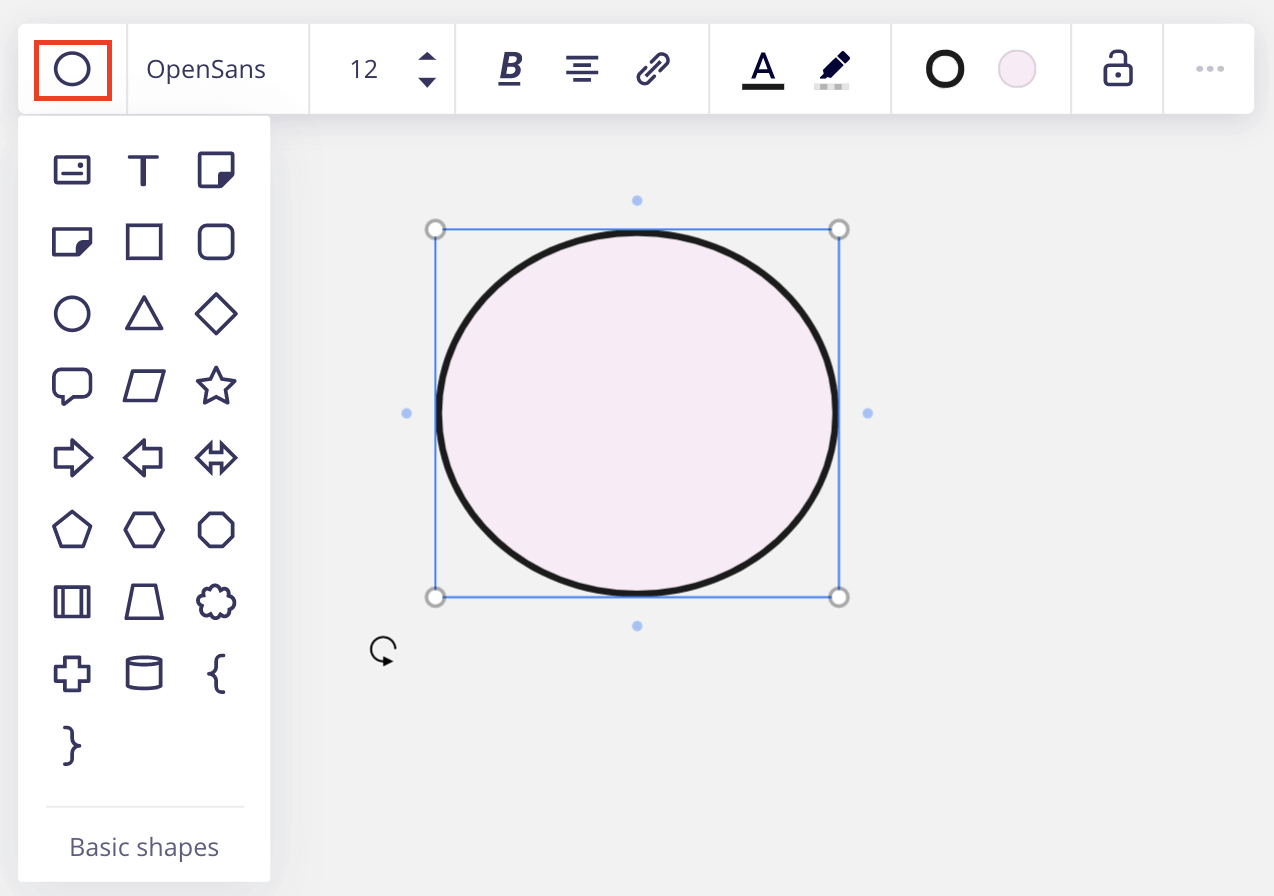
Using squares, rectangles, or any other shapes you want, you can list external entities that interact with the system.
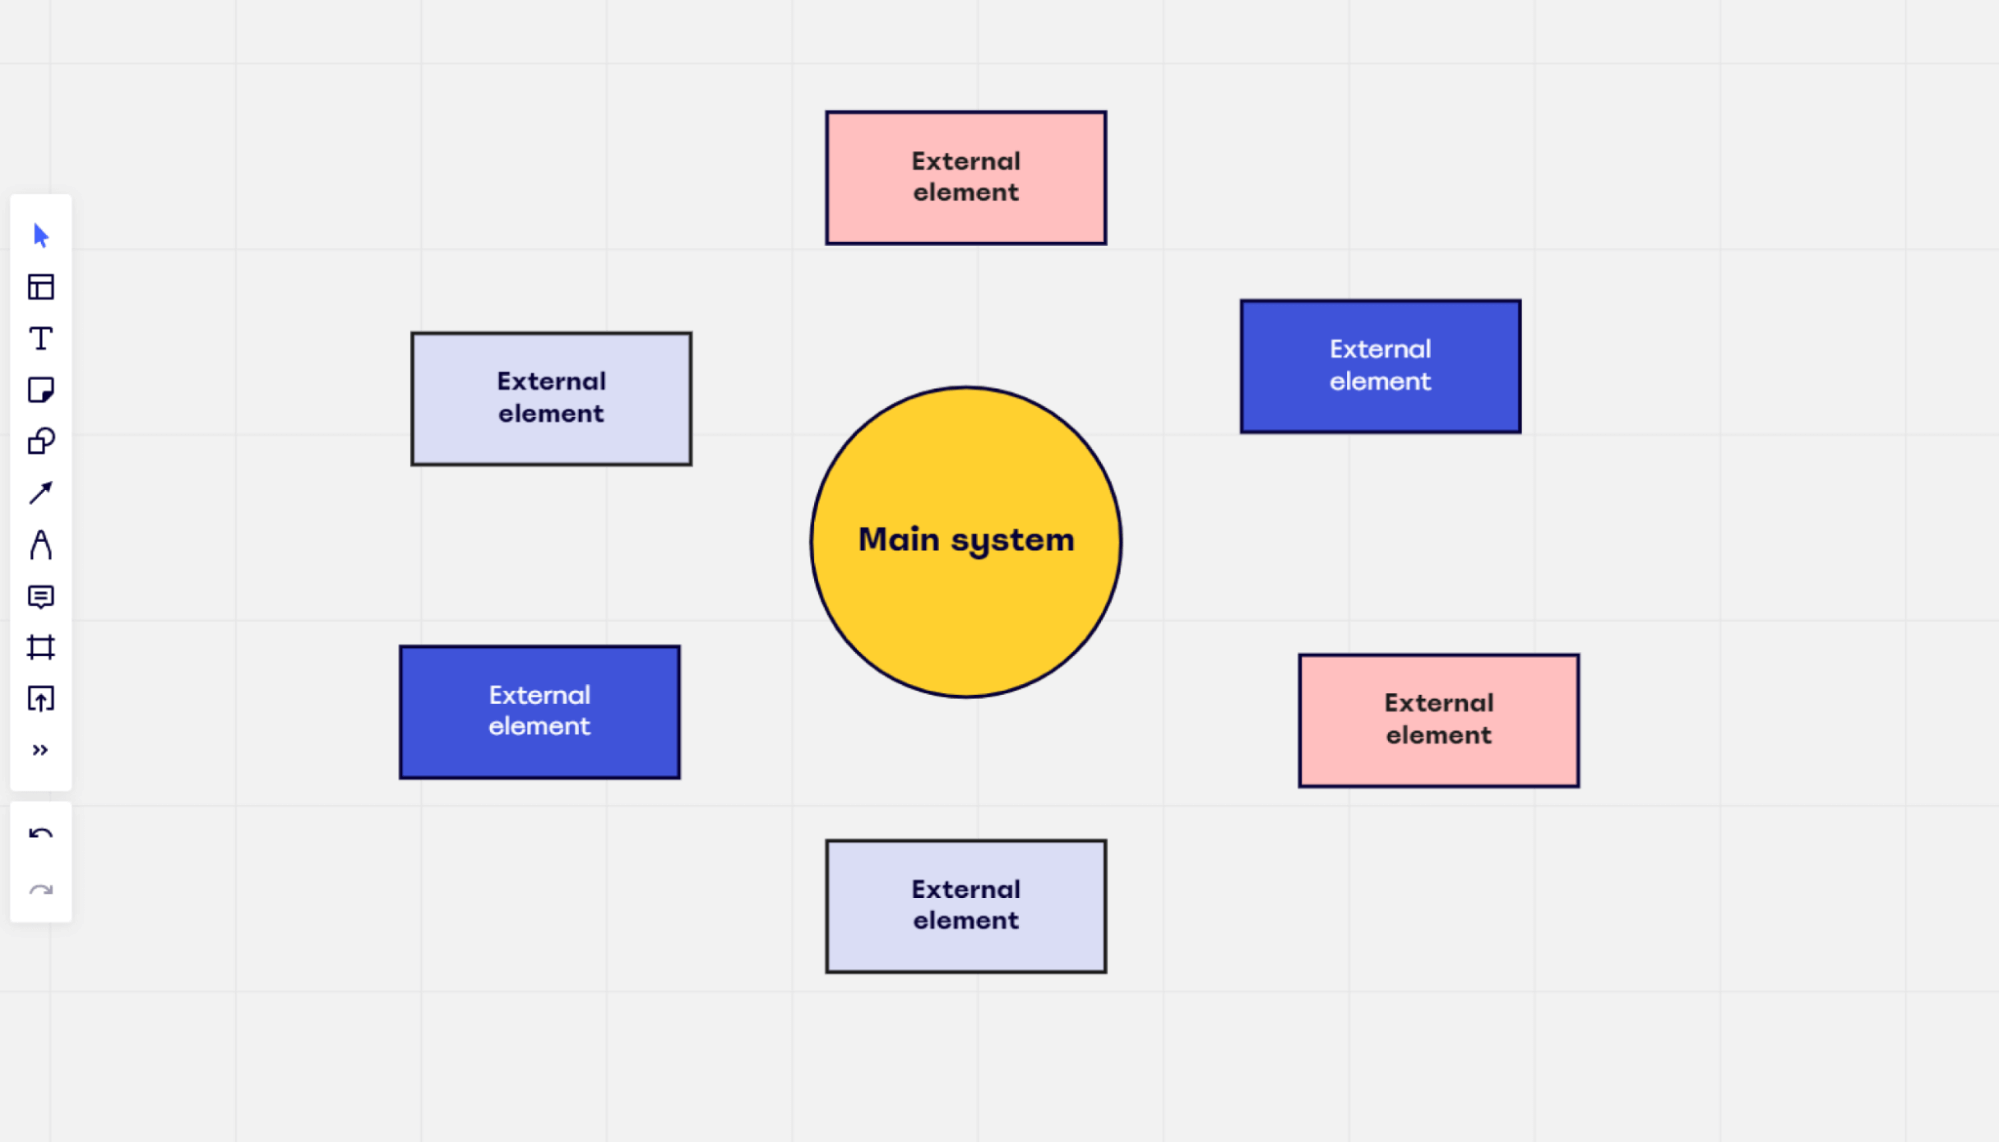
They’ll be placed around the center, ready for you to add arrows in the next step.
4. Use arrows to outline the data flow
With all the elements on the diagram, it’s time to add arrows to create the direction of the data flow. This will show how the external elements interact with the system.
You’ll also have labels alongside the arrows to show the relationship between the two entities.
Remember that data can flow both ways in the diagram. Using a double-ended arrow illustrates this.
5. Share the finished diagram
When the diagram is done, it’s time to share it with the relevant parties to get feedback. Here are some of the people you might want to share it with:

- Team members: If there are team members that will be directly affected by changes to an existing system, or the implementation of a new system, they should have their say in how it performs. After all, they’re the ones that are likely to use it regularly.
- Management staff: Most of the time, you’ll need big changes like this to be signed off and approved by high-level management.
- Key stakeholders and shareholders: If you’re making big changes to company processes that can impact the financial success and performance of the business, chances are there will be some stakeholders and shareholders that will need to sign it off.
6. Make any necessary changes
When you’ve got all the feedback you need, make the necessary changes to the diagram.
You’ll probably need more than one round of feedback, especially if you’re getting input from various people across the business. Again, this is where using a collaborative platform can be helpful.
If you have a lot of back-and-forth conversations via email, for example, you might lose track of all the feedback. It’ll also be hard to keep on top of which version of the diagram is the most up-to-date.
Unlike sharing your diagram as a document via email, a tool like Miro is based online. This means that all the edits and suggestions will be uploaded to the diagram in real time. You won’t miss any key information, and you can be sure that the version you’re looking at is the most up-to-date.
You can even have a group discussion with a video chat while reviewing the diagram.
Simply put, using a collaborative tool will help you manage the review process as efficiently as possible.
Create a context diagram today
By now, you’ve got a pretty good handle on what a context diagram is. You understand the benefits of using it, the downsides, and how to create a context diagram of your own.
Now, it’s time to put your newfound knowledge into action. We’d suggest starting with Miro.
Our intuitive and collaborative online whiteboard makes it easy for you to create a context diagram. We even have a context diagram template that’s ready to go. And you can customize it with different elements, shapes, and arrows to create the perfect diagram.
All you have to do is sign up for free, choose the template, and you’re ready to go.
Curious to see what other apps Miro integrates with?