
Article summary
App rationalization metrics that resonate with executives focus on business impact, not technical details. The five key metrics are: Time-to-productivity savings (with a potential 3.5 hours/week recovered per employee), risk-adjusted cost avoidance (because 53% of SaaS licenses are inactive), innovation velocity improvement (Miro users report 19% faster project completion), employee engagement impact (96% of employees are dissatisfied with current tools), and strategic agility enhancement. These value-based measurements transform IT from cost center to strategic enabler by demonstrating tangible business outcomes.
Why business impact beats technical info
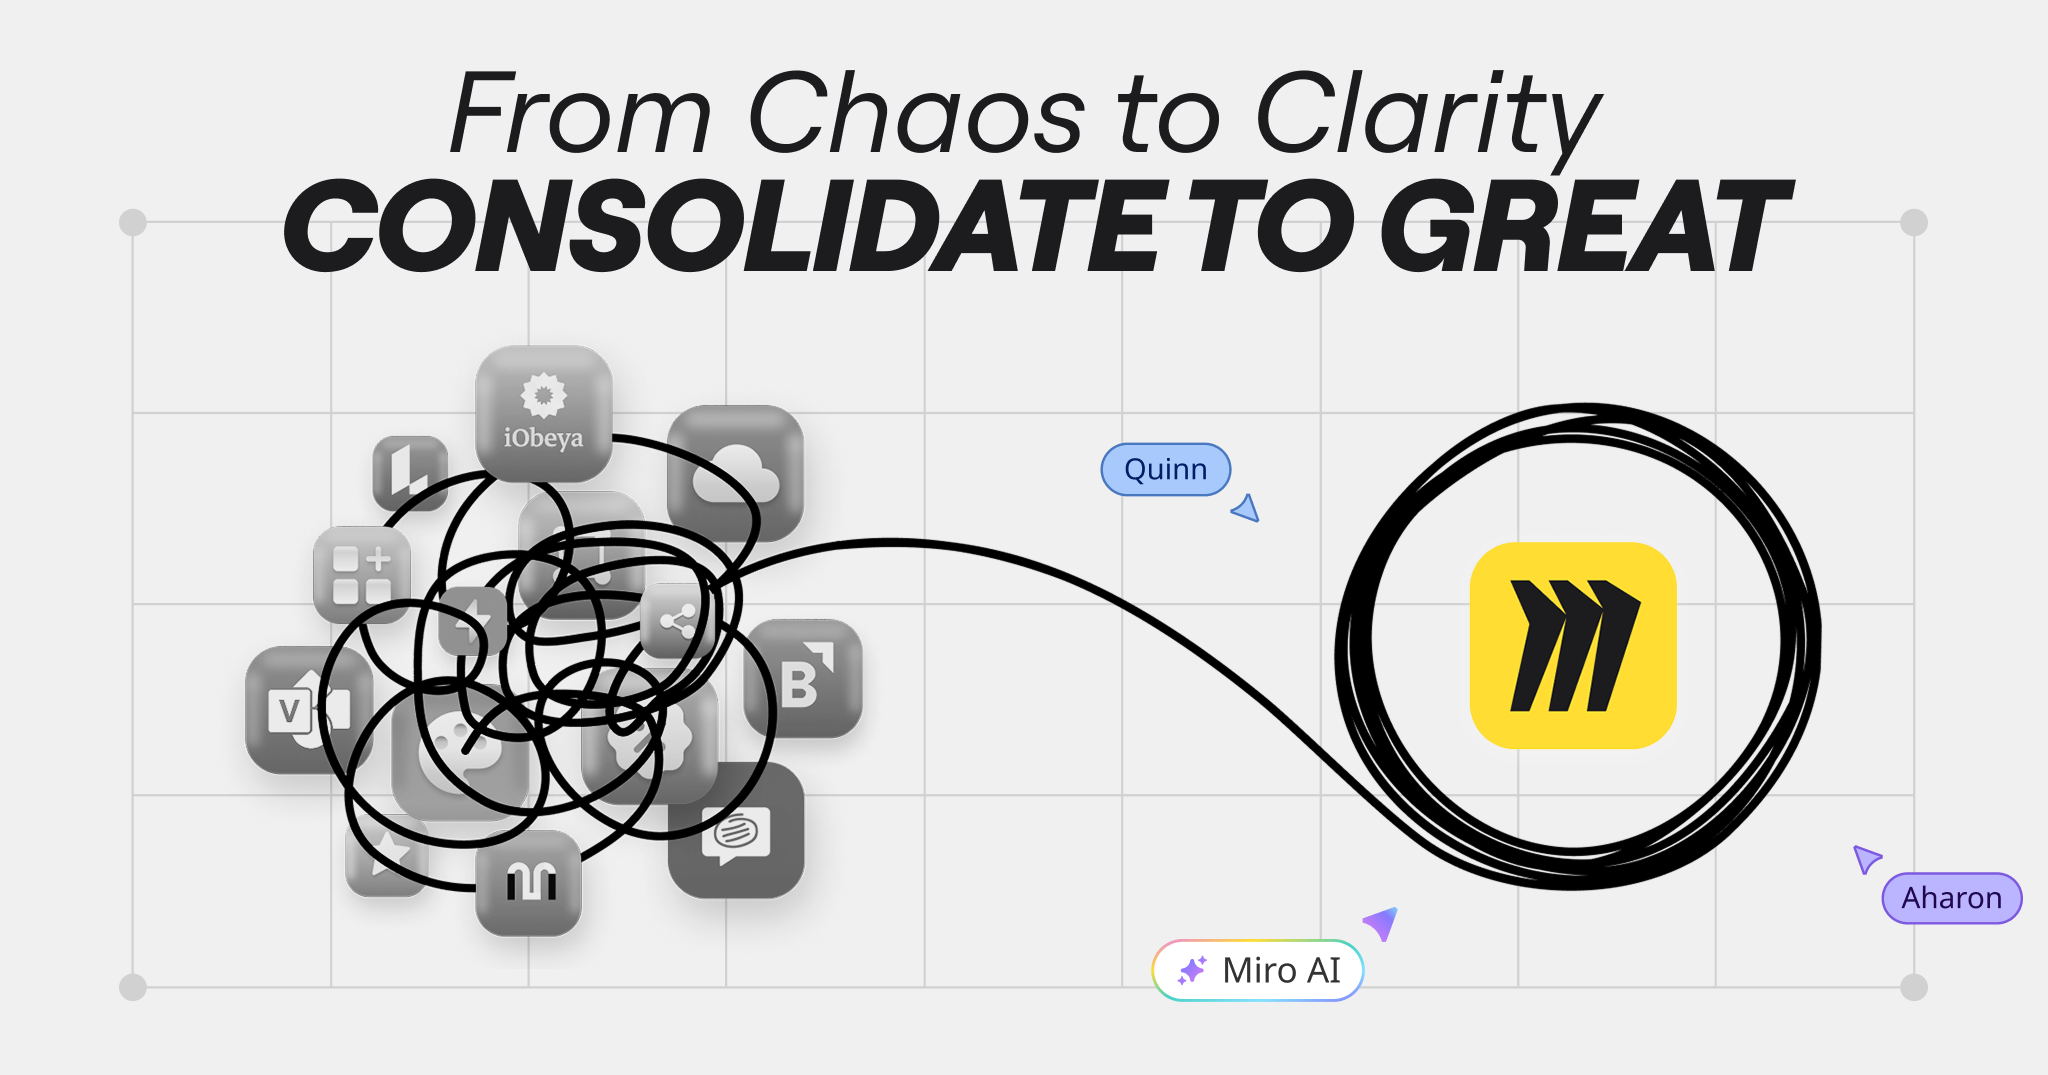
IT leaders know the pain all too well. You walk into the boardroom with a detailed technical assessment of your app portfolio, complete with utilization rates and integration complexity scores. Twenty minutes later, you’re met with blank stares and the dreaded question: “But what does this mean for the business?”
Here’s the reality: C-suite executives don’t care about your technical metrics. They care about business impact. And if you want to secure buy-in for app rationalization initiatives, you need to speak their language.
According to Forrester, 63% of IT decision makers are planning tool consolidation efforts in the next two years. But here’s what separates successful initiatives from failed ones: the ability to translate technical complexity into business value.
The metrics that move the needle
Forget utilization percentages and system performance benchmarks. The metrics that capture executive attention are the ones that directly impact the bottom line, competitive advantage, and strategic goals. Here are the five that matter most.
1. Time-to-market savings
What it measures: How much faster employees can get work done when you eliminate app switching and streamline workflows.
Why executives care: Time is money, and productivity directly impacts revenue. Harvard Business Review found that employees waste 3.5 hours every week switching between tools. That’s 164 hours per person per year—or six and a half days of lost productivity.
How to measure it: Track the time employees spend context-switching before and after rationalization. Survey teams about workflow friction points and time spent searching for information across multiple platforms.
Miro application: Use Miro’s journey mapping templates to visualize current employee workflows and identify time-wasting touchpoints. Create before-and-after workflow comparisons that show executives exactly where time savings occur.
2. Risk-adjusted cost avoidance
What it measures: The total cost of maintaining your current app sprawl, including licensing, security risks, and integration complexity.
Why executives care: It’s not just about what you’re spending—it’s about what you’re avoiding. Every additional app introduces security vulnerabilities, compliance challenges, and maintenance overhead that compounds over time.
How to measure it: Calculate direct licensing costs for redundant tools, plus the hidden costs of security monitoring, compliance auditing, and integration maintenance. According to one estimate, 53% of SaaS licenses are inactive, representing pure waste.
Miro application: Build a comprehensive cost visualization using Miro’s tables and charts. Map each app to its total cost of ownership, including hidden expenses, to create a compelling financial story.
3. Innovation velocity improvement
What it measures: How much faster teams can move from idea to execution when they have streamlined, integrated tools.
Why executives care: In today’s competitive landscape, speed of innovation determines market leadership. Teams that can collaborate effectively and iterate quickly have a significant competitive advantage.
How to measure it: Track project completion times, time-to-market for new initiatives, and cross-functional collaboration efficiency. Miro users consistently report a 19% reduction in time to project completion after consolidation.
Miro application: Create innovation pipeline dashboards that show how tool consolidation accelerates each stage of product development. Use Miro’s timeline features to demonstrate before-and-after project velocities.
4. Employee engagement and retention impact
What it measures: How tool complexity affects employee satisfaction, productivity, and turnover intentions.
Why executives care: Top talent increasingly evaluates companies based on their tech stack and ways of working. Tool frustration leads to engagement issues, which directly impact retention and hiring costs.
How to measure it: Survey employees about tool satisfaction and workflow efficiency. Recent research shows that 96% of workers are dissatisfied with their workplace tools, with app switching among the biggest complaints. There’s also a direct correlation between IT relationship quality and employee satisfaction—NPS scores jump from -3 to 53 when teams collaborate closely with IT.
Miro application: Use Miro’s survey templates and sentiment analysis to gather and visualize employee feedback. Create engagement dashboards that show the connection between tool consolidation and employee satisfaction.
5. Strategic agility enhancement
What it measures: Your organization’s ability to respond quickly to market changes and new opportunities when technology enables rather than constrains decision-making.
Why executives care: Agility is everything in today’s business environment. Companies that can pivot quickly, launch new initiatives, and adapt their operations have a fundamental competitive advantage.
How to measure it: Track decision-making speed, cross-departmental collaboration efficiency, and time required to launch new strategic initiatives. Measure how quickly teams can access the information they need to make informed decisions.
Miro application: Build strategic planning dashboards that show how consolidated tools enable faster decision-making. Use Miro’s collaboration features to demonstrate improved cross-functional alignment and strategy execution speed.
Making the business case stick
The key to presenting these metrics effectively is storytelling with data. Don’t just show numbers—show the narrative of transformation. Start with the current pain points, demonstrate the path to improvement, and paint a picture of the future state. And remember: executives don’t just want to see what you’ll save, but what you’ll enable.
When Workday’s VP of IT Infrastructure was evaluating visual collaboration tools, the decision wasn’t just about features or cost. “Miro showed up as head and shoulders above the competition in every way,” he said, because it delivered measurable business value across all these dimensions.
The bottom line
App rationalization isn’t just an IT initiative—it’s a business transformation strategy. When you measure the right metrics and present them in terms of business impact, you transform from a cost center into a strategic enabler.
Ready to build your business case? Check out our purpose-built Blueprint for expert templates that’ll help you get started.