About the Troubleshooting Flowchart Template
In technical fields, business operations, or daily problem-solving scenarios, troubleshooting is a crucial part of the process. A structured approach to identifying and resolving issues is vital to ensure efficiency and effectiveness. The troubleshooting flowchart template is an excellent tool that can help with this. It visually displays the steps involved in diagnosing and solving problems, making the troubleshooting process more streamlined and easier to understand.
A template is a pre-designed framework that helps guide you through the typical troubleshooting steps. It uses shapes, lines, and text to visually represent the process of identifying a problem, exploring potential causes, and finding solutions. This organized structure makes it easy to understand each step and its subsequent action, ensuring a comprehensive approach to problem-solving.
How to use the troubleshooting flowchart template
Select the template: Begin by selecting the troubleshooting flowchart template. This template provides a basic structure that can be customized per specific needs.
Customize with ease: Editing the template is simple and intuitive. With just a few clicks, change text, shape, and layouts to fit the unique troubleshooting process.
Expand with automated diagramming: Use automated diagramming features to add more shapes and connector lines. This feature allows for expanding the flowchart while maintaining neatness and organization.
Add context: Improve the flowchart by adding relevant documents, images, or links directly onto the Miro board. This integration provides more context and makes the troubleshooting guide more comprehensive.
Why should you use a troubleshooting flowchart template?
Clarity in process: The template visually breaks down the troubleshooting process, making it easier to understand and follow.
Efficient problem solving: It streamlines identifying and solving issues, saving time and resources.
Enhanced communication: The visual nature of the flowchart makes it an excellent tool for communicating the troubleshooting process to team members or stakeholders.
Customizable for various scenarios: The template is adaptable to fit a wide range of problems and industries.
Record-Keeping and Documentation: It is a valuable record for future reference, documenting the steps taken to fix issues.
Troubleshooting Flowchart Template FAQs
Can the template be used for non-technical troubleshooting?
The template is flexible and can be adapted for various types of troubleshooting, including business processes, project management, and everyday problem-solving.
Is it necessary to have diagramming skills to use the template?
No, Miro's flowchart tool is designed to be user-friendly, and no special diagramming skills are required. Its intuitive design and automated features make it accessible to everyone.
Can the flowchart be exported for presentations or reports?
Yes, the flowchart created using the template can be exported in various formats, making it easy to include in presentations, reports, or other documents.

Miro
The AI Innovation Workspace
Miro brings teams and AI together to plan, co-create, and build the next big thing, faster. Miro empowers 100M+ product managers, designers, engineers, and more, to flow from early discovery through final delivery on a shared, AI-first canvas. By embedding AI where teamwork happens, Miro breaks down silos, improves alignment, and accelerates innovation. With the canvas as the prompt, Miro's collaborative AI workflows keep teams in the flow of work, scale shifts in ways of working, and drive organization-wide transformation.
Categories
Similar templates

Current State vs. Future State Flowchart Template
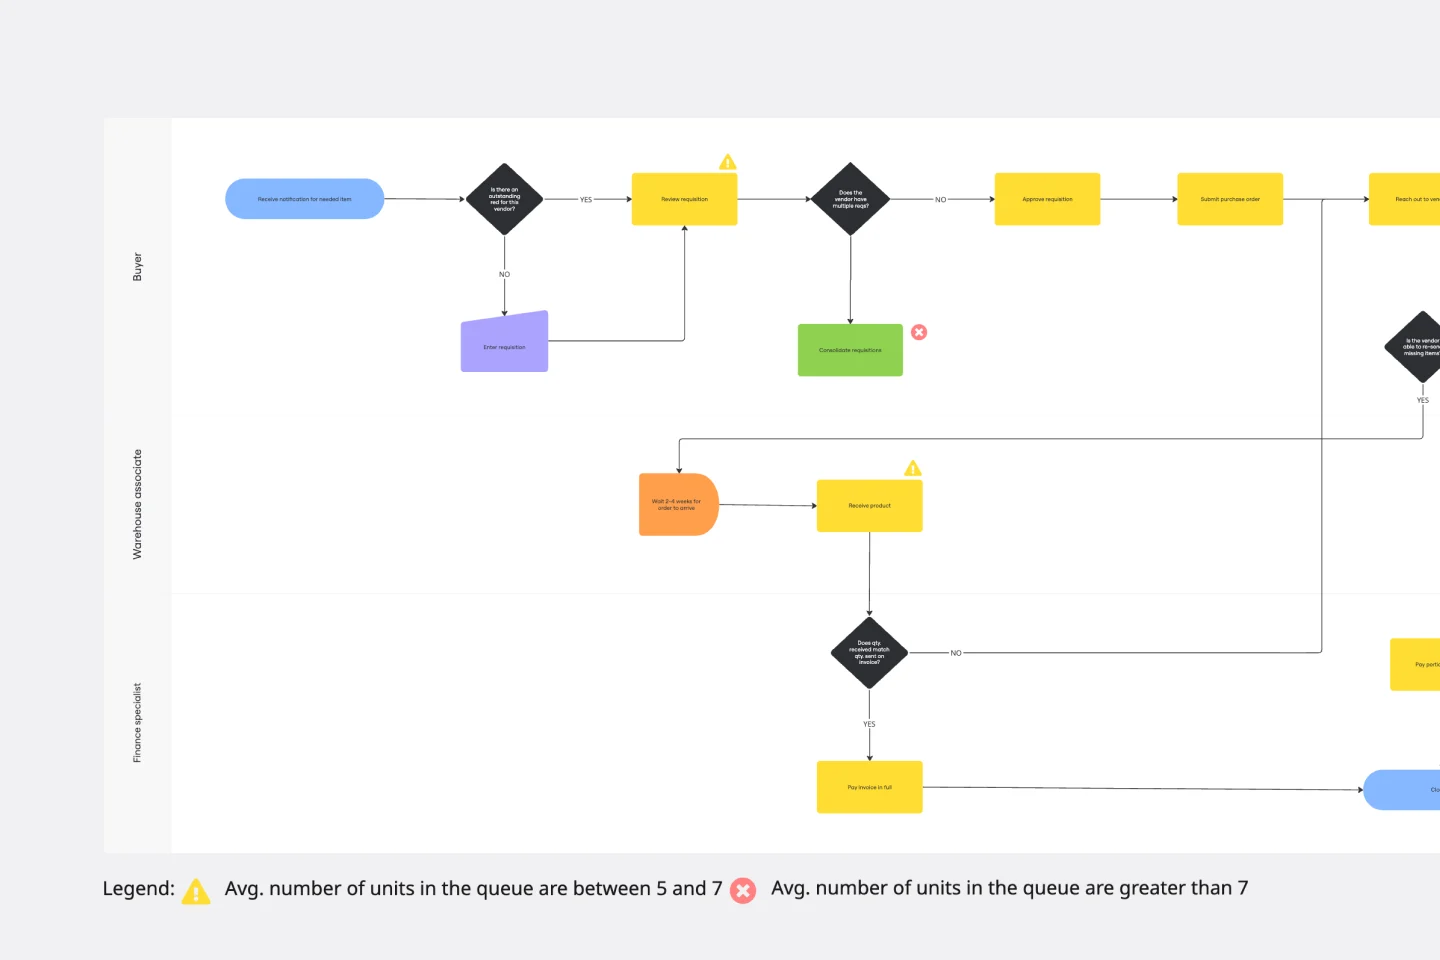
The Current State vs Future State Flowchart Template is an essential tool for strategic planning, providing teams with a dynamic and visual roadmap for organizational transformation. One of its key benefits is streamlining collaboration by using swimlanes to allocate tasks to specific departments. This feature promotes accountability and transparent communication, ensuring everyone is aligned on their responsibilities. As a result, teams can navigate complex processes with ease, fostering a shared understanding of the current and future states, ultimately leading to efficient and collaborative decision-making.

If then Flowchart Template
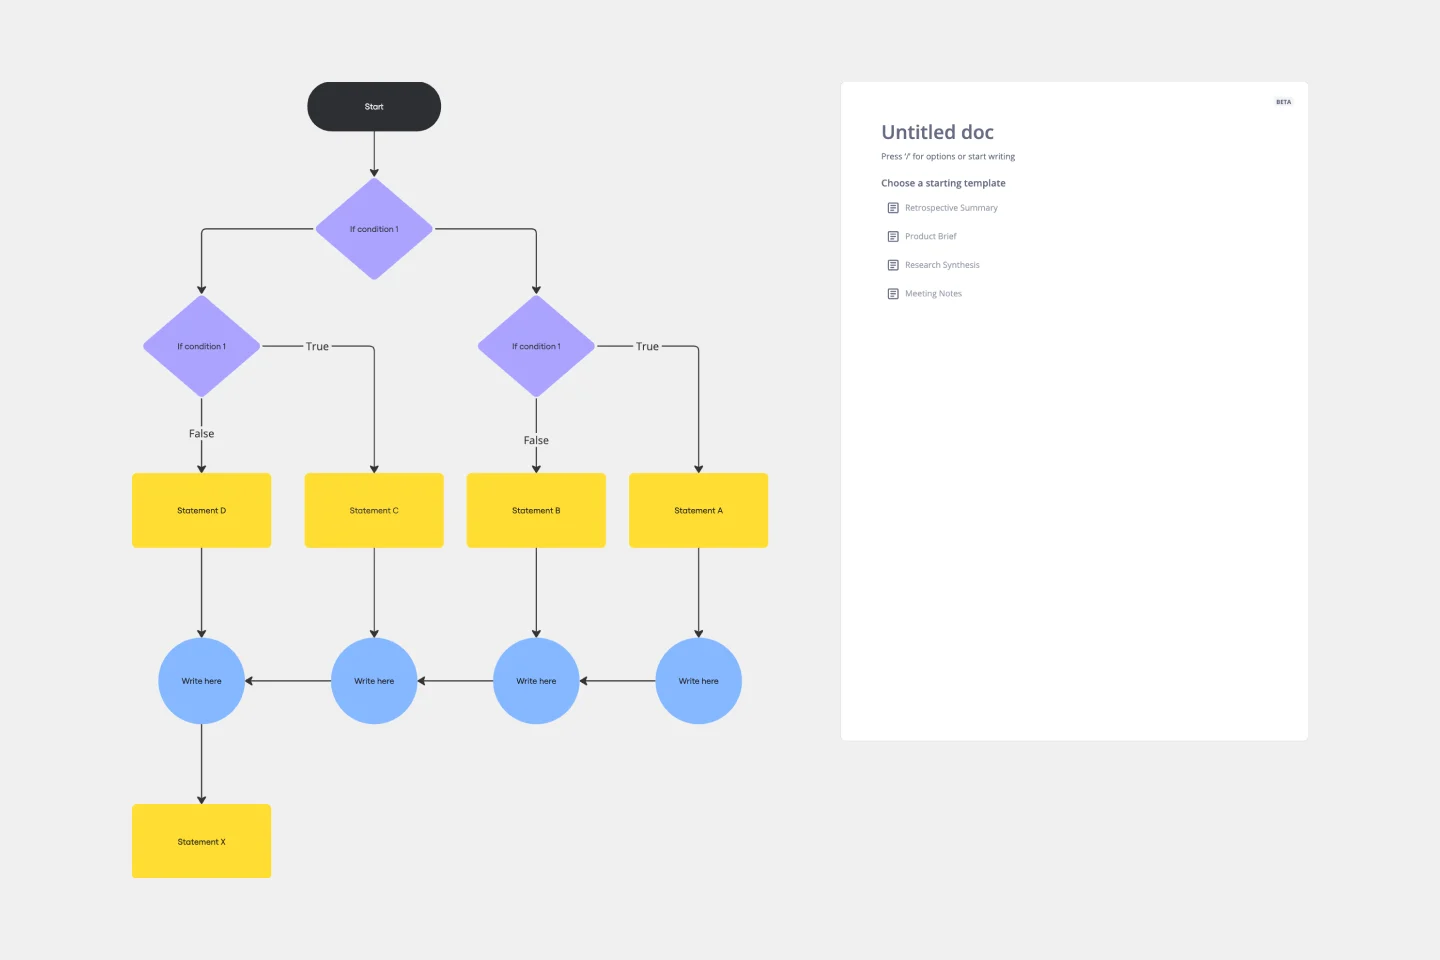
The If-then Flowchart Template is a useful tool for decision-making. It visually maps out conditional steps and outcomes, allowing users to anticipate potential challenges and opportunities. This foresight is valuable for making informed decisions, especially for those with significant implications. Whether for business strategy, project management, or personal decision-making, the template helps navigate complex decision trees with confidence.

UI Flowchart Template
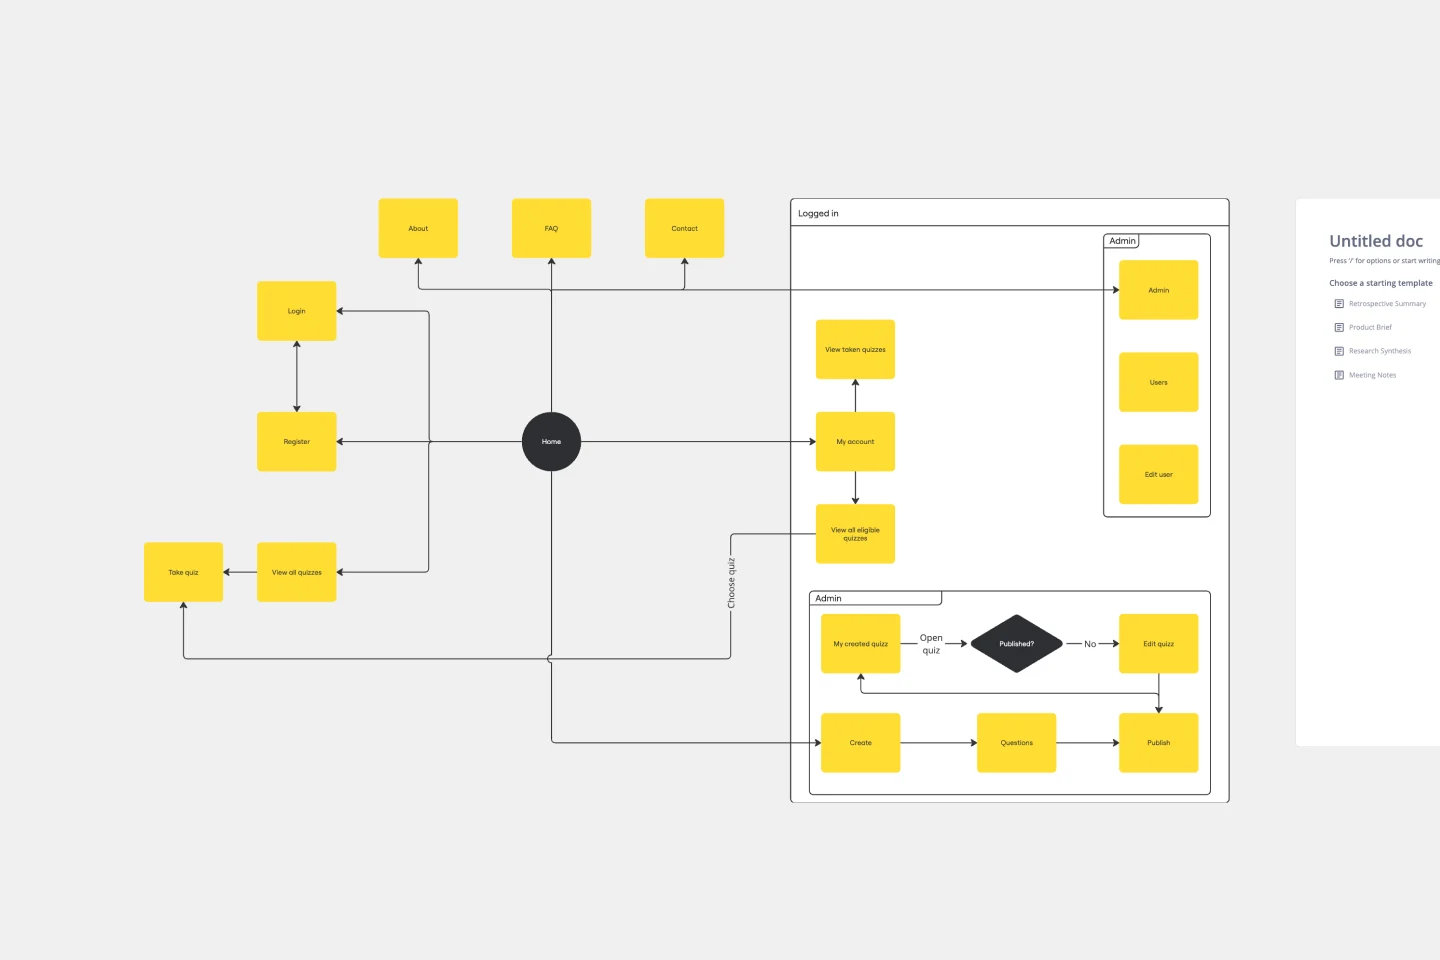
Our UI Flowchart Template unlocks the potential of seamless design collaboration. Map user flows and product interactions, providing a structured canvas to articulate the intricate journey of users through your digital interface. One key benefit of this template is its ability to facilitate real-time collaboration, ensuring everyone is on the same page and fostering a shared understanding of design decisions. Elevate your design game, enhance collaboration, and bring clarity to your projects with our UI Flowchart Template.

Software Requirements Document
Unlock unmatched project clarity and effortlessly manage your software project requirements with Miro's Software Requirements Document Template. This template helps you empower your team by visually representing your project's scope, including functional and non-functional requirements. With dynamic flowchart features, you can effortlessly expand and refine your project details, ensuring a shared understanding among team members.

Current State vs. Future State Flowchart Template
The Current State vs Future State Flowchart Template is an essential tool for strategic planning, providing teams with a dynamic and visual roadmap for organizational transformation. One of its key benefits is streamlining collaboration by using swimlanes to allocate tasks to specific departments. This feature promotes accountability and transparent communication, ensuring everyone is aligned on their responsibilities. As a result, teams can navigate complex processes with ease, fostering a shared understanding of the current and future states, ultimately leading to efficient and collaborative decision-making.

If then Flowchart Template
The If-then Flowchart Template is a useful tool for decision-making. It visually maps out conditional steps and outcomes, allowing users to anticipate potential challenges and opportunities. This foresight is valuable for making informed decisions, especially for those with significant implications. Whether for business strategy, project management, or personal decision-making, the template helps navigate complex decision trees with confidence.

UI Flowchart Template
Our UI Flowchart Template unlocks the potential of seamless design collaboration. Map user flows and product interactions, providing a structured canvas to articulate the intricate journey of users through your digital interface. One key benefit of this template is its ability to facilitate real-time collaboration, ensuring everyone is on the same page and fostering a shared understanding of design decisions. Elevate your design game, enhance collaboration, and bring clarity to your projects with our UI Flowchart Template.

Software Requirements Document
Unlock unmatched project clarity and effortlessly manage your software project requirements with Miro's Software Requirements Document Template. This template helps you empower your team by visually representing your project's scope, including functional and non-functional requirements. With dynamic flowchart features, you can effortlessly expand and refine your project details, ensuring a shared understanding among team members.