About the Genogram Template
A genogram template is a great tool to illustrate family structures and relationships. Its broad nature helps detail patterns and understand familial connections, making it essential for professionals across different domains.
The template is a graphical representation of a family tree that showcases relationships between members and generations within a family. It goes beyond the traditional family tree by adding more details, including emotional relationships and significant life events. With their visual nature, genograms can briefly represent complex family ties and histories, making it easier to identify behavior patterns and recognize hereditary tendencies.
How to use the genogram template
Filling in the genogram template is a straightforward process. With just a few clicks, elements within the template can be edited to reflect specific familial relationships and dynamics. Names, relationships, and details can easily be added and adjusted.
1. Add symbols
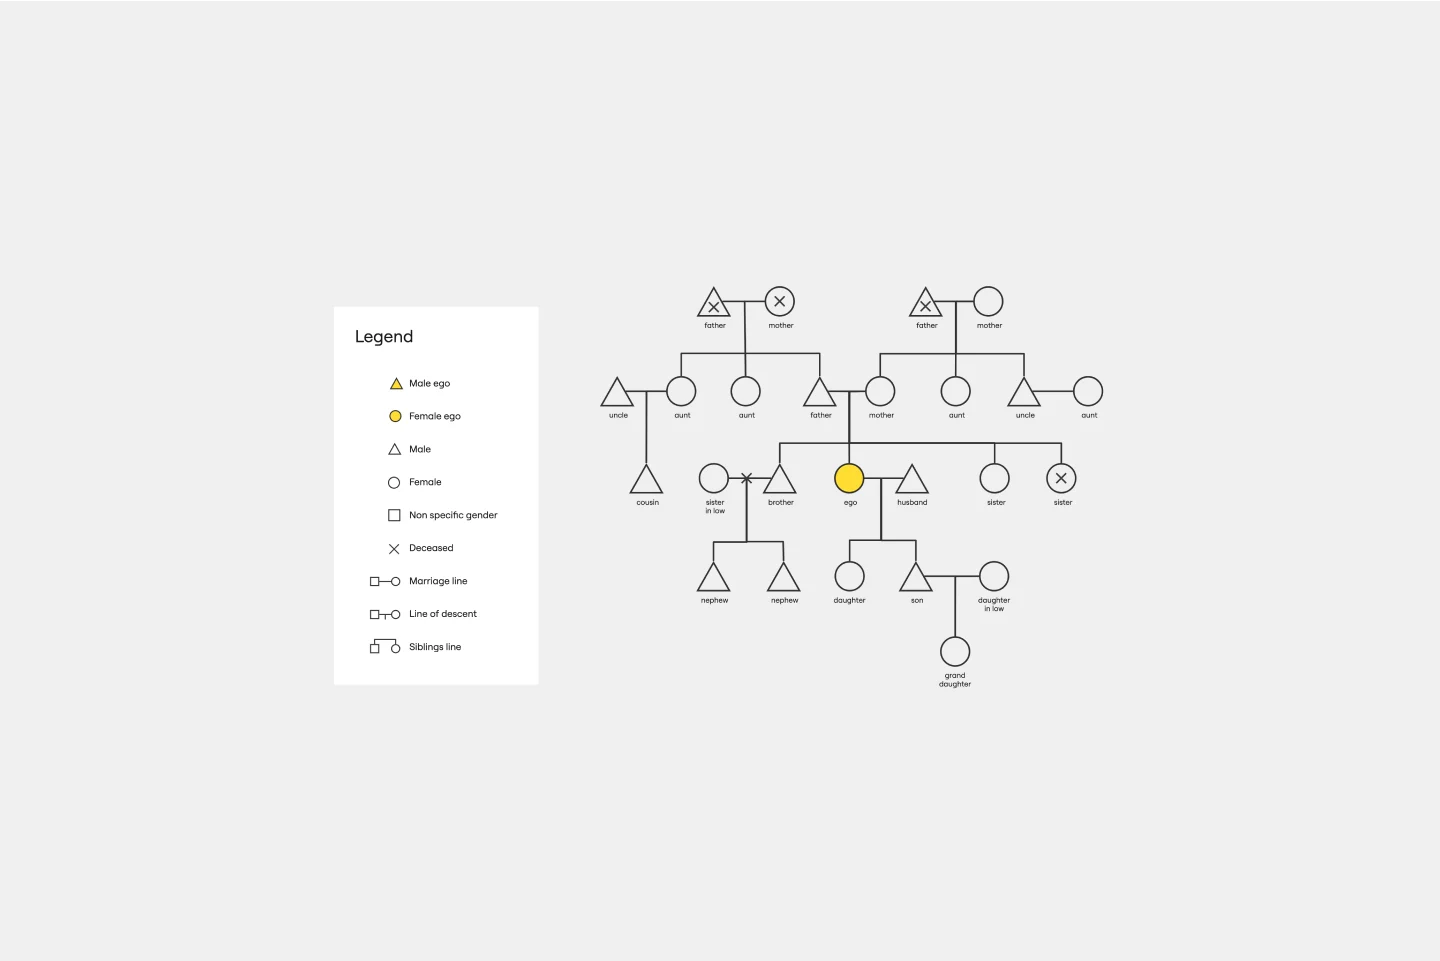
Open the template and use Miro’s extensive shapes library to represent family members. Typically, males are represented by squares and females by circles. Arrange the symbols from left to right, starting with the oldest generation at the top and moving down to the youngest.
2. Draw connections
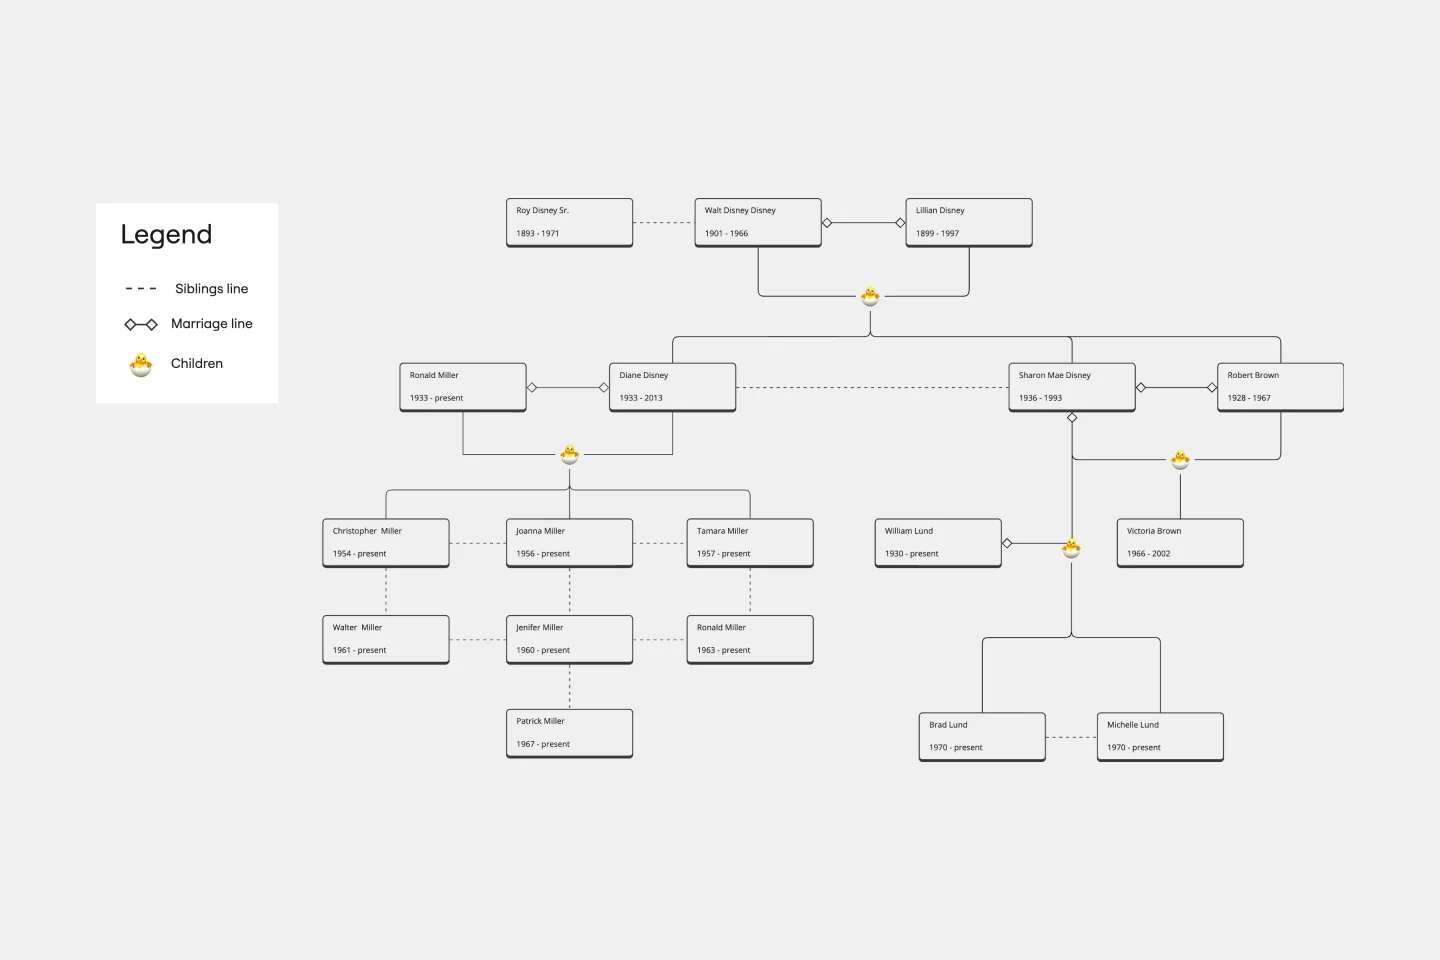
Build on the template by using lines to connect family members. For instance, a horizontal line between two shapes indicates a marital relationship, while a vertical line dropping down from a couple can connect to their children.
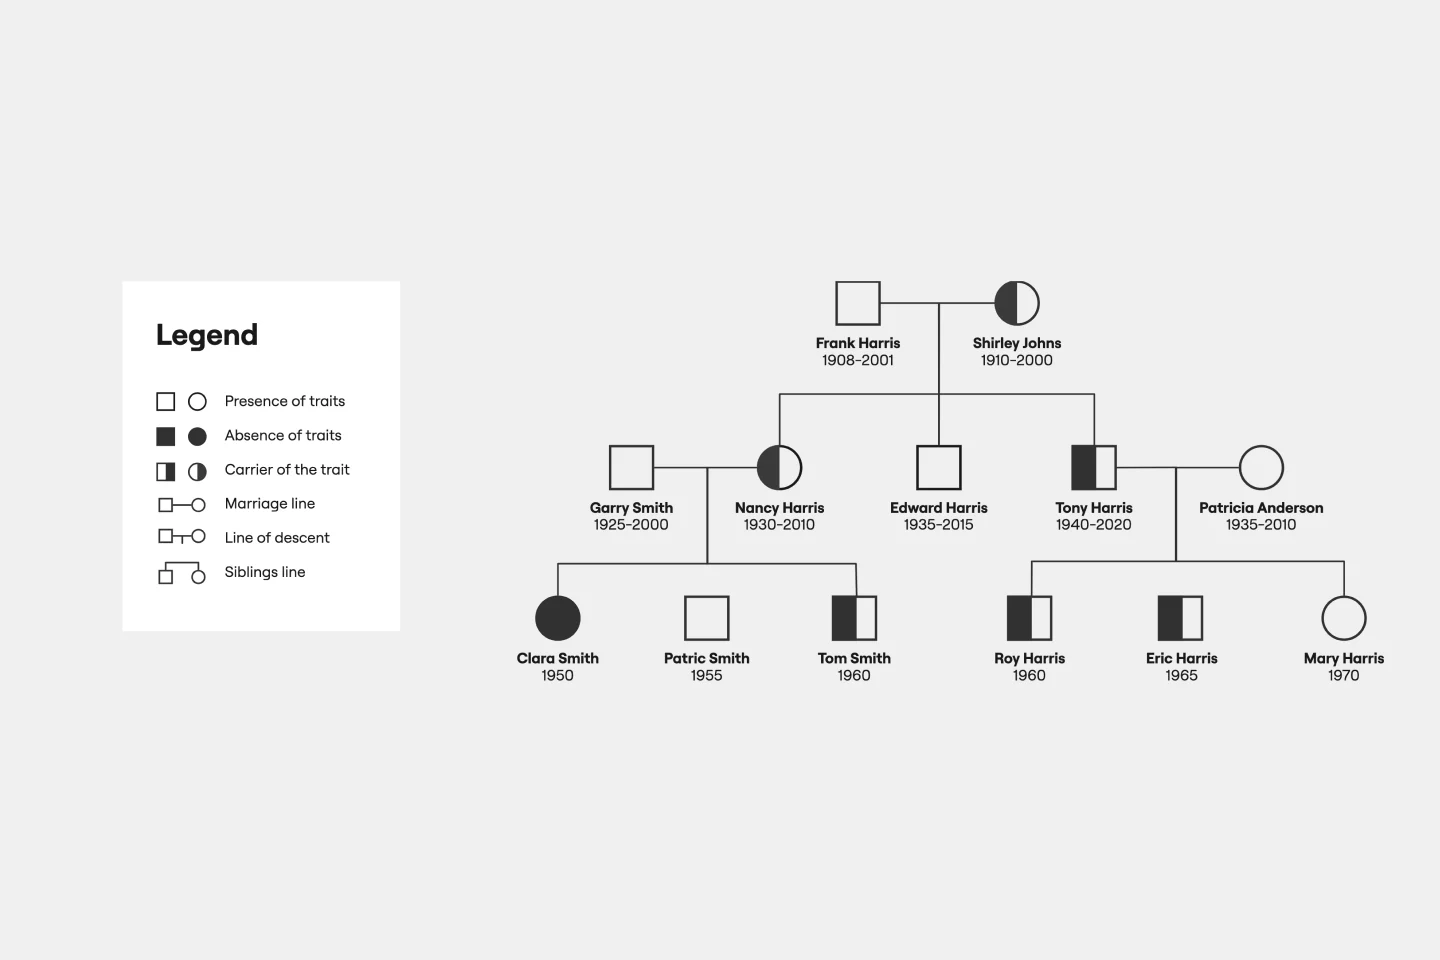
You can indicate other relationships, such as divorces, with different types of lines (e.g., dotted or double lines). Make sure to decide on a legend or key for these symbols and lines.
3. Expand your genogram
Miro’s automated diagramming features make it easy to expand the genogram, accommodating larger families without complicating the design.
4. Embed other materials
Any relevant artifact, whether a photograph, document, or note, can be incorporated onto the board for a more enriched view.
5. Collaborate and share
With Miro as your genogram maker, you can invite others to collaborate if you're working as a team or if you want family members to provide input. Use the sharing options to share your genogram with others or to export it as an image or PDF.
Why should you use a genogram template?
Easy to create and update: By using a template to create a genogram, you can easily customize the diagram and keep it up-to-date.
Deep insights: Unlike basic family trees, genograms delve deeper into the nuances of relationships, offering insights into patterns and trends that may be hereditary or environmental.
Holistic view: By encompassing emotional, medical, and relational aspects, the template provides a comprehensive perspective on familial dynamics.
Adaptable application: Many professionals can benefit from the detailed structure of genograms, from therapists to genealogists to educators.
Efficient communication: The visual format ensures easy interpretation and can be a visual aid for professionals explaining intricate relationships to clients or colleagues.
Problem identification: By visualizing problematic relationships or patterns, interventions or solutions can be more effectively designed and implemented.
Genogram FAQs
What's the difference between a family tree and a genogram?
While both tools represent family structures, a genogram is more detailed, highlighting emotional ties, medical history, and other significant life events.
How detailed should a genogram template be?
The depth of detail largely depends on its intended use. For some, basic relationships suffice, while others may need intricate details for therapeutic or research purposes.
Is there a limit to how large the genogram can be?
The automated diagram feature can expand the template to accommodate large family structures, ensuring clarity and coherence.
Can I collaborate with others on this genogram template?
Yes, collaboration is a built-in feature, allowing multiple contributors to edit, view, and comment in real time, making the process interactive and comprehensive.