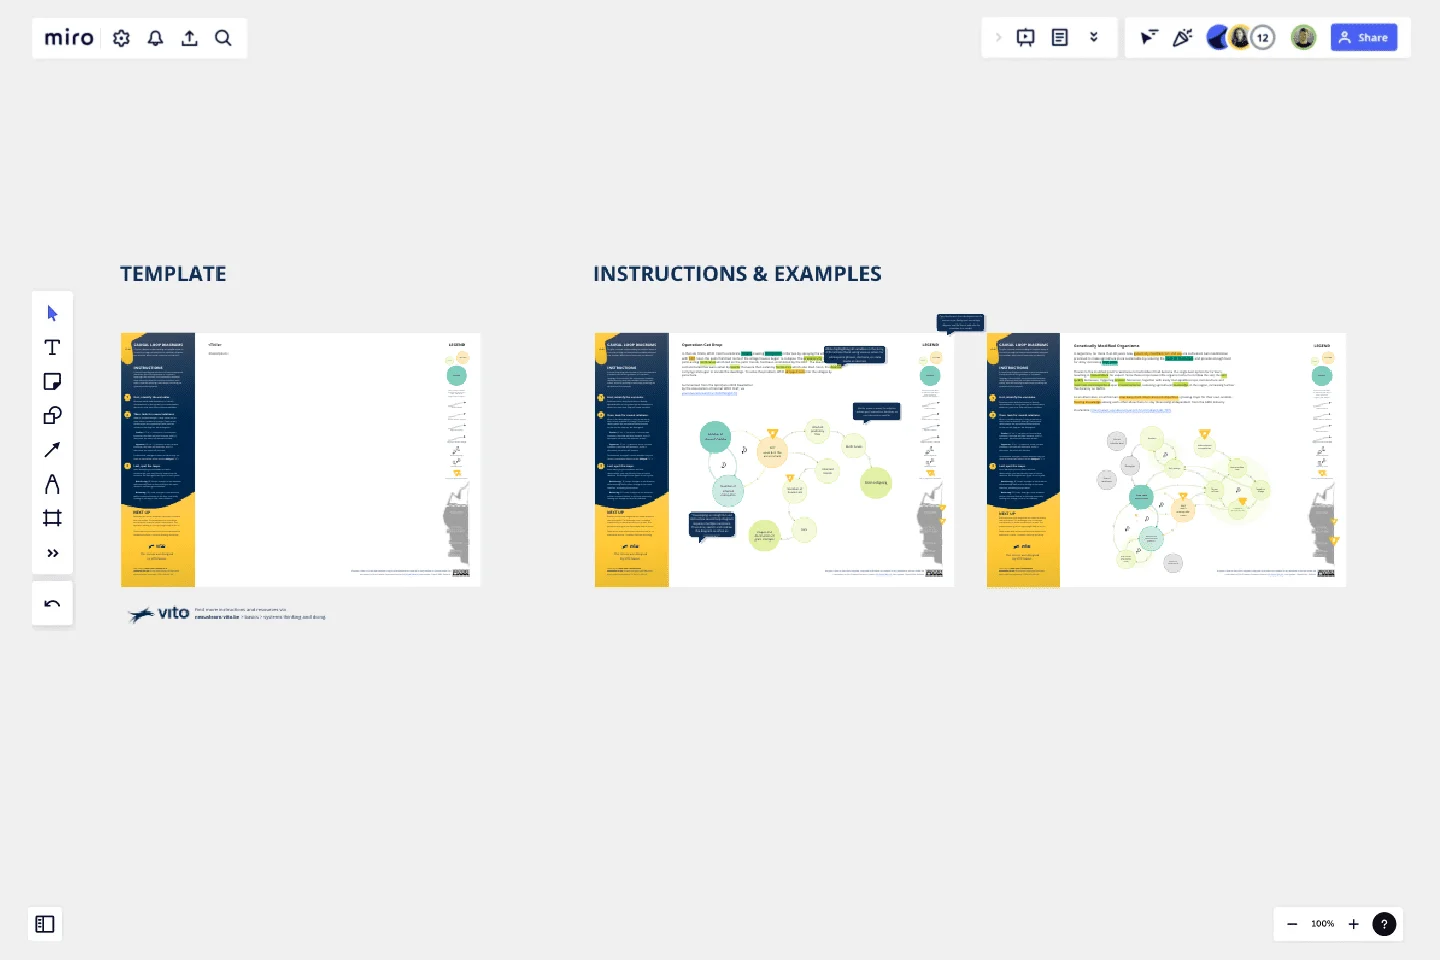
Causal Loop Diagrams (1.0)
To gain a deeper understanding of complex issues, it is crucial to map out how various variables influence one another. What causal loops can you identify?
To gain a deeper understanding of complex issues, it is crucial to map out how various variables influence one another. What causal loops can you identify?
A causal loop diagram consists of three fundamental elements, akin to the grammar of a system's language: the variables, the connections between them (depicting how the variables influence each other), and the resulting causal loops (revealing the dynamics of the systems).
This template offers a 3-step instruction, providing you with the basic building blocks to copy, and two inspiring examples. Let's begin mapping together!
Get started with this template right now.
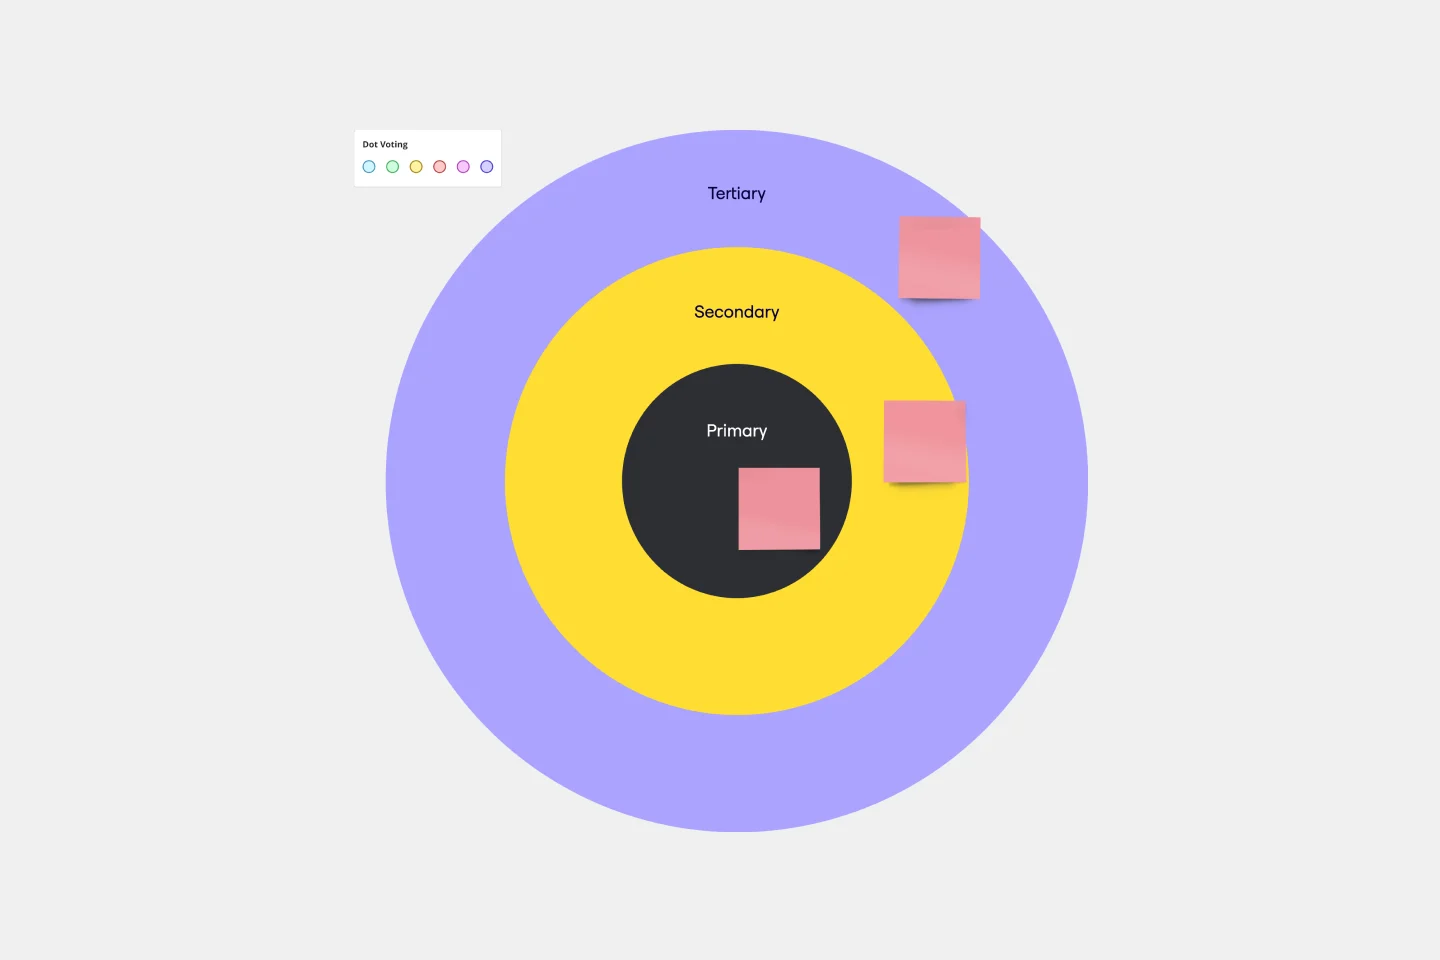
Bull's Eye Diagram Template
Works best for:
Diagrams, Project Management, Prioritization
When you’re a growing organization, every decision can feel like it has make-or-break consequences—which can lead to decision paralysis, an inability to prioritize, inefficient meetings, and even low morale. If that sounds like you, put a Bull’s Eye Diagram to work. True to its name, a Bull’s Eye Diagram uses a model of concentric circles to help companies establish priorities, make critical decisions, or discuss how to remove or overcome obstacles.
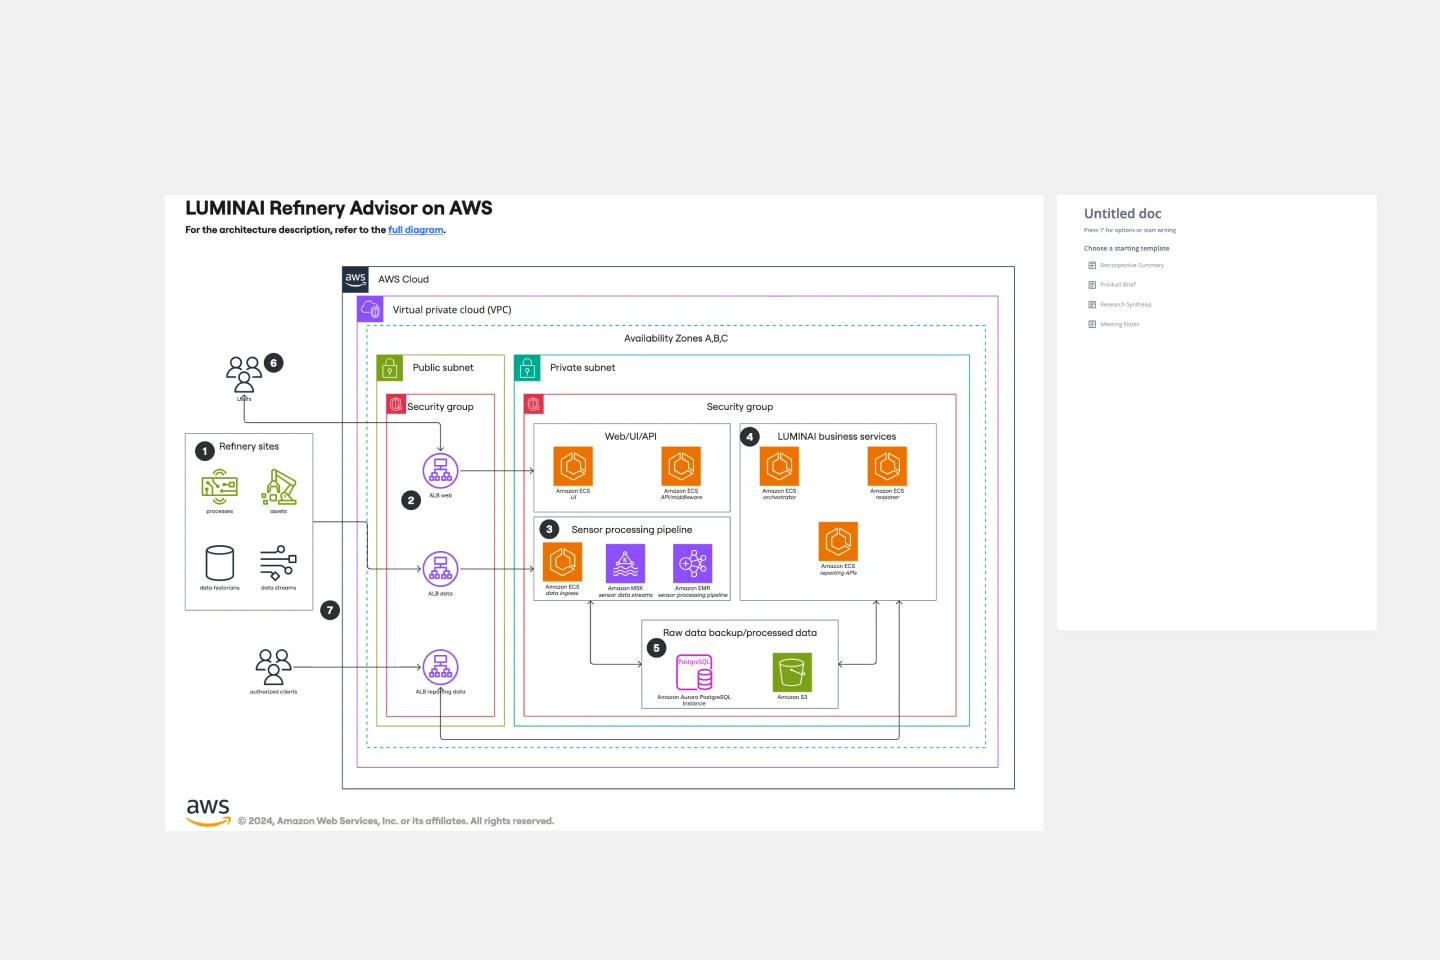
LUMINAI Refinery Advisor on AWS Template
Works best for:
AWS
The LUMINAI Refinery Advisor on AWS template streamlines and optimizes refinery operations through AWS. It provides a structured approach to setting up and managing AWS services, tailored specifically for engineers, developers, and data scientists in the refinery sector. This template not only saves time and effort by offering a predefined structure and best practices but also allows for customization to meet specific operational needs. With its focus on enhancing data processing capabilities, the LUMINAI Refinery Advisor on AWS template is an invaluable resource for improving the efficiency, effectiveness, and optimization of refinery processes on the AWS platform.
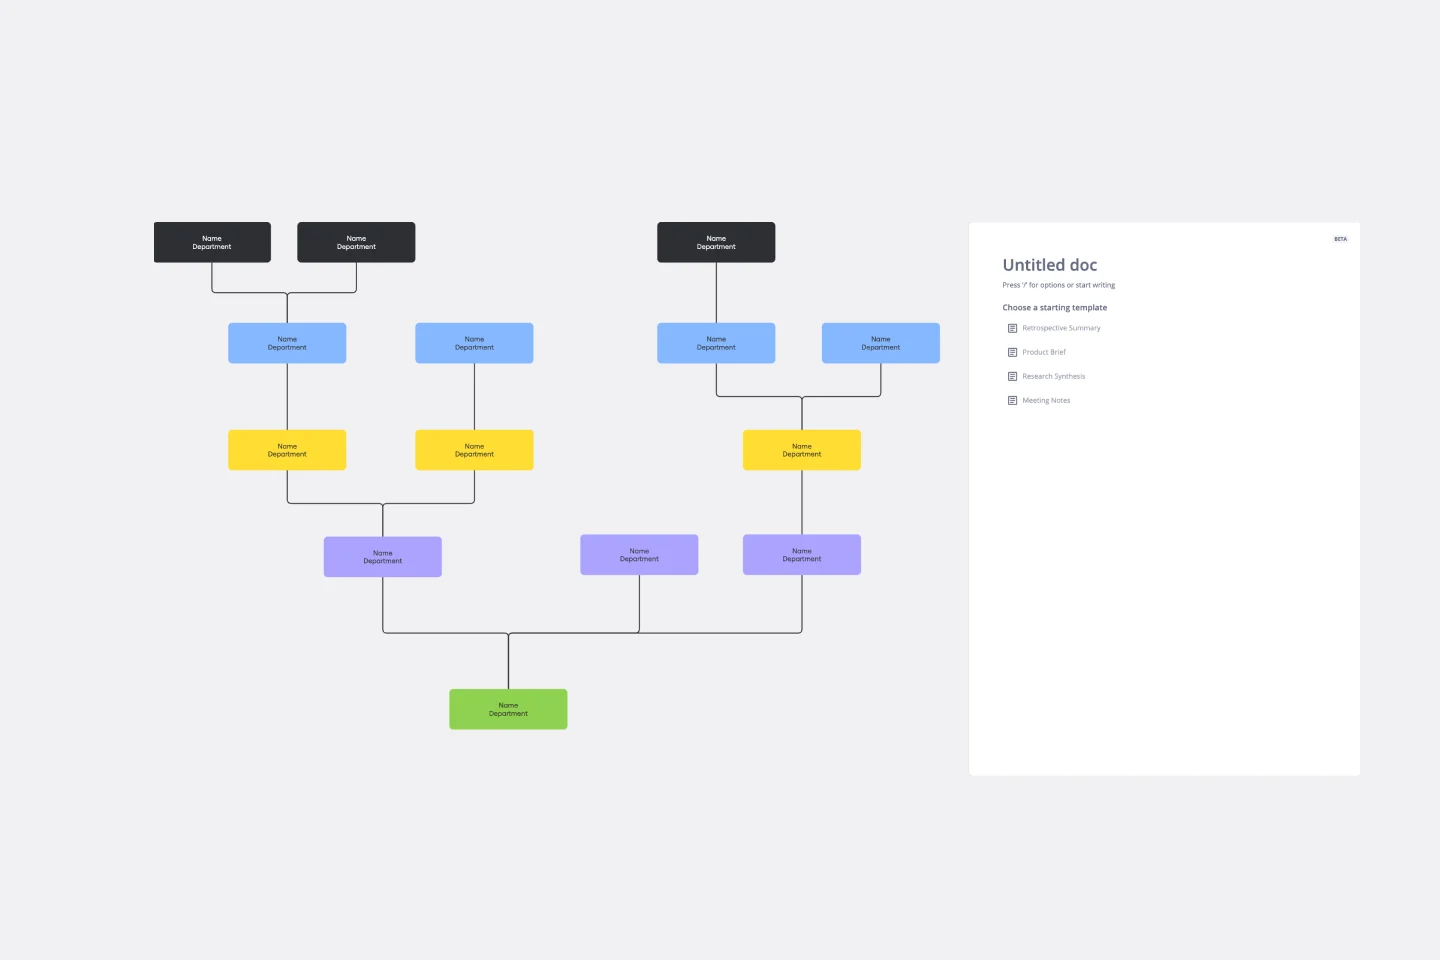
Inverted Org Chart Template
Works best for:
Org Charts, Organizational Design
The Inverted Org Chart Template is a tool that reimagines the traditional hierarchical model by placing frontline employees at the top of the organizational structure. This innovative approach highlights the crucial role played by those who interact with customers directly, ensuring that their insights and contributions are not only recognized but also celebrated. One of the key advantages of this template is that it fosters a feedback-driven environment. Prioritizing frontline workers promotes a culture where valuable insights from the ground can quickly reach the top of the hierarchy, streamlining decision-making processes and ensuring that strategies are based on real-world experiences.
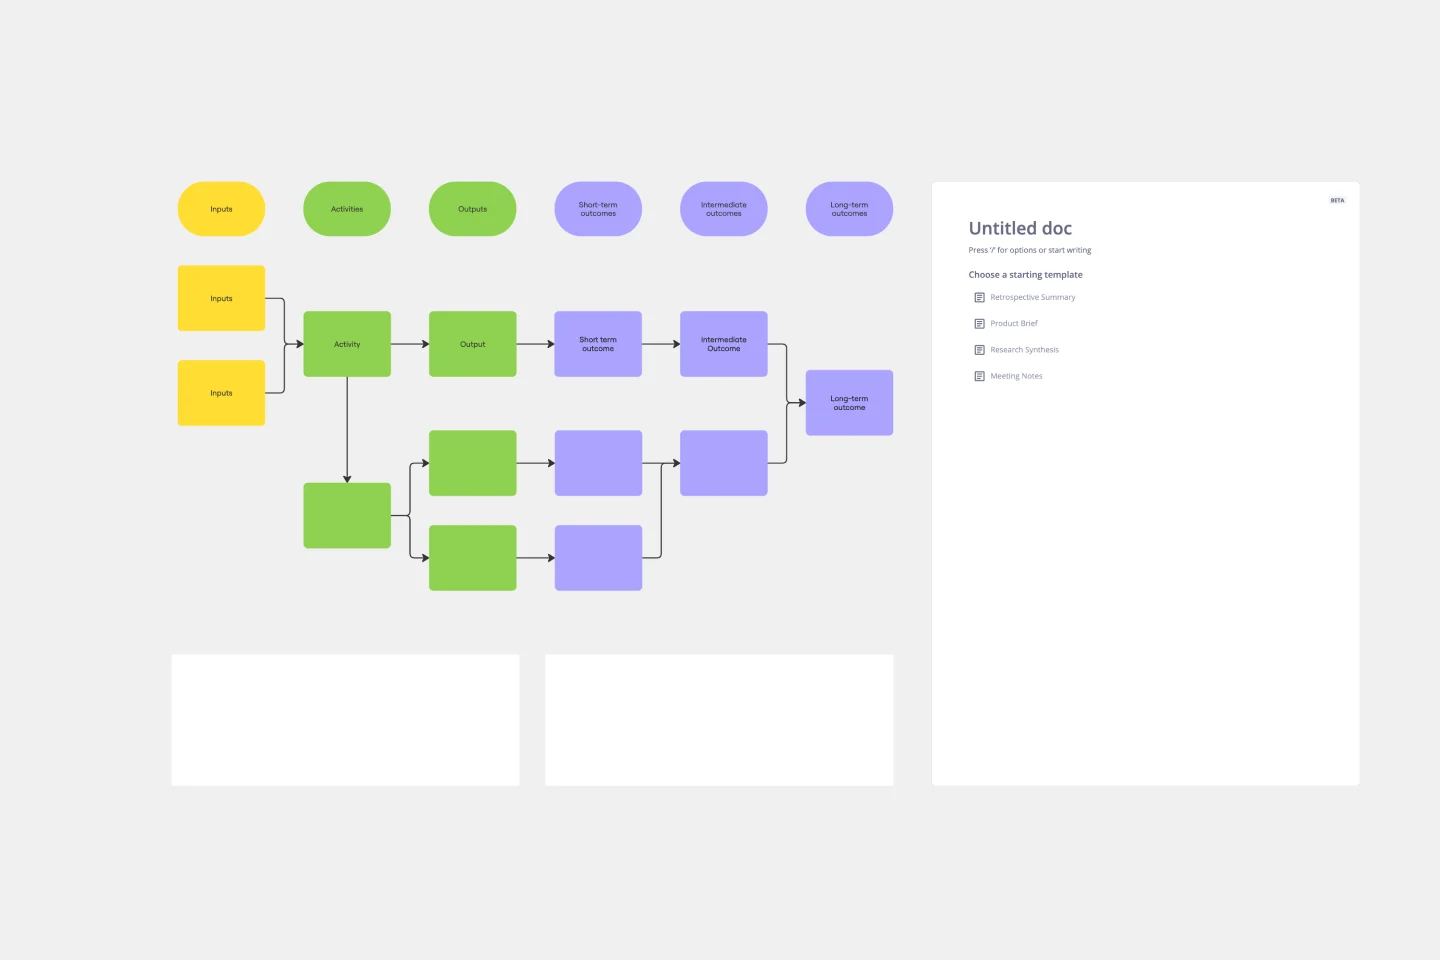
Logic Model Template
Works best for:
Diagramming
The logic model template is a strategic visual tool designed to delineate the relationship between a program's inputs, activities, outputs, and outcomes. By providing a clear and comprehensive map of the project lifecycle, stakeholders can swiftly grasp the intricate connections within a given initiative. One standout benefit of this template is its ability to enhance clarity: by visually representing the transformation of resources into anticipated results, teams can ensure more efficient and targeted use of their resources, thus maximizing the potential for success in their endeavors.
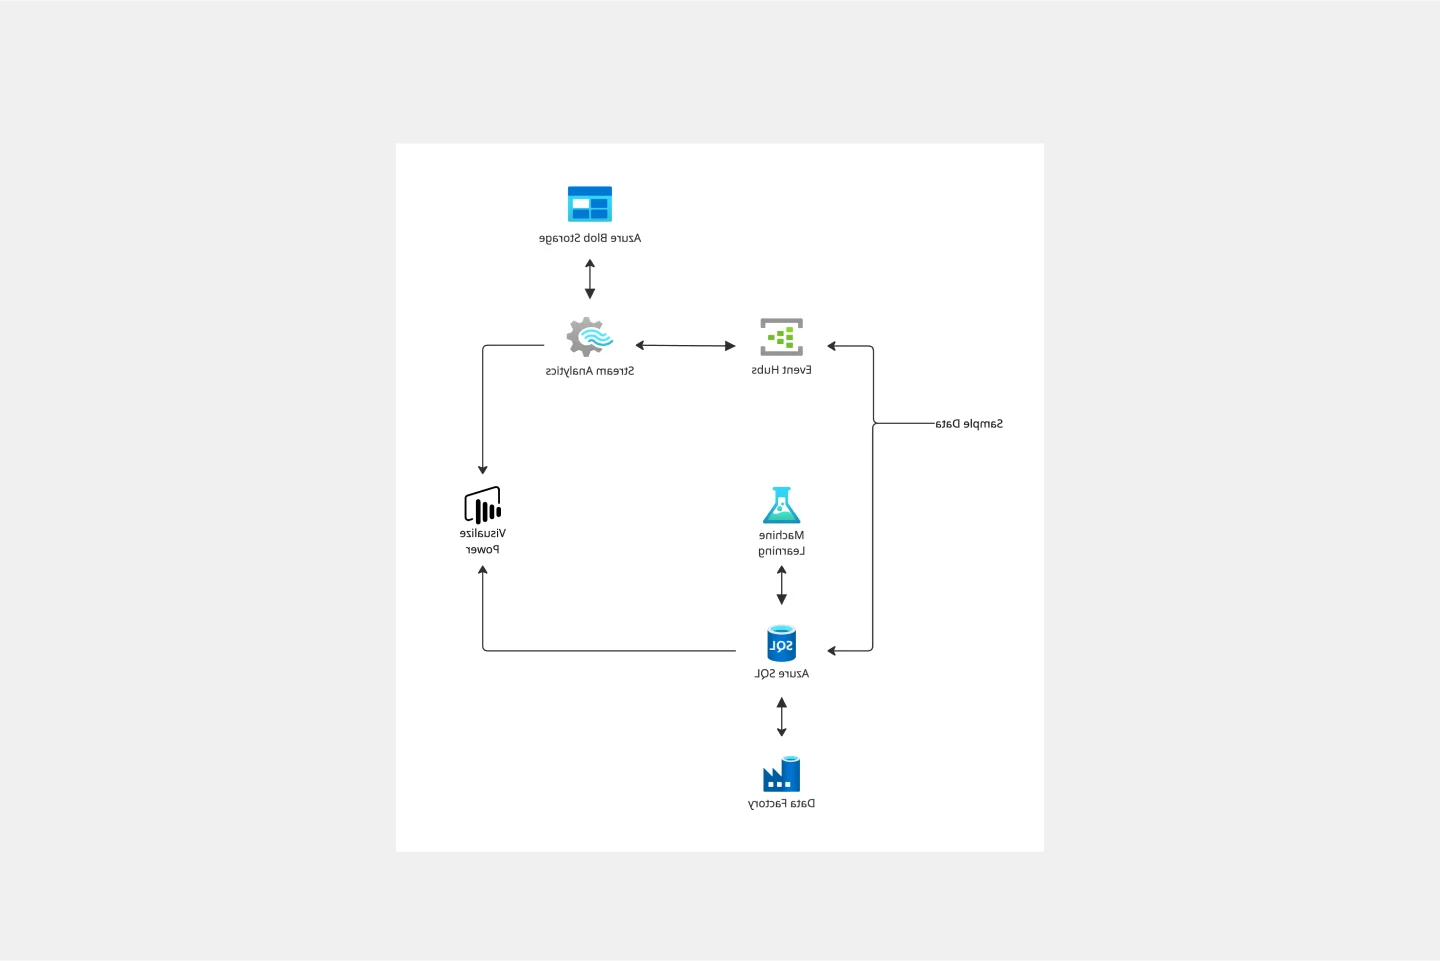
Azure Demand Forecasting Template
Works best for:
Software Development, Diagrams
The Azure Demand Forecasting diagram will show the architecture of a demand forecast, making it easier for you to predict data consumption, costs, and forecast results. Azure is Microsoft’s cloud computing platform, designed to provide cloud-based services such as remote storage, database hosting, and centralized account management. Azure also offers new capabilities like AI and the Internet of Things (IoT).
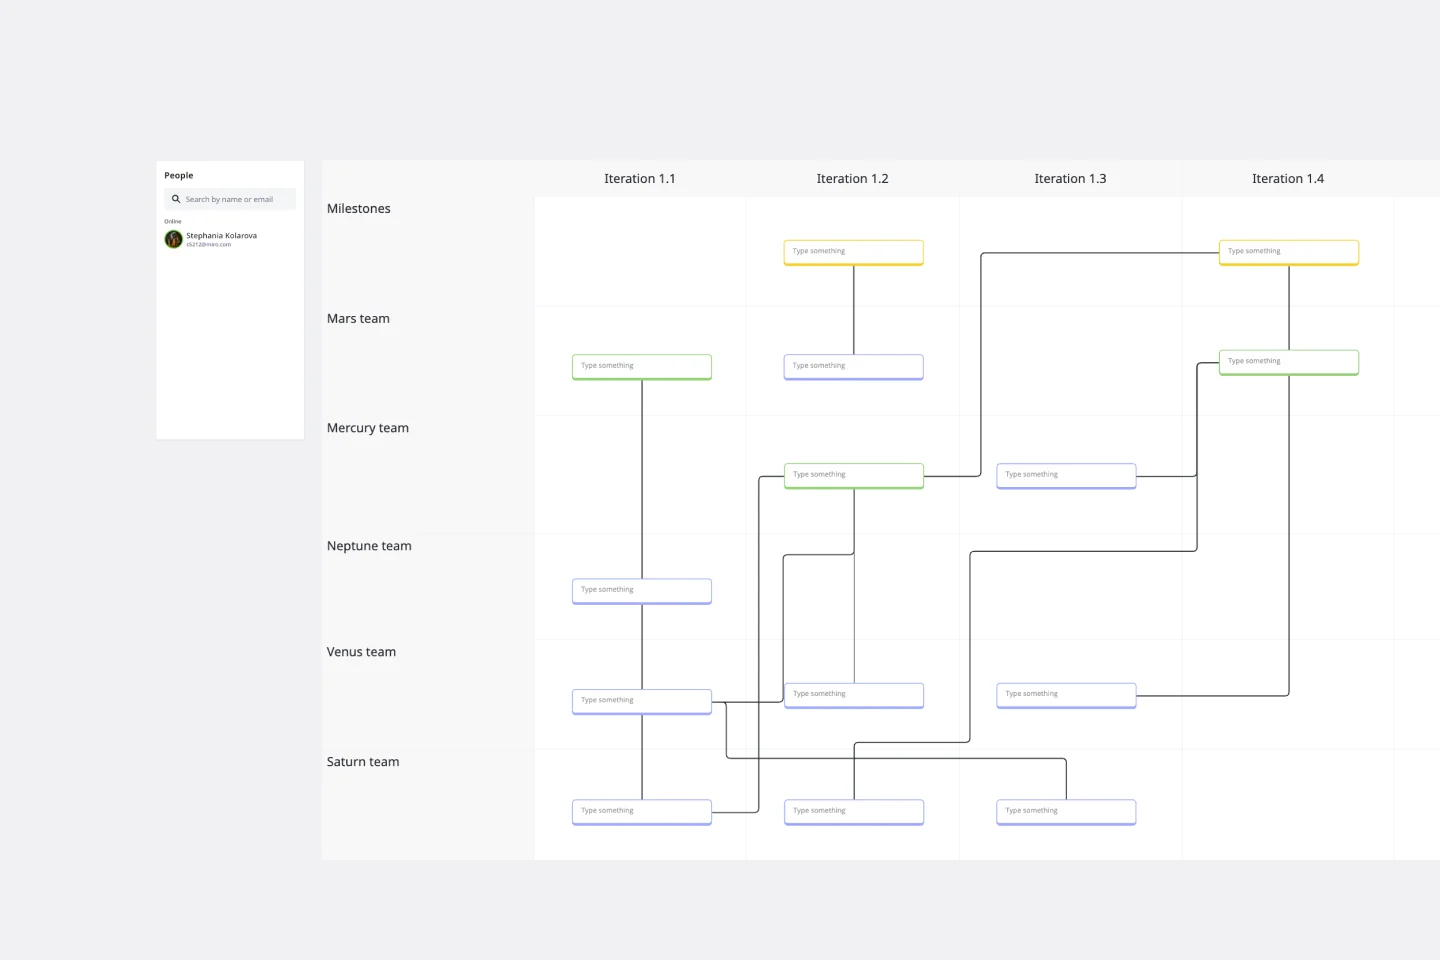
SAFe Program Board
Works best for:
Agile Methodology, Diagrams, Agile Workflows
Many organizations use the Agile model, but even companies that don’t rigorously adhere to all Agile standards have adopted Agile tools and methods like Program Increment (PI) Planning. Even if you’re not participating in a formal PI session, a program board can be a great way to establish communication across teams and stakeholders, align development objectives with business goals, clarify dependencies, and foster cross-functional collaboration. The board provides much-needed structure to planning sessions, yet is adaptable enough to accommodate brainstorming and alignment meetings.