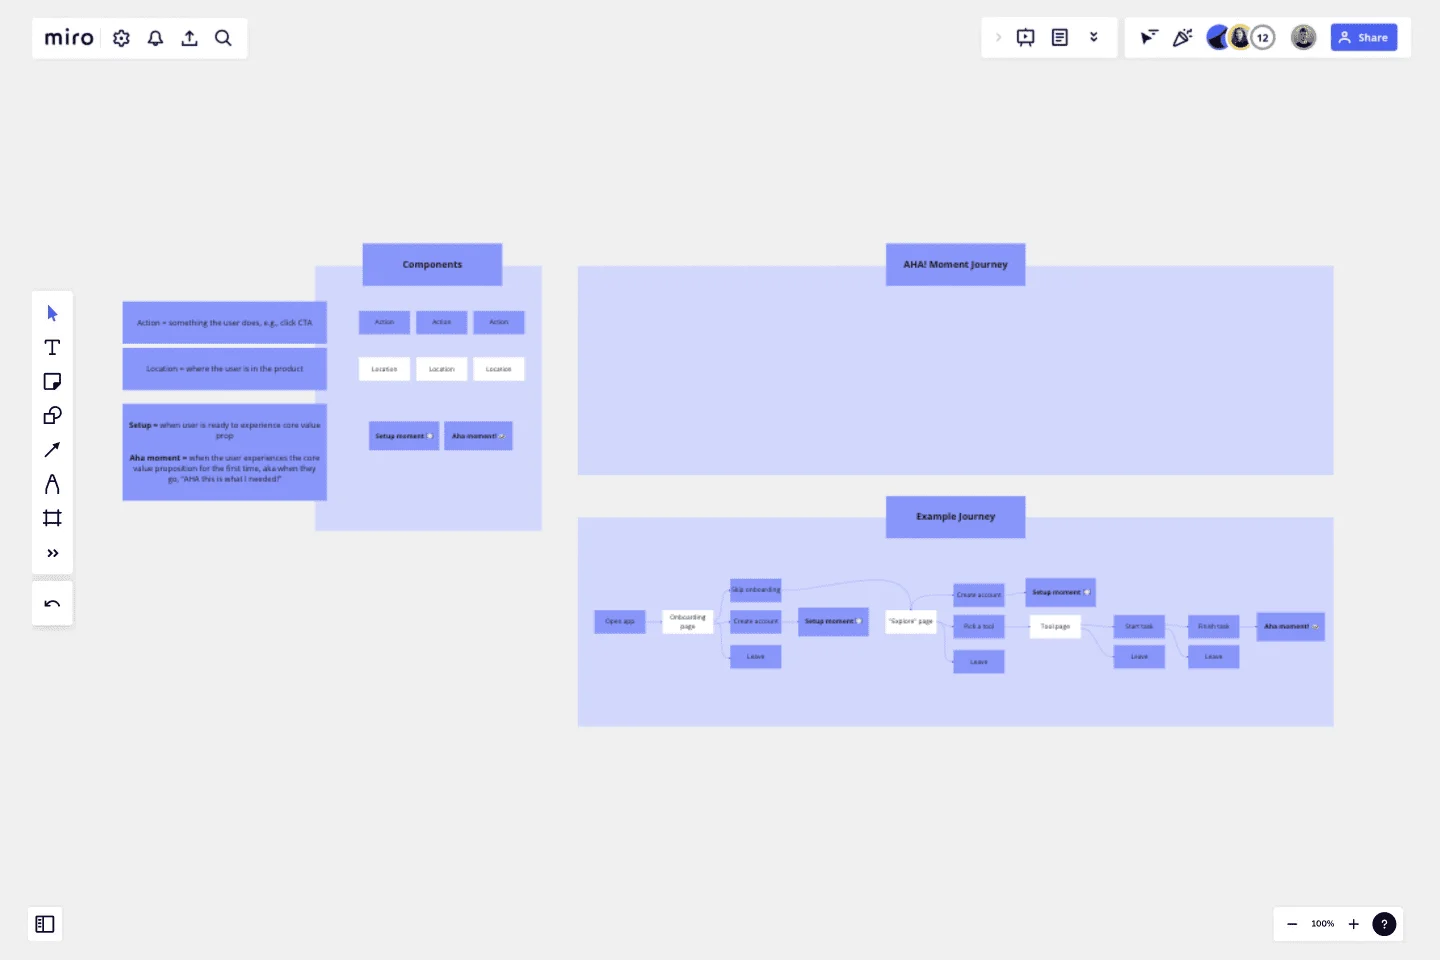
AHA! Moment Flowchart
Break down the user journey to the first aha moment!
The aha moment is the first time the user experiences the core value proposition. Mapping out the journey will help you to identify the roadblocks that might hinder your users from experiencing the benefit you intend to bring with your product.
Make sure to map out every action and every page the user visits in order to pin point potential UX issues to fix. Have fun!
Get started with this template right now.
UML ERD Diagram
Works best for:
Diagramming, UML Diagram
This template contains a few Entity-Relationship diagrams that you can re-use for your own work.
Kanban Planner 2024 Week & Month
Works best for:
Kanban Boards, Agile Methodology, Agile Workflows
KANBAN Planner 2024 Week & Month template provides a flexible framework for planning and managing tasks on a weekly and monthly basis. By organizing tasks by priority and deadlines, teams can optimize their workflow and ensure timely delivery of projects. This template fosters transparency and accountability, enabling teams to collaborate effectively and achieve their goals efficiently.
Salesforce Flow Builder
Works best for:
Flowcharts, Mapping, Diagrams
The Salesforce Flow Builder template offers a visual tool for designing and automating business processes within the Salesforce platform. It provides elements for creating flowcharts that represent process flows, decision logic, and data transformations. This template enables Salesforce administrators and developers to streamline workflows, improve productivity, and enhance user experiences. By promoting automation and efficiency in Salesforce process design, the Salesforce Flow Builder empowers organizations to leverage the full potential of the Salesforce platform and drive business success effectively.
Genogram Template
Works best for:
Diagramming
The Genogram Template maps out family structures and relationships with exceptional depth and detail. Unlike traditional family trees, this template provides a comprehensive perspective by encapsulating familial connections, emotional ties, and significant life events. Create a genogram to unearth patterns and trends within a family, whether hereditary or environmental. Professionals across different domains can gain a holistic understanding of familial dynamics by showing deep insights into the nuances of relationships, facilitating better communication and problem-solving.
Supply Chain Diagram Template
Works best for:
Diagramming
The Supply Chain Diagram Template is great for businesses to streamline and enhance their supply chain processes. This template lets you visualize the entire supply chain, from sourcing raw materials to delivering finished products. Its intuitive layout simplifies complex networks, making identifying key areas and potential bottlenecks easier. One of the standout benefits of using this template is its clarity. It bridges the gap between complex processes and strategic decision-making by presenting a clear, visual supply chain representation. This clarity enables teams to pinpoint inefficiencies and implement more effective management strategies, which optimizes operations and facilitates better communication and understanding across different departments within an organization.
Business Mindmap
Works best for:
Diagramming
The Business Mindmap template is a visual tool for brainstorming, organizing, and presenting business ideas and concepts. It provides a structured framework for capturing and connecting thoughts, insights, and action items. This template enables teams to explore business strategies, analyze market trends, and develop innovative solutions. By promoting creativity and collaboration, the Business Mindmap empowers teams to generate and communicate actionable business plans effectively.
