Table of contents
Table of contents
Network topology diagrams explained: Everything you need to know
Summary
In this guide, you will learn:
- What a network topology diagram is: a visual representation of network layout.
- Common network topologies and their impact on performance, like bus, star, and mesh.
- How to create a network topology diagram using Miro, with templates, custom shapes, and real-time collaboration.
- Features of Miro’s network diagram tool: ease of use, data integration, scalability, and consistency.
- Best practices for enhancing diagrams with labeling, color coding, layering, and standard symbols.
- How Miro supports collaborative diagramming, security, and updating diagrams as networks evolve.
Collaborative AI Workflows
Join thousands of teams using Miro to build the right thing, faster.
Network topology diagram: a visual guide
Imagine trying to navigate a new city without a map. You'd likely get lost and frustrated quickly. The same can be said for understanding complex network structures without a network topology diagram. These visual guides are essential for mapping out and understanding the complex web of connections in a network.
What is a network topology diagram?
A network topology diagram is a graphical representation of a network's layout, showing how different nodes, devices, and connections interact. It provides a visual map of the network's structure, making it easier to understand the relationships and dependencies between various components.
Why is it important for product teams?
For product teams, a network topology diagram is more than just a map—it's a crucial tool for planning, troubleshooting, and communication. It helps teams visualize the network's current state, identify potential issues, and plan for future expansions. By offering a clear picture of the network's structure, these diagrams become indispensable tools for anyone involved in network design, maintenance, or management.
How do teams use network topology diagrams?
Product teams use network topology diagrams in several ways:
- Design and planning: During the design phase, teams use these diagrams to plan the layout of new networks or modifications to existing ones. They help visualize where each component will be placed and how they will connect.
- Troubleshooting: When network issues arise, these diagrams help pinpoint the problem areas and understand how different components are affected.
- Documentation and communication: Network topology diagrams serve as a visual reference that can be shared with team members and stakeholders. This ensures everyone has a common understanding of the network's structure and can communicate more effectively.
Understanding the symbols and notations
Before diving into creating network topology diagrams, it's essential to understand the symbols and notations that represent various network components. Think of it as learning the language of network diagrams. Once you grasp the basics, reading and creating these diagrams becomes much more intuitive.
Common symbols and their meanings
- Circles and ovals (nodes/endpoints): These symbols represent network nodes or endpoints, such as computers, printers, or other devices that connect to the network.
- Squares and rectangles (devices): These shapes indicate devices like routers, switches, and servers. Routers direct data packets between networks, switches connect devices within a network, and servers provide services to other devices on the network.
- Lines (connections): Lines show the connections between devices. Different styles (solid, dashed) indicate various types of connections (wired, wireless). Solid lines often represent wired connections, while dashed lines indicate wireless links.
- Triangles (wireless access points): Triangles usually denote wireless access points, which provide Wi-Fi connectivity to devices within a certain range.
- Double circles (gateways): These symbols represent gateways, devices that connect different networks and manage traffic between them.
By mastering these symbols, you can create detailed and accurate network topology diagrams that effectively communicate complex information.
Types of network topologies
Network topologies come in various shapes and sizes, each with its unique benefits and challenges. Understanding the different types helps you choose the right one for your specific needs.
Bus topology
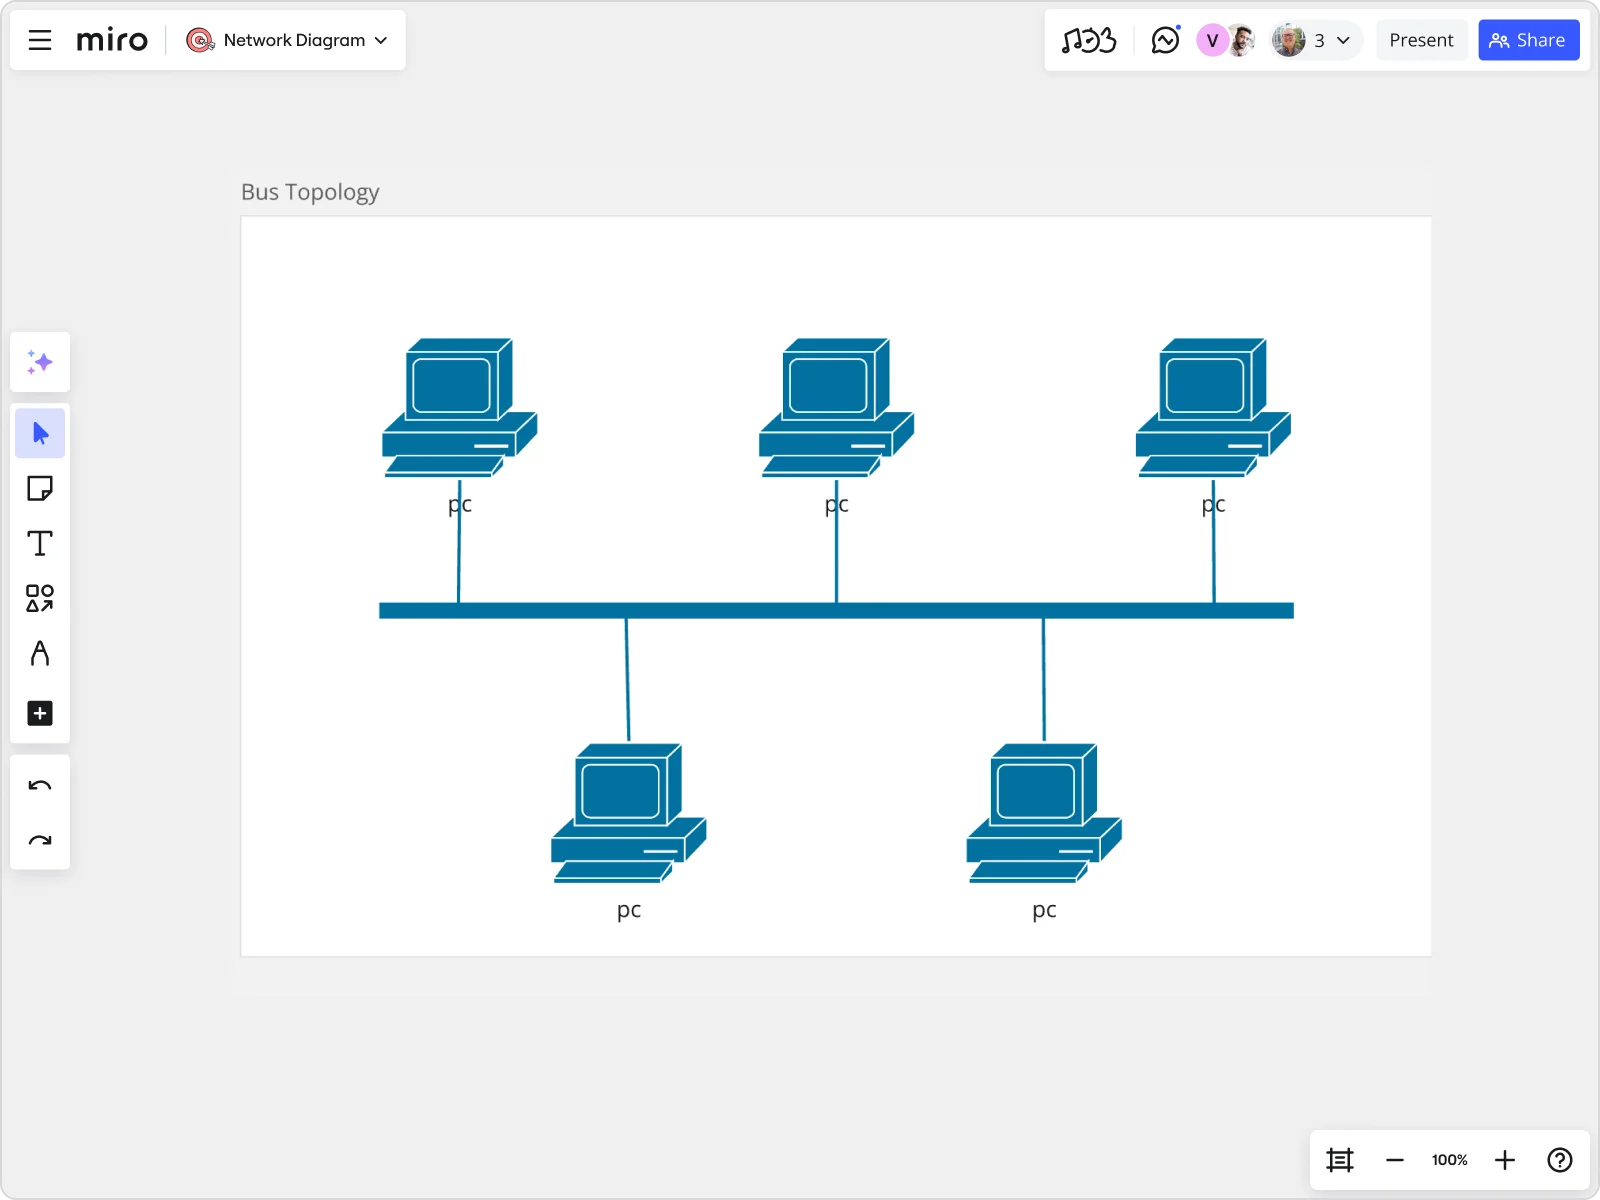
In a bus topology, all devices are connected to a single central cable, or bus. This setup is simple and cost-effective but can be prone to failures. If the central bus encounters an issue, the entire network can go down. However, it's easy to add new devices to the network, making it suitable for small networks with limited growth.
Star topology
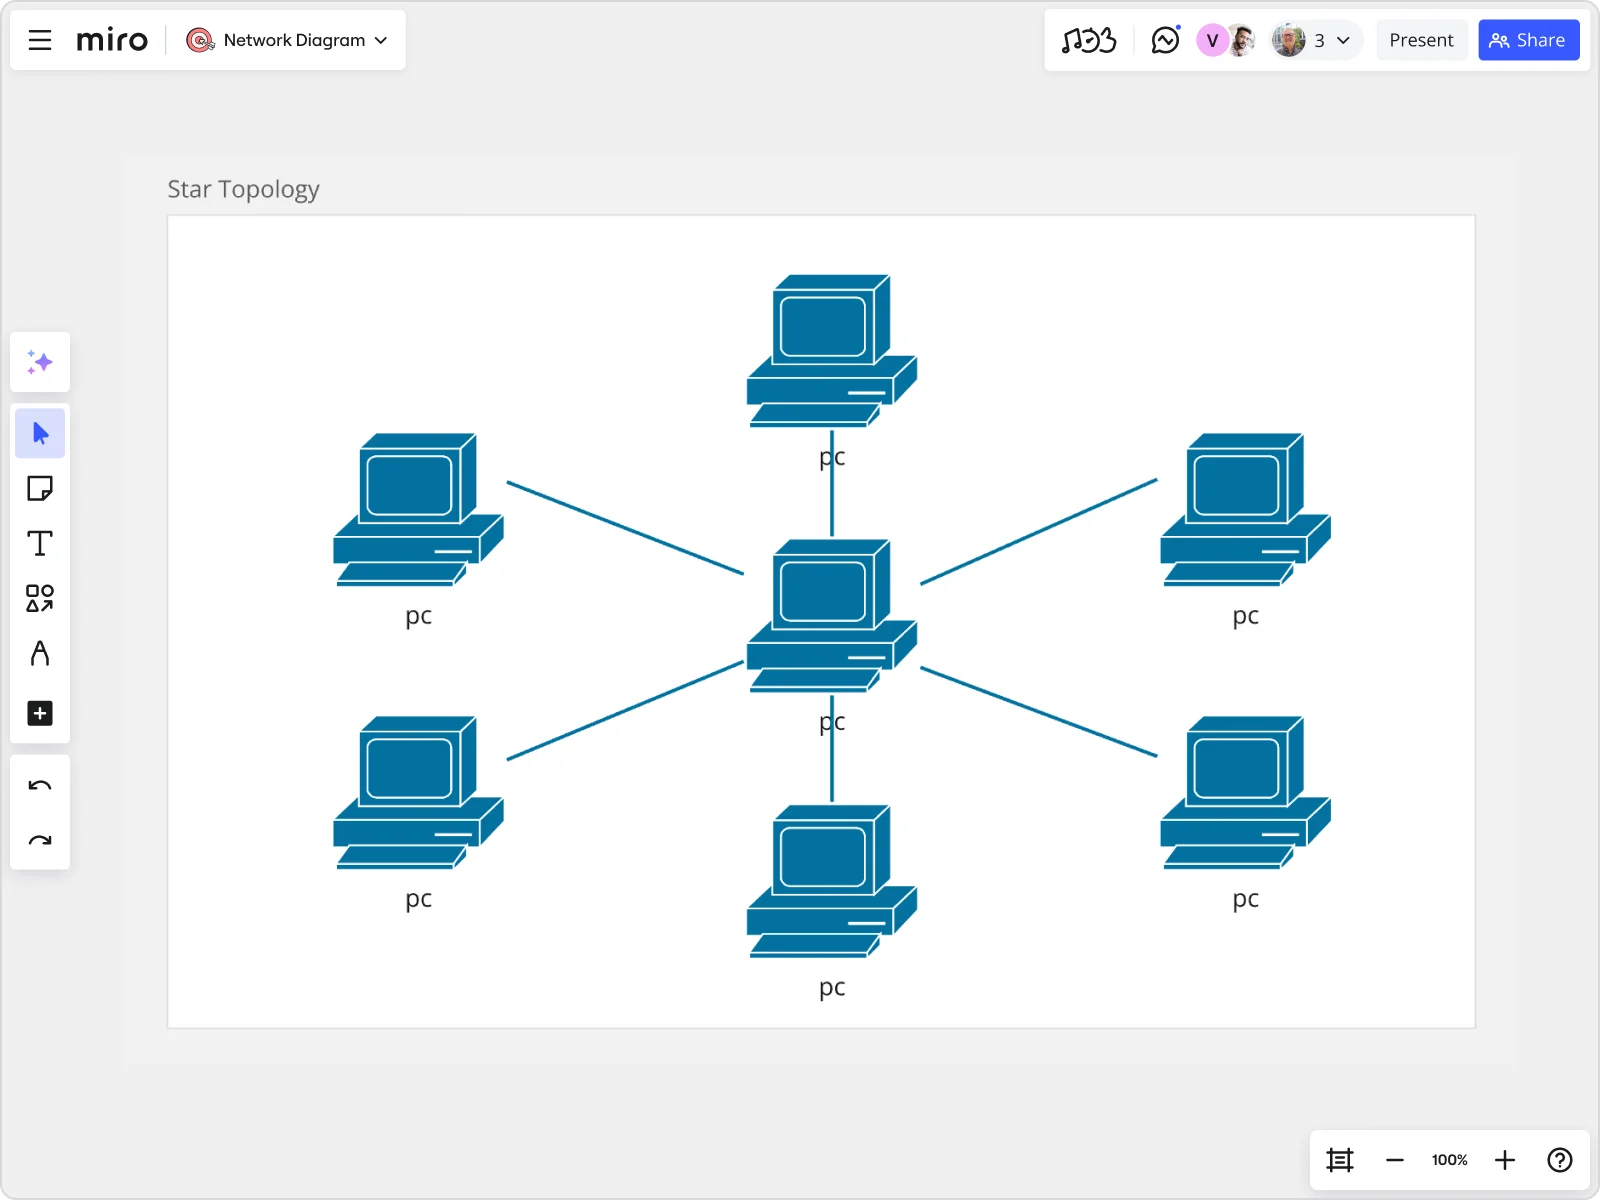
In a star topology, devices are connected to a central hub. This setup is easy to manage and expand but can be expensive due to the hub's importance. If the central hub fails, the entire network goes offline. However, individual device failures don't affect the rest of the network, making troubleshooting easier.
Ring topology
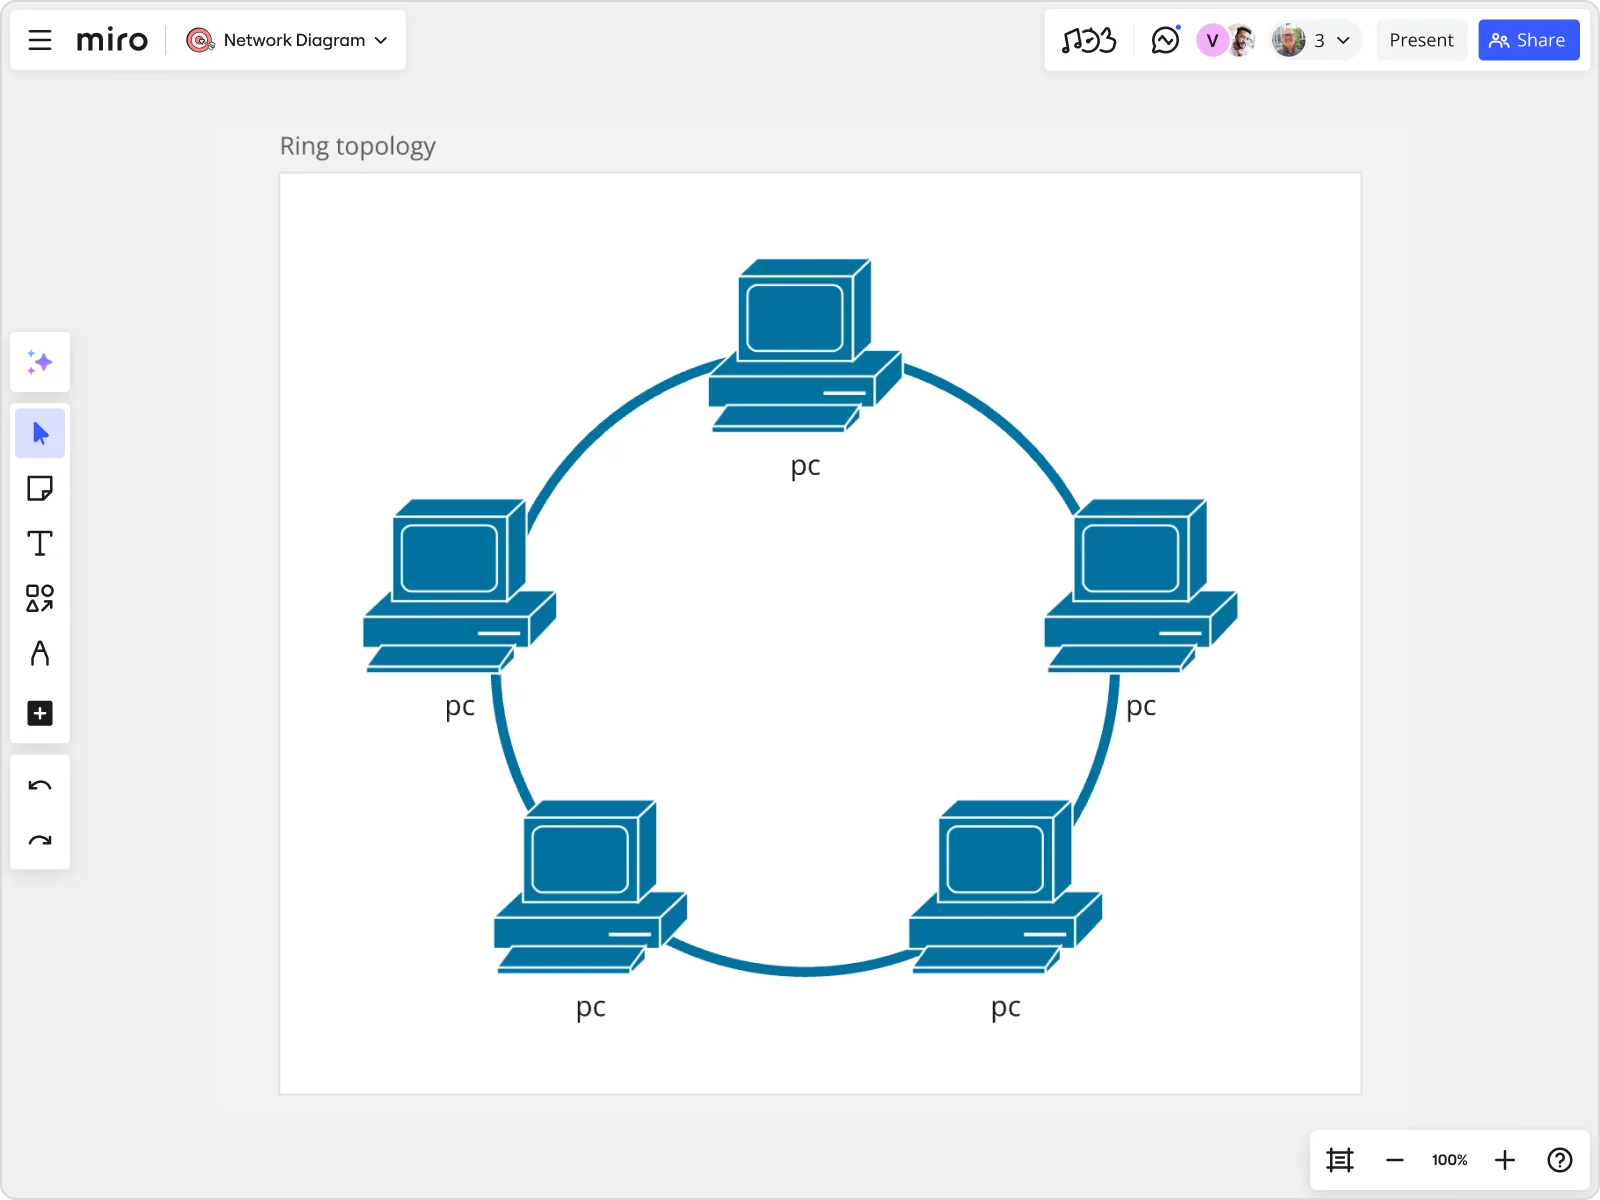
In a ring topology, devices are connected in a circular fashion. Data travels in one direction, reducing collisions but making the network vulnerable to a single point of failure. If one device or connection fails, it can disrupt the entire network. However, it can be efficient for networks with predictable data traffic patterns.
Mesh topology
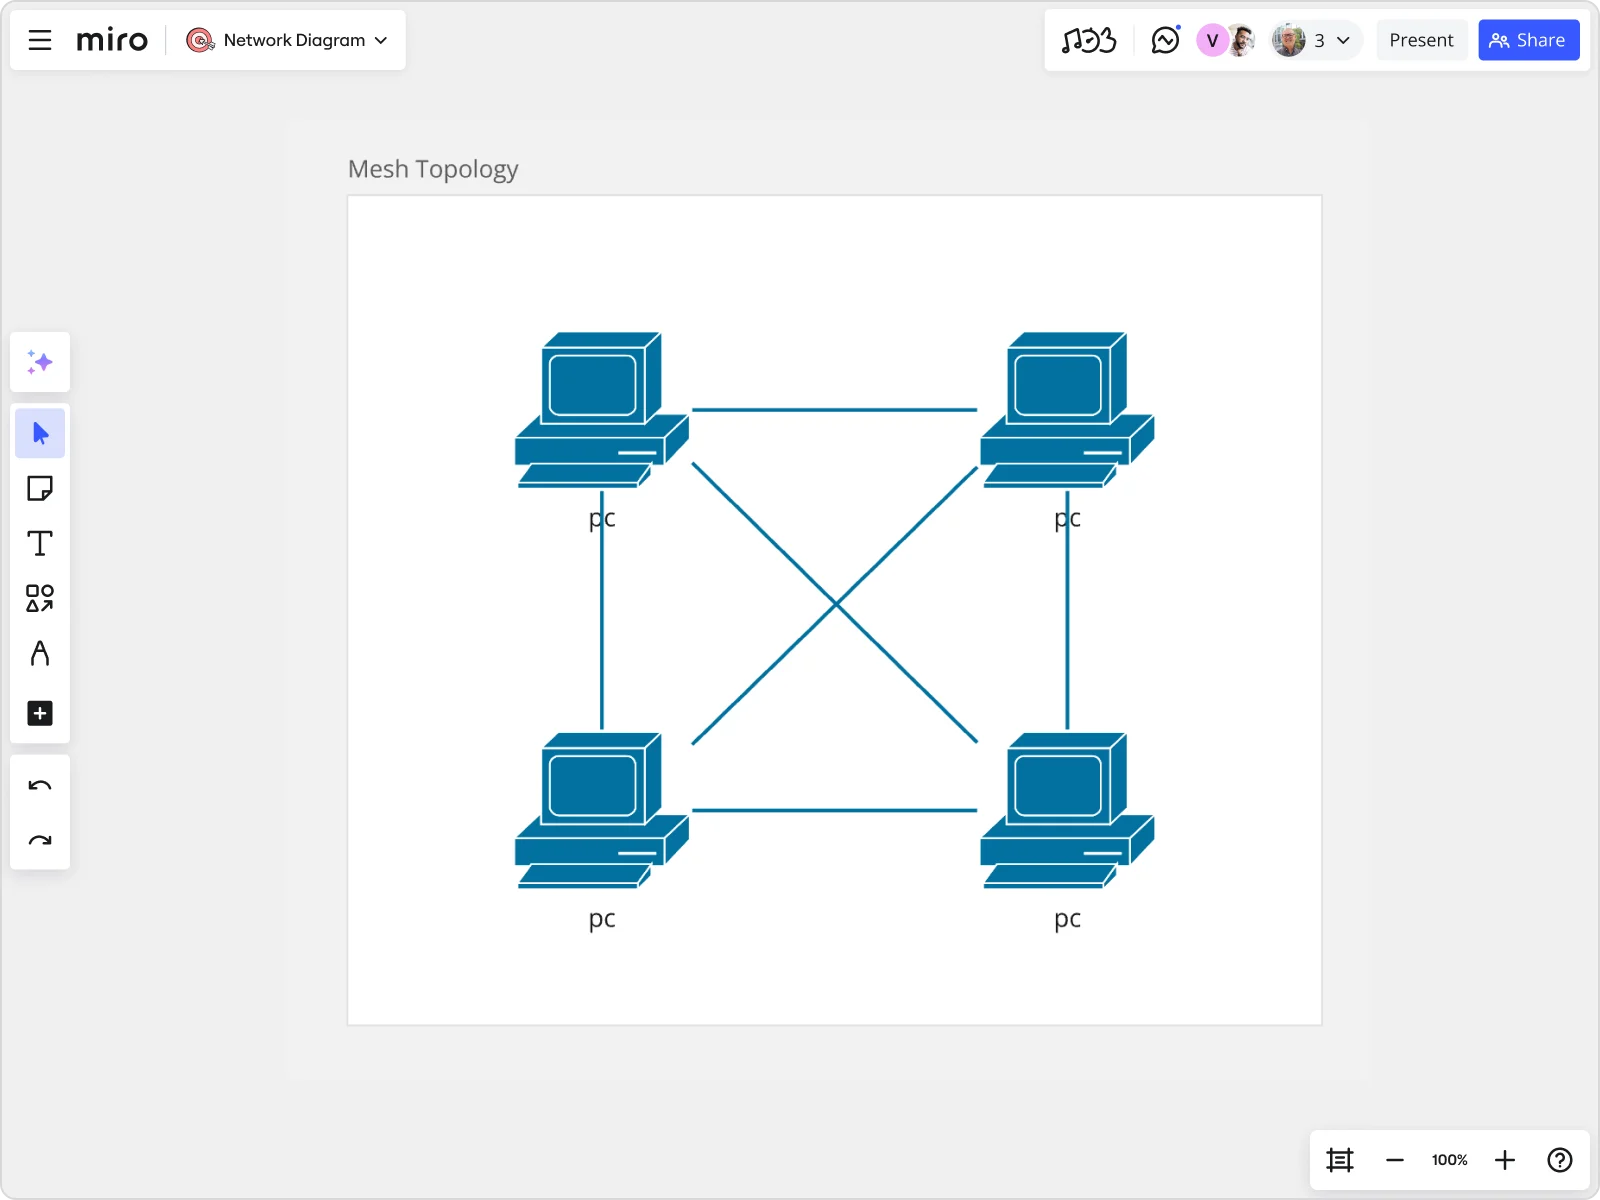
In a mesh topology, devices are interconnected, providing high redundancy and reliability but at a higher cost and complexity. Each device connects to multiple others, creating multiple paths for data to travel. This ensures that even if one path fails, data can take an alternative route. Mesh topologies are ideal for networks where reliability is critical.
Hybrid topology
A hybrid topology combines elements of different topologies to suit specific needs, offering flexibility and scalability. For example, a network might use a star topology for its core structure and a bus topology for connecting peripheral devices. This approach allows teams to leverage the strengths of multiple topologies while mitigating their weaknesses.
Benefits of using network topology diagrams
Why should you invest time and effort into creating network topology diagrams? The benefits are numerous and can significantly enhance your team's efficiency and effectiveness.
Enhanced clarity
Visualizing complex networks makes it easier to understand and manage them. Network topology diagrams break down intricate structures into comprehensible visual representations, allowing team members to grasp the network's layout quickly. This clarity is crucial for effective network management and decision-making.
Improved troubleshooting
Quickly identify and resolve network issues by pinpointing problematic areas. With a network topology diagram, teams can trace connections, identify faulty components, and understand how issues in one part of the network affect others. This accelerates the troubleshooting process and minimizes downtime.
Efficient planning
Plan network expansions and upgrades more effectively with a clear view of the current layout. Network topology diagrams provide a visual roadmap for adding new devices, upgrading existing ones, and reconfiguring connections. This foresight helps avoid potential conflicts and ensures seamless integration of new components.
Better collaboration
Share diagrams with team members to ensure everyone is on the same page. Network topology diagrams serve as a common reference point, facilitating communication and collaboration among team members. Whether you're discussing changes with IT staff or presenting to stakeholders, these diagrams help convey complex information clearly and concisely.
Consistency
Maintain a uniform approach to network design and documentation across projects. By using standardized symbols and notations, network topology diagrams ensure consistency in how networks are documented and understood. This uniformity is crucial when multiple teams or team members work on the same network over time.
Creating your own network topology diagram with Miro
Ready to create your network topology diagram? Miro has you covered. With powerful features, you can craft detailed and professional network diagrams effortlessly.
To create a network topology diagram, you can follow these steps:
- Start with a template: Use one of Miro's network topology diagram templates as a starting point. These templates are designed to provide a basic structure, which you can then customize according to your specific requirements.
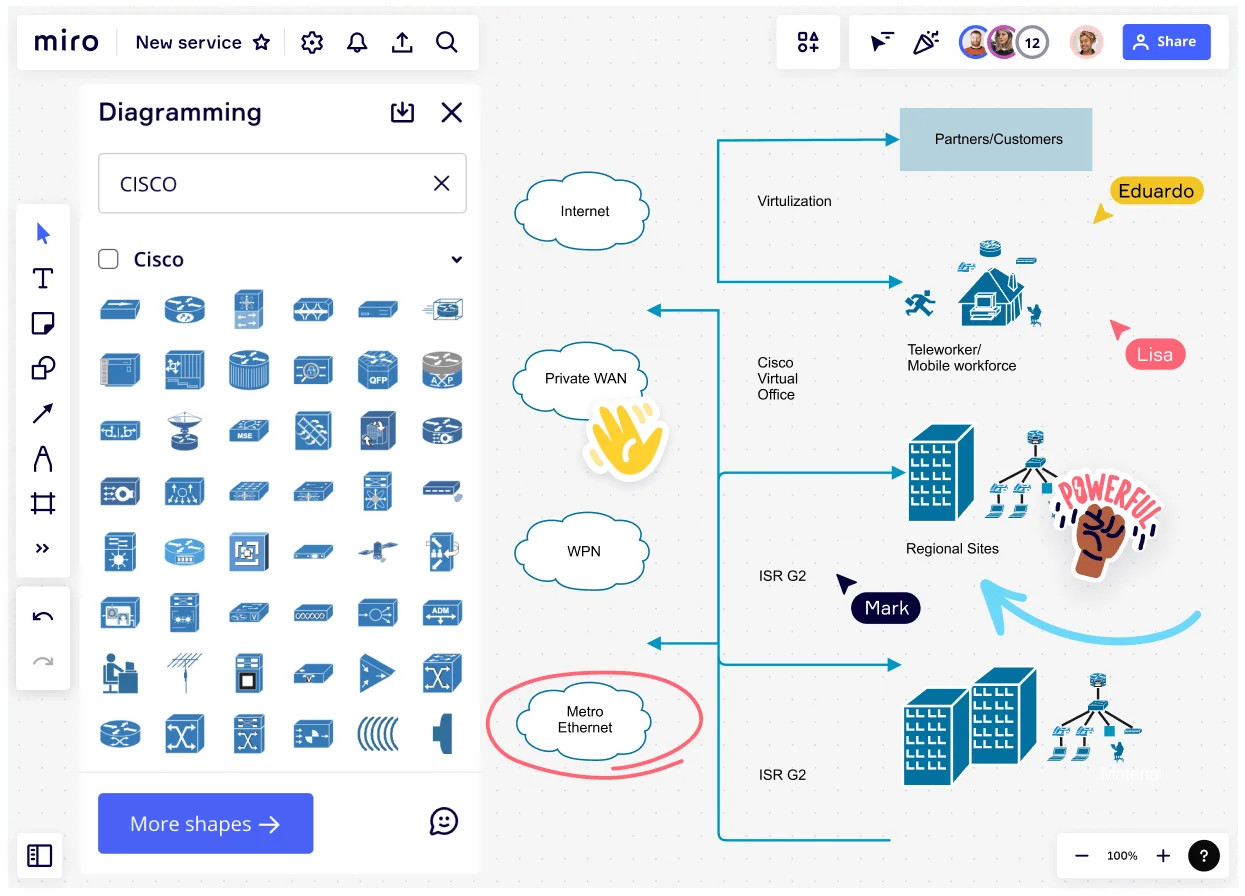
- Custom shapes pack and icons: Use Miro’s shape packs and icons, which are specifically tailored for network diagrams. These include icons for routers, switches, nodes, and other network components, which help create a detailed and accurate representation of your network.
- Real time collaboration: Invite your team members to collaborate on the diagram in real time. Miro’s platform supports multiple users working on the same diagram simultaneously, which is especially useful for teams distributed across different locations.
- Integration and data importation: If you have existing data that needs to be visualized, Miro allows you to integrate with various data sources. You can import this data directly into Miro and use it to automatically generate or update network diagrams.
- Customization and scalability: As your network topology evolves, Miro’s flexible tools allow you to update and scale your diagrams. You can add, remove, or modify elements within your diagram to reflect changes in your network’s structure.
- Consistency and standards: To maintain consistency across your diagrams, use Miro’s tools and templates that ensure all diagrams adhere to the same standards and formats. This is crucial for keeping diagrams readable and understandable across different teams and stakeholders.
By following these steps, you can effectively use Miro to create detailed and collaborative network topology diagrams that meet your projects' needs.
Diagramming best practices
Creating effective network topology diagrams requires more than just knowing the symbols and topologies. Following best practices ensures your diagrams are clear, accurate, and useful.
Introduction to diagramming practices
Diagramming practices are essential for producing high-quality network topology diagrams. By adhering to established guidelines, you can create diagrams that are not only visually appealing but also functional and easy to understand. These practices help maintain consistency, improve communication, and enhance the overall effectiveness of your diagrams.
Keep it simple
Avoid overcrowding your diagram with too much information. Focus on clarity and readability. Simplifying your diagrams ensures that viewers can quickly understand the network's structure without being overwhelmed by unnecessary details. Use a clean layout and avoid excessive crossing of lines.
Use consistent symbols
Stick to standard symbols and notations to ensure your diagrams are easily understood by others. Consistency in symbols helps prevent confusion and ensures that anyone familiar with network topology diagrams can interpret your work correctly. Refer to established standards and guidelines for symbol usage.
Label clearly
Clearly label all components and connections to avoid confusion. Accurate labeling provides context and ensures that viewers understand what each element represents. Use descriptive names for devices and connections, and consider adding annotations to explain complex or unique configurations.
Regular updates
Keep your diagrams up-to-date to reflect any changes in your network. Networks are dynamic, and your diagrams should be too. Regularly review and update your diagrams to ensure they accurately represent the current state of the network. This practice helps maintain the relevance and usefulness of your documentation.
Collaborate effectively
Use Miro's collaboration features to involve your team in the diagramming process, ensuring everyone has input and access. Collaboration fosters a sense of ownership and ensures that the diagram incorporates diverse perspectives and expertise.
Create network topology diagrams with confidence
With these insights and tips, you're well on your way to mastering network topology diagrams. Whether you're troubleshooting network issues, planning expansions, or simply ensuring your team is aligned, these diagrams are your go-to tool. And with Miro's powerful visual workspace, creating and collaborating on these diagrams has never been easier. Miro's advanced capabilities and collaborative features make it the ideal tool for all your diagramming needs. So, why wait? Start diagramming with Miro today and see the difference it makes!
Author: Miro Team
Last update: October 9, 2025