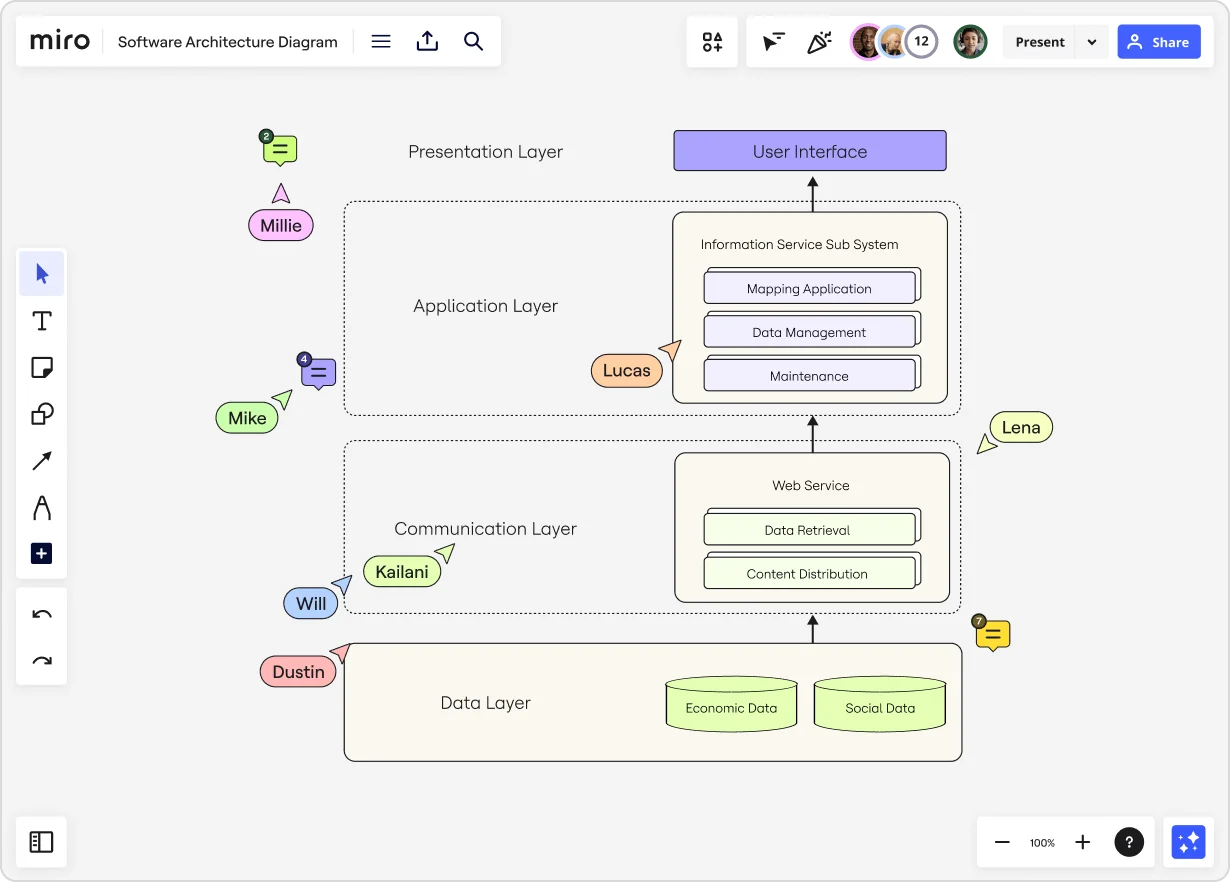
Whether a developer is maintaining an existing product or building a new one, they’re likely not doing it in a silo. From teammates to designers and product managers, there can be many stakeholders for even just a small feature change. That’s why it’s so important to have a software architecture diagram: a source of truth that outlines your software’s structure and the relationship between its different components.
This high-level overview makes it easier for everyone involved — especially the non-coders in the room — to understand and speak to the project, stay aligned on goals, and contribute meaningfully.
What is a software architecture diagram?
There’s a wide assortment of software architecture diagrams for different purposes, each with varying detail levels. But in general, a software architecture diagram will include the following elements:
-
Components: Building blocks of the software system representing the various modules, classes, services, or layers.
-
Relationships: Lines or arrows that indicate how the components interact or communicate with each other.
-
External systems: Entities outside the software that interact with the system, such as APIs, databases, or third-party services.
-
Interfaces: Define the “rules” for how one component will provide or consume information from another.
- Boundaries: Sort related components into groups and distinguish between the subsystems within the architecture (for example, presentation layer, application layer, communication layer, etc.)

Anyone from a software architect or developer to a project manager or product owner can take the lead on building a software architecture diagram. However, these diagrams are the most accurate and helpful when they’re built collaboratively.
What are the benefits of software architecture diagrams?
The biggest benefit of this type of diagram is that it boosts clarity and understanding, creating a high-level overview that simplifies even the most complex concepts. It also makes it easier to communicate with other stakeholders and team members who might have less technical knowledge of how the software works.
With that in mind, these diagrams offer value at all stages of software development and maintenance — not just during planning. Here’s a quick look at how architecture diagrams are helpful at each stage of the process:
Before software development
-
Planning and design: Diagrams define the high-level structure of the system and guide the development process.
- Requirements analysis: Diagrams map out how the software system will meet defined requirements and what components are needed to make that happen.
During software development
-
Improvement and refinement: Diagrams can be revisited throughout the development process to iterate and make updates based on insights, feedback, or changes in requirements.
-
Communication: Diagrams are often used to communicate design choices, interfaces, and interactions on the development team and with other stakeholders.
- Testing: Diagrams are a valuable reference point during testing to ensure the system matches the intended architecture. They also help teams quickly spot areas that need more testing or changes.
After software development
-
Documentation: Diagrams can be saved as part of the system’s documentation so they can be referenced for ongoing maintenance.
- Review: Diagrams should be reviewed during a team retrospective to evaluate the architecture’s effectiveness. Teams should then use those insights to improve future architecture designs.
8 types of architecture diagrams (and templates to get started)
Software architecture diagrams are generally grouped into three different categories:
- Structure: Shows the software’s components and their relationships
- Behavior: Shows how those components interact
- Deployment: Shows how software is distributed across devices
Let’s take a closer look at the types of diagrams that fall in each of these categories — along with architecture diagram templates you can use to get started.
Structure diagrams
1. Component diagram
Use this diagram to: Visualize the components and artifacts in a system and the structural relationship between them.
2. Class diagram
Use this diagram to: Display the building blocks of your code, including different parts (classes), what they contain (properties and methods), and how they relate to each other.
Behavior diagrams
3. Sequence diagram
Use this diagram to: Understand the order of events in a sequence, such as what happens when a user logs into your application.
4. Activity diagram
Use this diagram to: Show the flow of tasks or processes in the system to see how things happen step-by-step, including decision points and parallel processes.
5. State diagram
Use this diagram: The software transitions between various states in response to events like user login, logout, or lockout. This diagram illustrates these states and the transitions between them.
The software transitions between various states in response to events like user login, logout, or lockout. This diagram illustrates these states and the transitions between them.
6. Use case diagram
Use this diagram to: Visualize how your users interact with your software so you can get a deeper understanding of user requirements and build your software accordingly.
7. Data flow diagram
Use this diagram to: See how data moves through the system, including where it comes from, how it changes over time, and where it ends up.
Deployment diagrams
8. Deployment diagram
Use this diagram to: Understand how the software is set up on different hardware devices and how those devices interact with each other.
Discover more architecture diagram examples to streamline your team efforts.
Simplify your software architecture diagram with Miro
Building and maintaining software is complex and teams must develop a shared understanding of how the system works.
That’s a lot easier with a software architecture diagram, which can boost clarity, simplify communication, and unite your team in creating a winning final product.


