Table of contents
Table of contents
10 Agile metrics that’ll boost your team’s productivity

Summary
In this guide, you will learn:
- 10 key Agile metrics that boost team productivity: velocity, cycle time, work in progress, sprint burndown, and happiness.
- How velocity measures work completed per sprint for planning and forecasting.
- The importance of cycle time in tracking task completion, identifying delays, and improving predictability.
- How cumulative flow, lead time, throughput, escaped defect rate, and blocked time provide insights into workflow efficiency and quality.
- Ways Miro’s innovation workspace supports Agile teams through metric visualization, collaboration, and integration with tools like Jira and Slack.
- Best practices for using Agile metrics to identify improvement areas, optimize team performance, and align with strategic goals via visual roadmapping and data-driven decision-making.
Agile metrics provide the compass for your team's journey, guiding you toward increased productivity.
These metrics offer insights into your team's performance, helping you identify areas for improvement. They're the key to unlocking your team's full potential.
In this article, we'll explore 10 Agile metrics that can boost your team's productivity. We'll also show how Miro, an innovation workspace, can support your team in tracking and leveraging these metrics. Let's dive in.
What are Agile metrics?
Agile metrics are essential tools for teams striving for continuous improvement. They measure various aspects of your development process, providing valuable insights.
These metrics help teams gauge performance, efficiency, and alignment with business objectives. By understanding Agile metrics, product and design teams can enhance decision-making.
Choosing the right metrics is crucial. Each Agile team has unique dynamics, and your metrics should reflect that. These metrics not only help track progress but also foster a culture of transparency and accountability. With proper implementation, they become catalysts for growth and innovation.
Why are Agile metrics important?
For product teams, Agile metrics are more than just numbers. They offer a window into team performance and provide clarity on workflow efficiency.
Metrics guide teams in aligning tasks with strategic goals. They highlight areas needing improvement and drive informed decision-making. This ensures teams focus on delivering value rather than simply ticking off tasks on a list. Using these insights, teams can optimize processes and prioritize work that brings the most significant impact.
Embracing Agile metrics equips product teams to thrive in a competitive landscape. They remain agile, responsive, and highly productive, ultimately enhancing their success.

10 key Agile metrics
Here are 10 important Agile metrics to start using:
1. Velocity
Velocity measures how much work a team completes in a sprint. It helps teams predict future performance and set realistic goals.
To measure Agile velocity effectively:
- Calculate using completed story points per sprint.
- Track consistently over several sprints for accuracy.
- Use as a planning tool, not a strict target.
Velocity offers insights into team capacity, aiding in resource allocation and sprint planning. By understanding velocity trends, teams can make informed adjustments, ensuring they maintain steady progress toward their goals. It becomes a key driver in enhancing both efficiency and output quality.

2. Lead time
Lead time reveals the duration from the start of a project to its completion. It's crucial for understanding the flow of the entire process.
Ways to optimize lead time:
- Identify and eliminate bottlenecks.
- Simplify workflows for efficiency.
- Monitor regularly to track improvements.
Tracking lead time helps teams assess their processes and identify areas needing adjustment. By focusing on reducing lead time, teams can streamline their workflow, ensuring faster deliveries. This metric also aids in setting client expectations and aligning project timelines with business objectives.
3. Cycle time
Cycle time measures the duration to complete a specific task from start to finish. It reflects the team's pace and efficiency on individual tasks.
To refine cycle time:
- Focus on task-level improvements.
- Use daily stand-ups to address delays.
- Employ automation where possible.
Cycle time is vital for evaluating the operational aspects of the team. A shorter cycle time indicates efficient handling of tasks, contributing to quicker project completion. Teams can use this metric to identify slowdowns and make targeted process adjustments, leading to more predictable delivery schedules and enhanced productivity.
4. Burnup and burndown charts
Burnup and burndown charts provide a visual representation of work progress. They illustrate what's completed versus what's left to do, offering a clear overview.
To effectively use these charts:
- Regularly update progress against the baseline.
- Analyze trends to identify bottlenecks.
- Use them to set realistic targets.
These charts are indispensable for tracking a project’s trajectory. While burndown charts focus on remaining work, burnup charts show completed work. Together, they offer comprehensive insights, helping teams adjust plans accordingly, optimize resource allocation, and ensure timely deliveries.
5. Cumulative flow diagram
A cumulative flow diagram (CFD) offers a bird's-eye view of project progress. It highlights the distribution of tasks across various stages of the workflow, showcasing areas of concern.
Key steps to utilize a CFD effectively:
- Ensure data is current for accuracy.
- Look for bottlenecks where lines converge.
- Address issues promptly to maintain flow.
By analyzing a CFD, teams can spot inefficiencies and potential slowdowns early. This allows Agile teams to make informed decisions on reallocating resources, balancing workloads, and ultimately, maintaining steady and productive workflow progress.
6. Work In Progress (WIP) limits
Managing work in progress (WIP) is crucial for avoiding overburdened teams. By setting WIP limits, teams ensure focus on finishing tasks rather than just starting them.
To set effective WIP limits:
- Determine team capacity and adjust as needed.
- Monitor progress to maintain the balance.
- Encourage collaboration to resolve obstacles.
This approach prevents task overload and streamlines workflows. Teams who implement WIP limits often find increased productivity and reduced stress levels. Ultimately, this creates a healthier and more efficient work environment where completion becomes a priority.
7. Throughput
Throughput measures the number of tasks a team completes in a specific time frame. It's a metric that combines both speed and quality.
To leverage throughput effectively:
- Track completed tasks regularly.
- Analyze patterns in work completion rates.
- Align throughput with desired quality standards.
This metric is essential for understanding team capacity and efficiency without compromising quality. Monitoring throughput helps teams identify bottlenecks and adjust workflows accordingly. With this knowledge, teams can optimize performance, ensuring they produce valuable outcomes in a timely manner.
8. Code churn
Code churn measures how often code changes over a period. Frequent modifications might signal instability or lack of clarity.
Consider reducing code churn by:
- Encouraging thorough initial planning.
- Conducting regular code reviews.
- Prioritizing clear documentation.
High code churn can hinder progress and impact team morale. By maintaining stable code, teams can minimize rework and enhance software reliability. Understanding and managing code churn is crucial in maintaining a robust, efficient development process, benefiting both developers and end-users alike.
9. Release burndown — countdown to launch
Release burndown charts track the progress toward a product release. They offer a visual way to monitor remaining work over time.
To effectively use release burndown charts:
- Update the chart regularly for accuracy.
- Communicate with team members about progress.
- Use the chart in retrospectives for insights.
These charts help teams predict release timelines and ensure transparency with stakeholders. By visualizing work dynamics, teams can quickly identify delays and make informed decisions to maintain schedules. Consistent tracking supports a smoother path to successful product launches, promoting confidence and alignment.

10. Defect density
Defect density is vital for assessing software quality. It measures defects per unit of software, often lines of code or function points.
By tracking defect density, teams can:
- Identify areas needing improvement.
- Allocate resources effectively.
- Maintain high software standards.
This metric helps teams focus on reducing bugs early, enhancing user experience and satisfaction. A low defect density indicates better code quality and fewer potential future issues. Regularly measuring defect density ensures teams prioritize quality, leading to more reliable and robust software releases, ultimately boosting trust in the product.
Run Agile team events in Miro
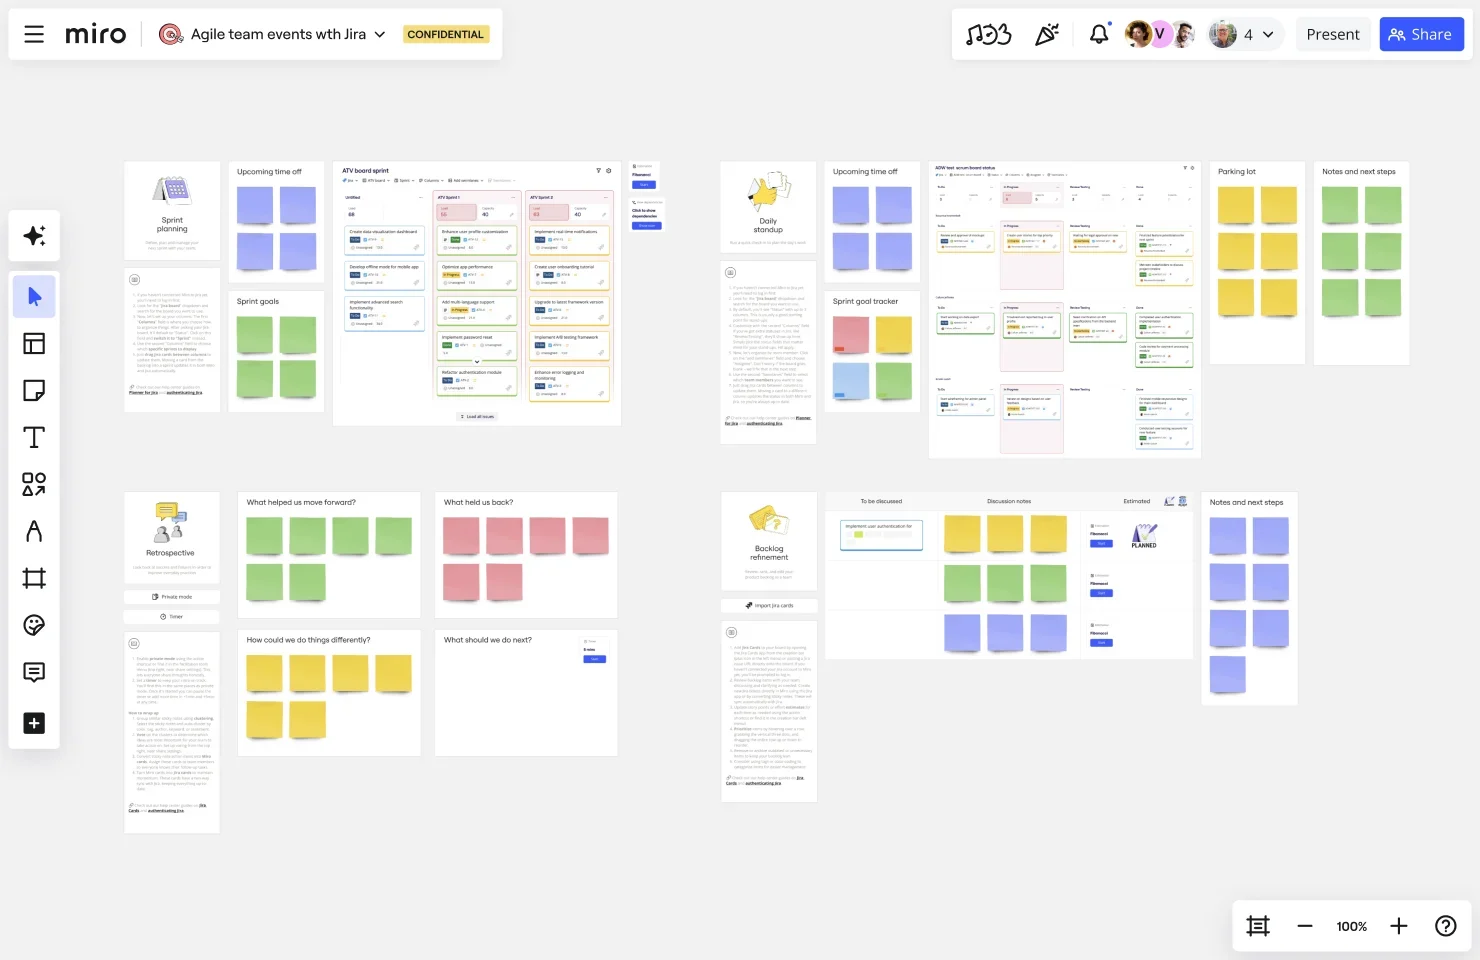
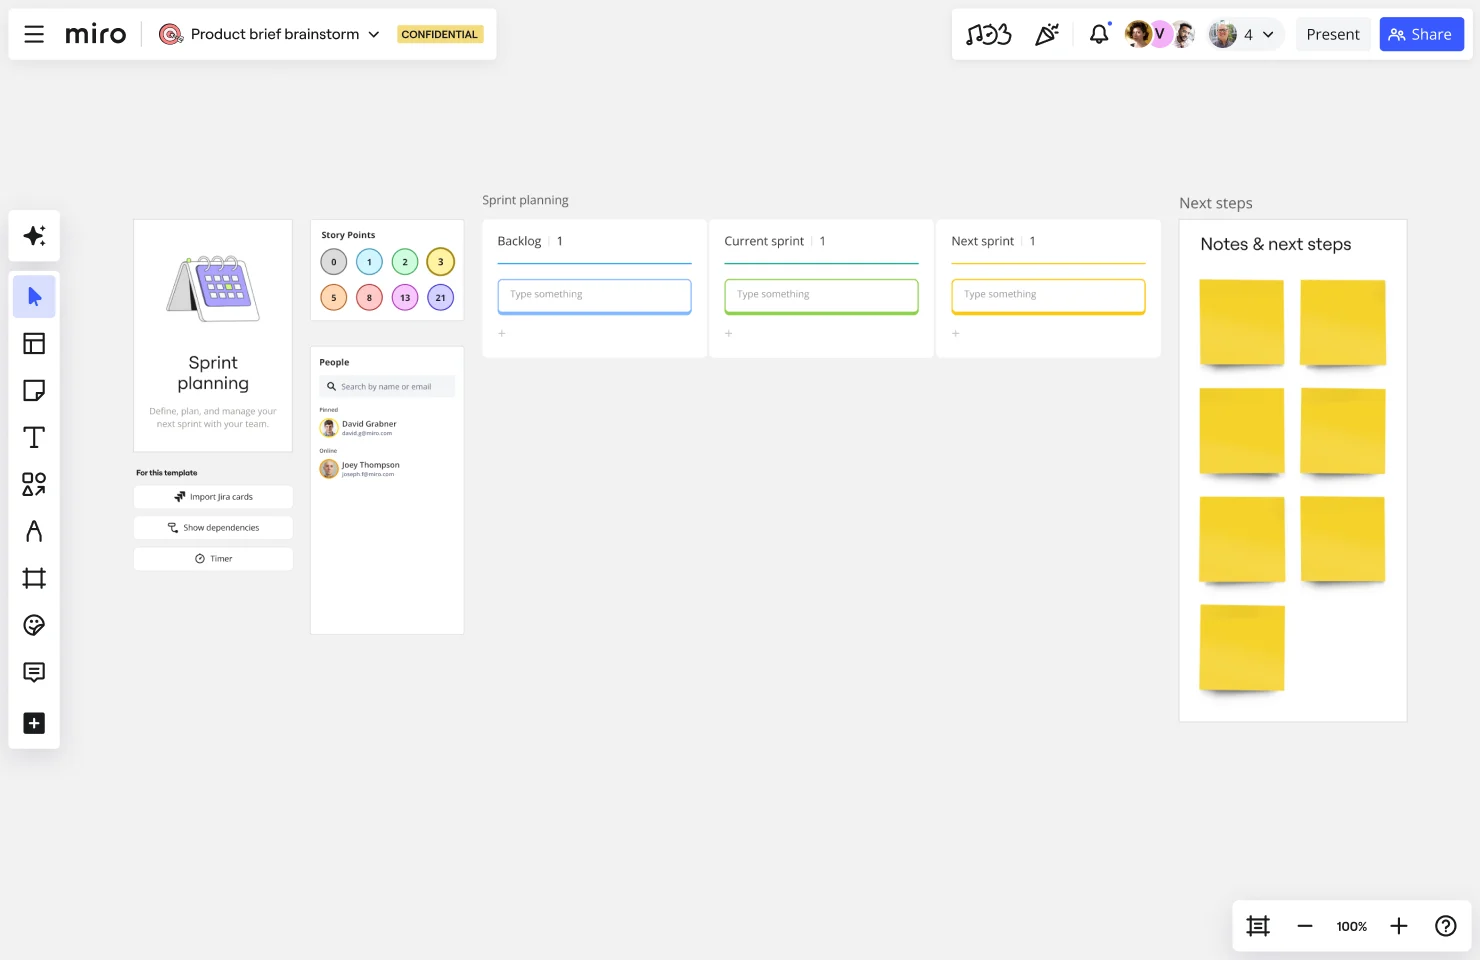
Ready to take your Agile team events to the next level? Miro's intuitive and powerful Agile tools make it easy for teams to come together and create their best work. Seamlessly run everything from Sprint planning to retrospectives — and more.
Sign up to get started.
Author: Miro Team Last update: August 13, 2025