What?
Interface analysis is a technique used to identify, define, and document the interactions and information exchanges between solution components, organizational units, or business processes. This template aids in conducting a thorough interface analysis, ensuring all interactions are clearly defined to prevent issues related to miscommunication, data loss, or integration failures.
Why?
The primary goal of this template is to help business analysts and stakeholders understand and manage the interactions between different solution components or systems. It is particularly useful during the requirements elicitation and analysis phases of a project, as well as when defining the solution scope, designing the system architecture, or implementing integrations between different systems or components.
How?
Brainstorm Exchange
Manual Dataflows:
Users can brainstorm, list and organize all the manual data flows involved in the project or the business. Use the sticky notes to capture each data flow.
Right side of the section is designated for mapping these data flows to corresponding systems or components using arrows to indicate direction and flow.
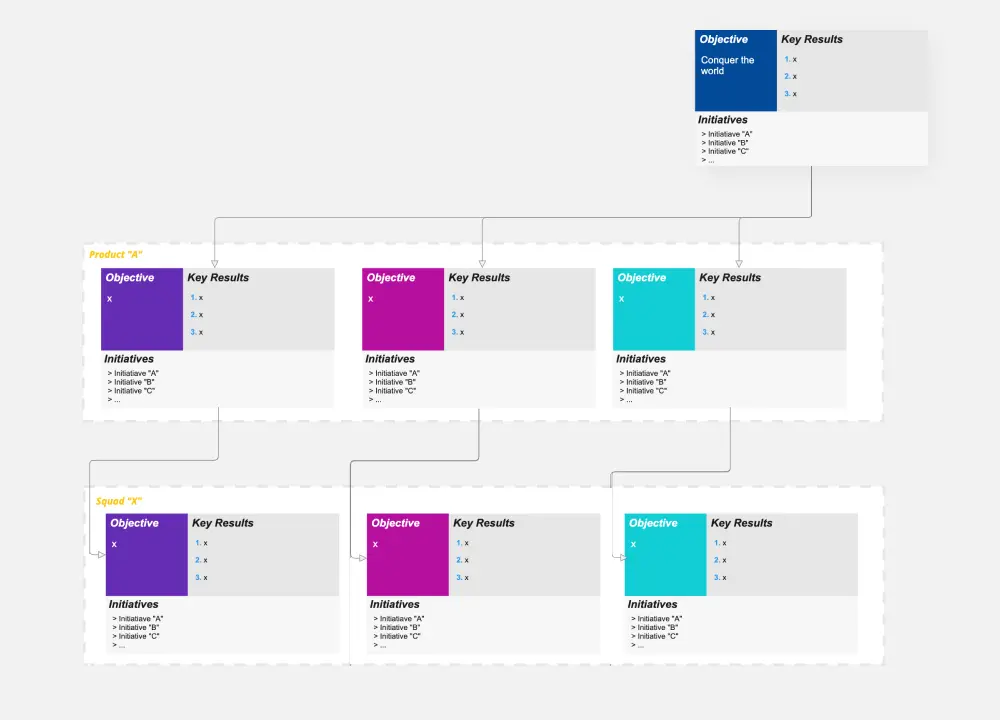
Stakeholders:
The Interface Analysis
Provides a detailed example of how an interface connects different solution components (e.g., User Interface, REST API Customer Portal, CRM System).
This section is useful to illustrate a specific interaction and the data exchanged between components.
Includes a step-by-step process flow with clear input and output details.
Brainstorm other Interfaces
Users can document additional interfaces that are needed, or note down other interfaces.
Each interface can show the name, data exchanged, and exchange frequency for quick reference, but the fields can be changed.
Step by Step Instruction
Identify Dataflows: Begin by listing all manual dataflows and stakeholders. Use the left section of the board for sticky notes.
Map Interactions: Use the right section of the Manual Dataflows and Stakeholders to map interactions, drawing arrows to show the flow of information.
Example Analysis: Refer to the Example Case section to understand how to document interactions. Use this as a guide for documenting your interfaces.
Document Other Interfaces: In the Other Interfaces section, systematically document all additional interfaces involved in your project, ensuring comprehensive coverage.
Benefits:
Ensures all interactions are clearly defined and documented.
Helps prevent issues related to miscommunication, data loss, or integration failures.
Facilitates smooth and efficient information flow between different parts of the solution.
Provides a clear, visual representation of interactions for better understanding and management.