An AI-powered tree diagram maker for every project
Create tree diagrams faster with AI-powered ideation
Why Miro is the best tree diagram creator
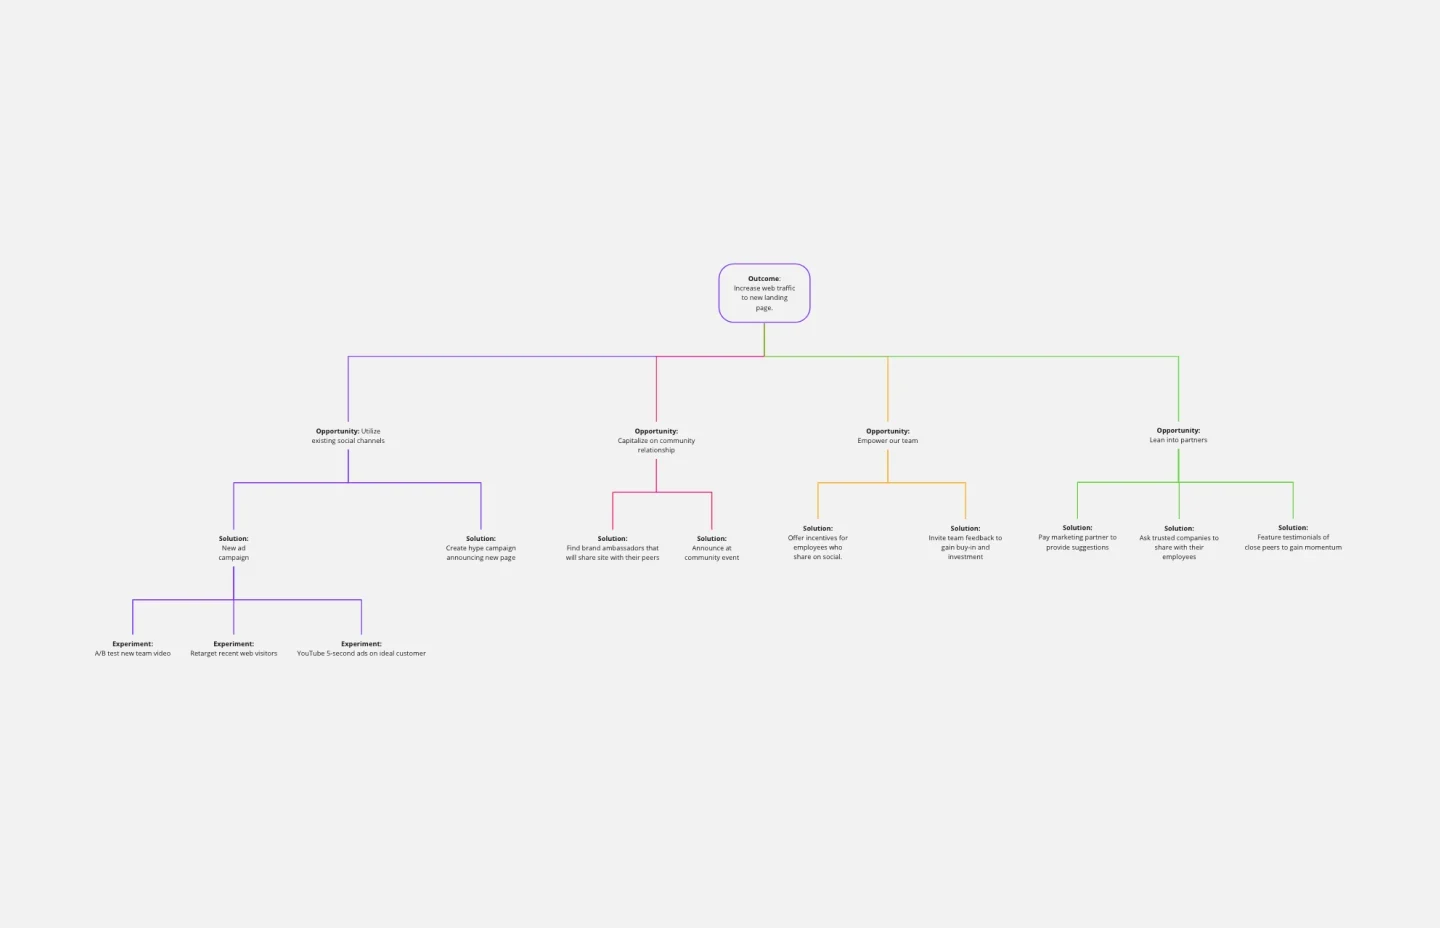
Quick diagramming with intelligent assistance
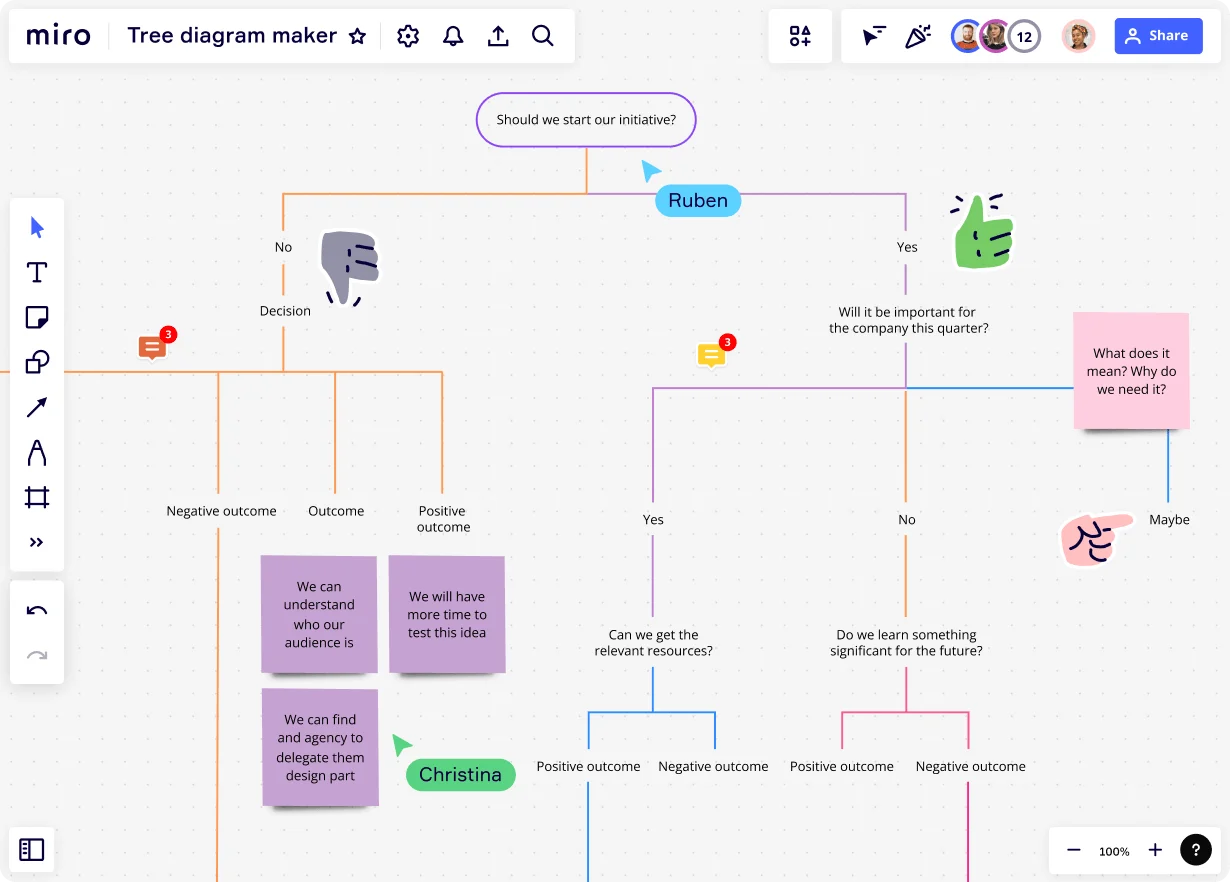
Bring clarity to complexity. Miro's tree diagram maker combines AI-powered brainstorming with automated diagramming features to help you generate ideas and plot hierarchical structures in just a few clicks. Use Create with AI to brainstorm comprehensive lists of elements, then organize them into professional tree diagrams using our smart templates.
Be presentation-ready
Miro's tree diagram maker ensures your work is always presentation-ready. Use Presentation mode when aligning with stakeholders and get your point across with impact using clear, well-designed AI tree diagrams that communicate complex relationships at a glance.
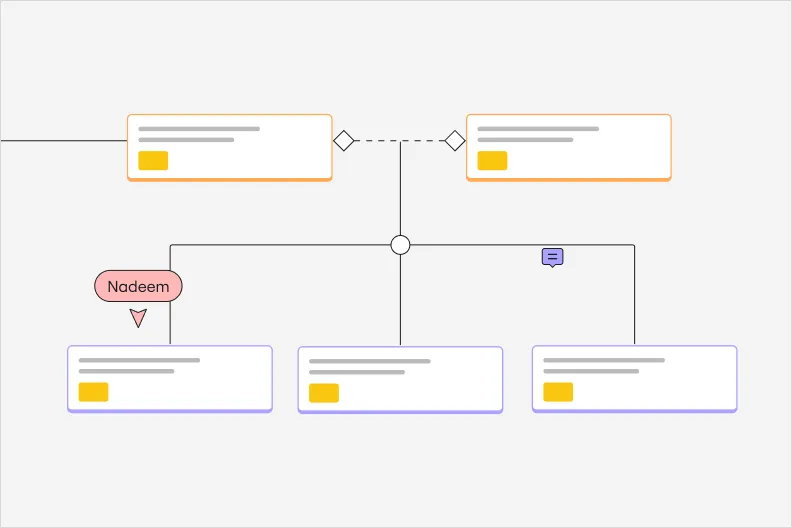
Infinite canvas
Unleash your creativity and expand your ideas as far as you want with Miro's tree diagram maker. The board is limitless, so you never run out of space when expanding topics and ideas. Build comprehensive project hubs where your tree diagram sits alongside process maps, timelines, and strategy frameworks.
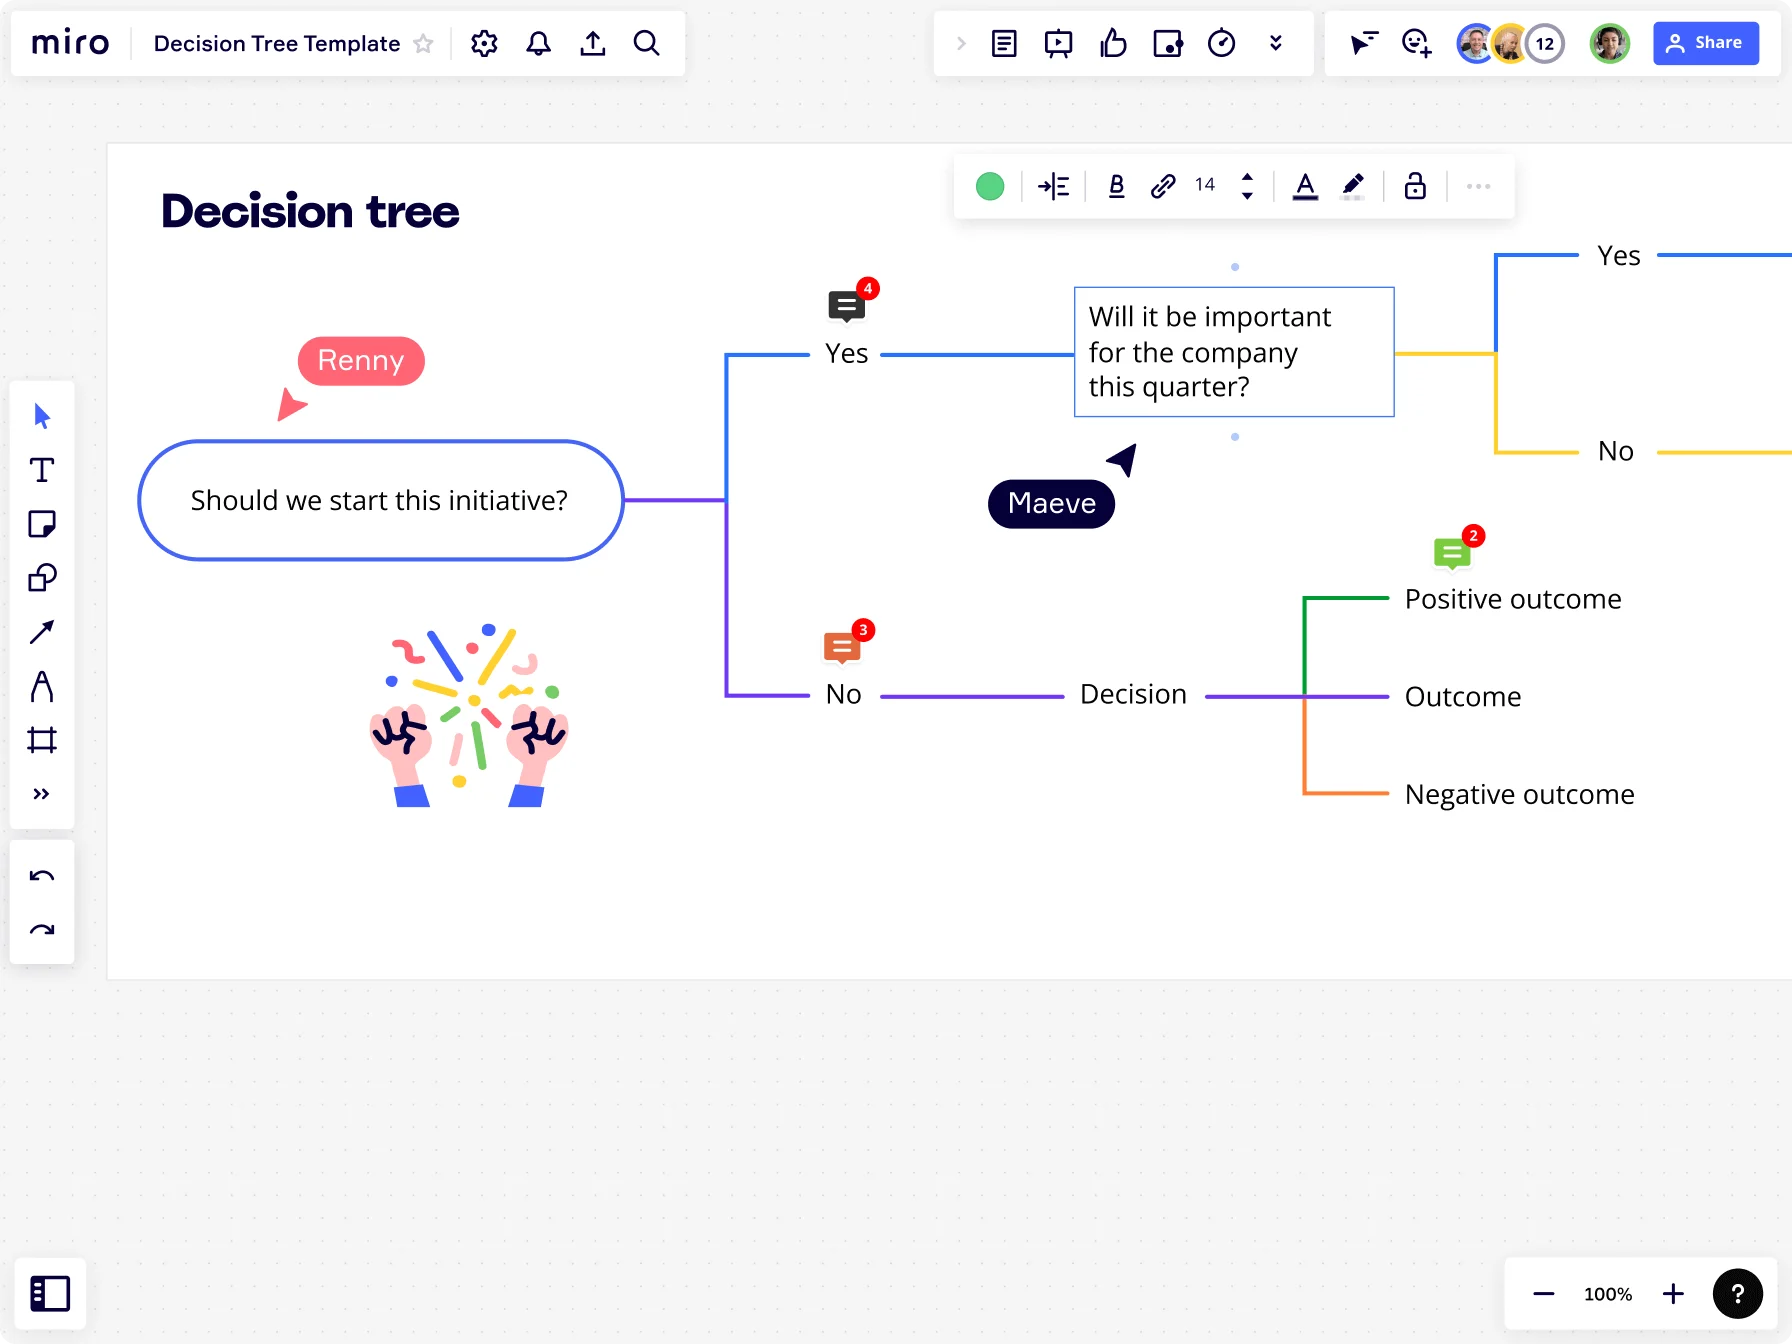
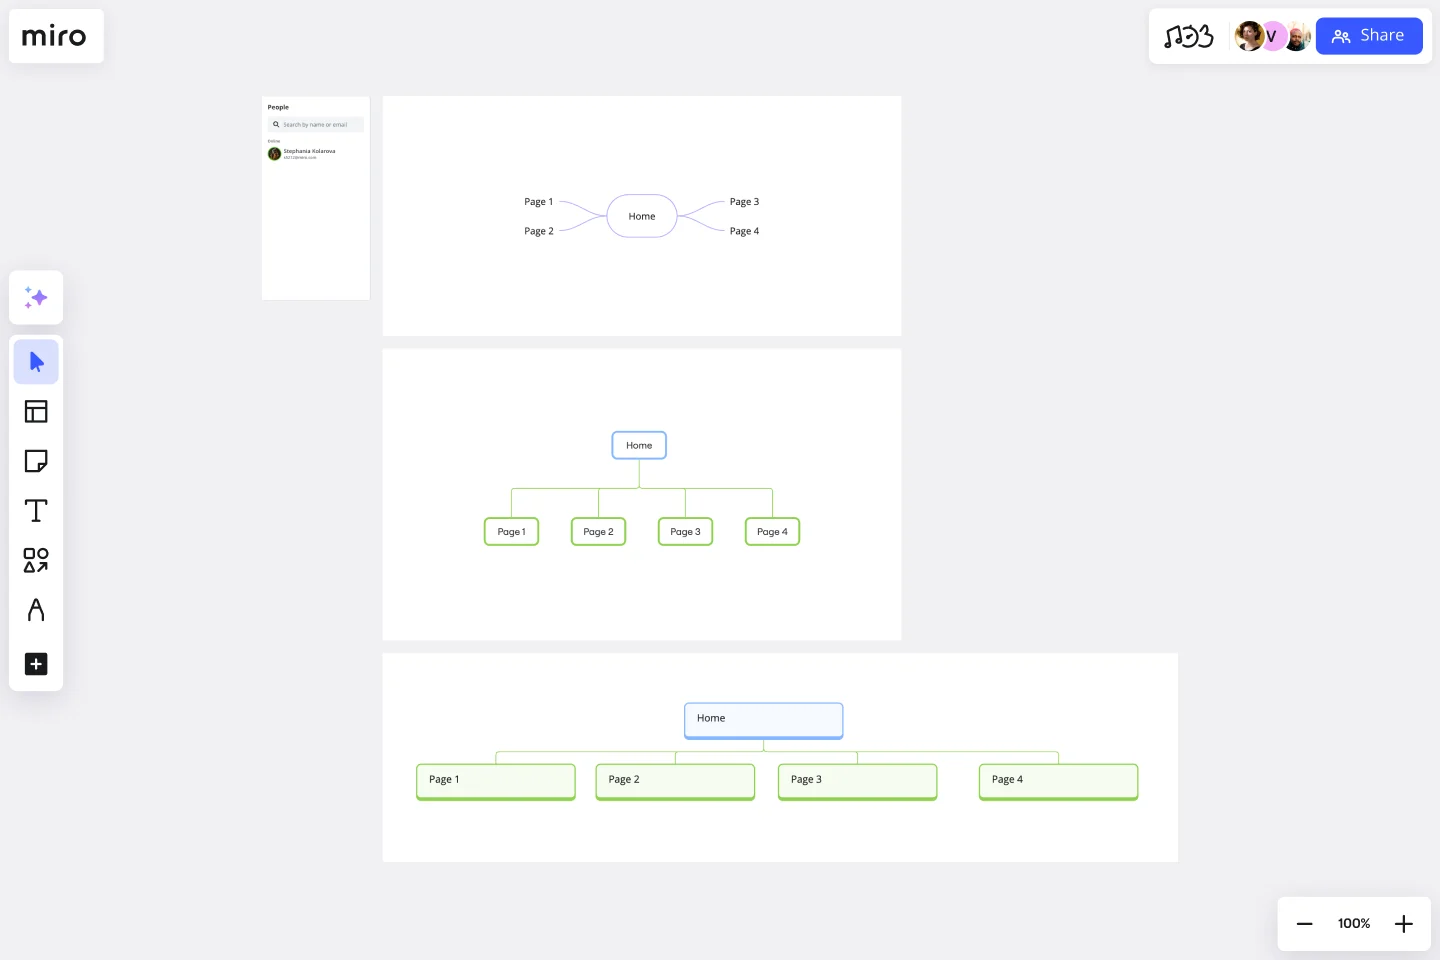
Make it yours
With Miro's robust editing tools, every branch on your tree diagram is customizable. Adjust every detail, from colors and shapes to text sizes, to fit your project needs. Our tree maker gives you the flexibility to match your brand style while maintaining professional hierarchy structures.
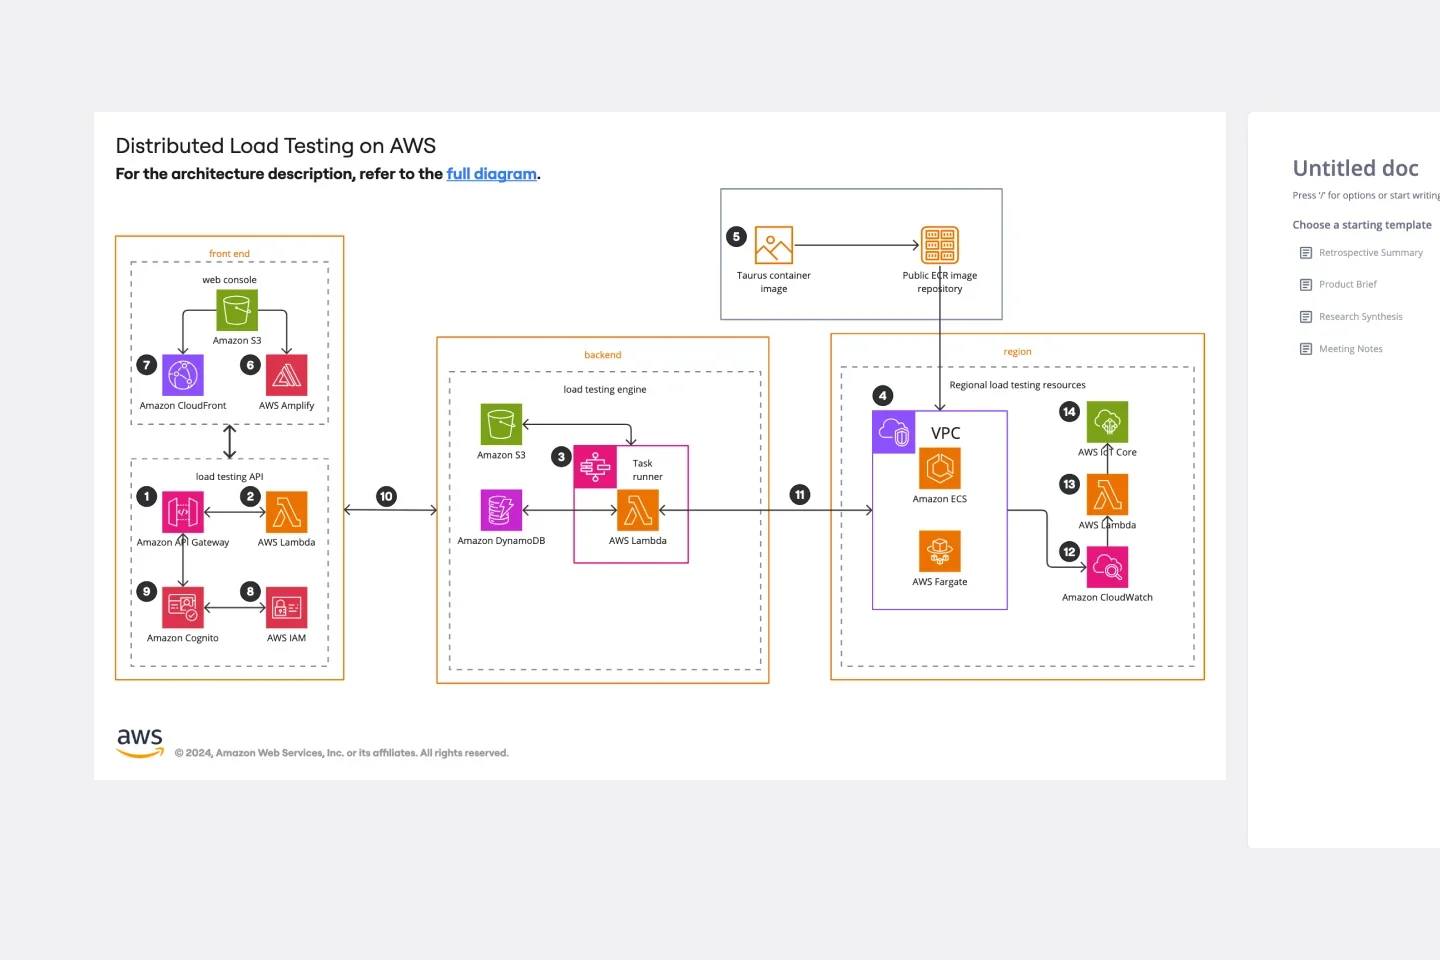
Board-as-prompt intelligence
Transform any content on your Miro board into rich tree diagram insights. Use existing meeting notes, project requirements, or research findings as prompts for AI-generated organizational structures, creating a complete workspace where all your planning elements connect and inform each other.
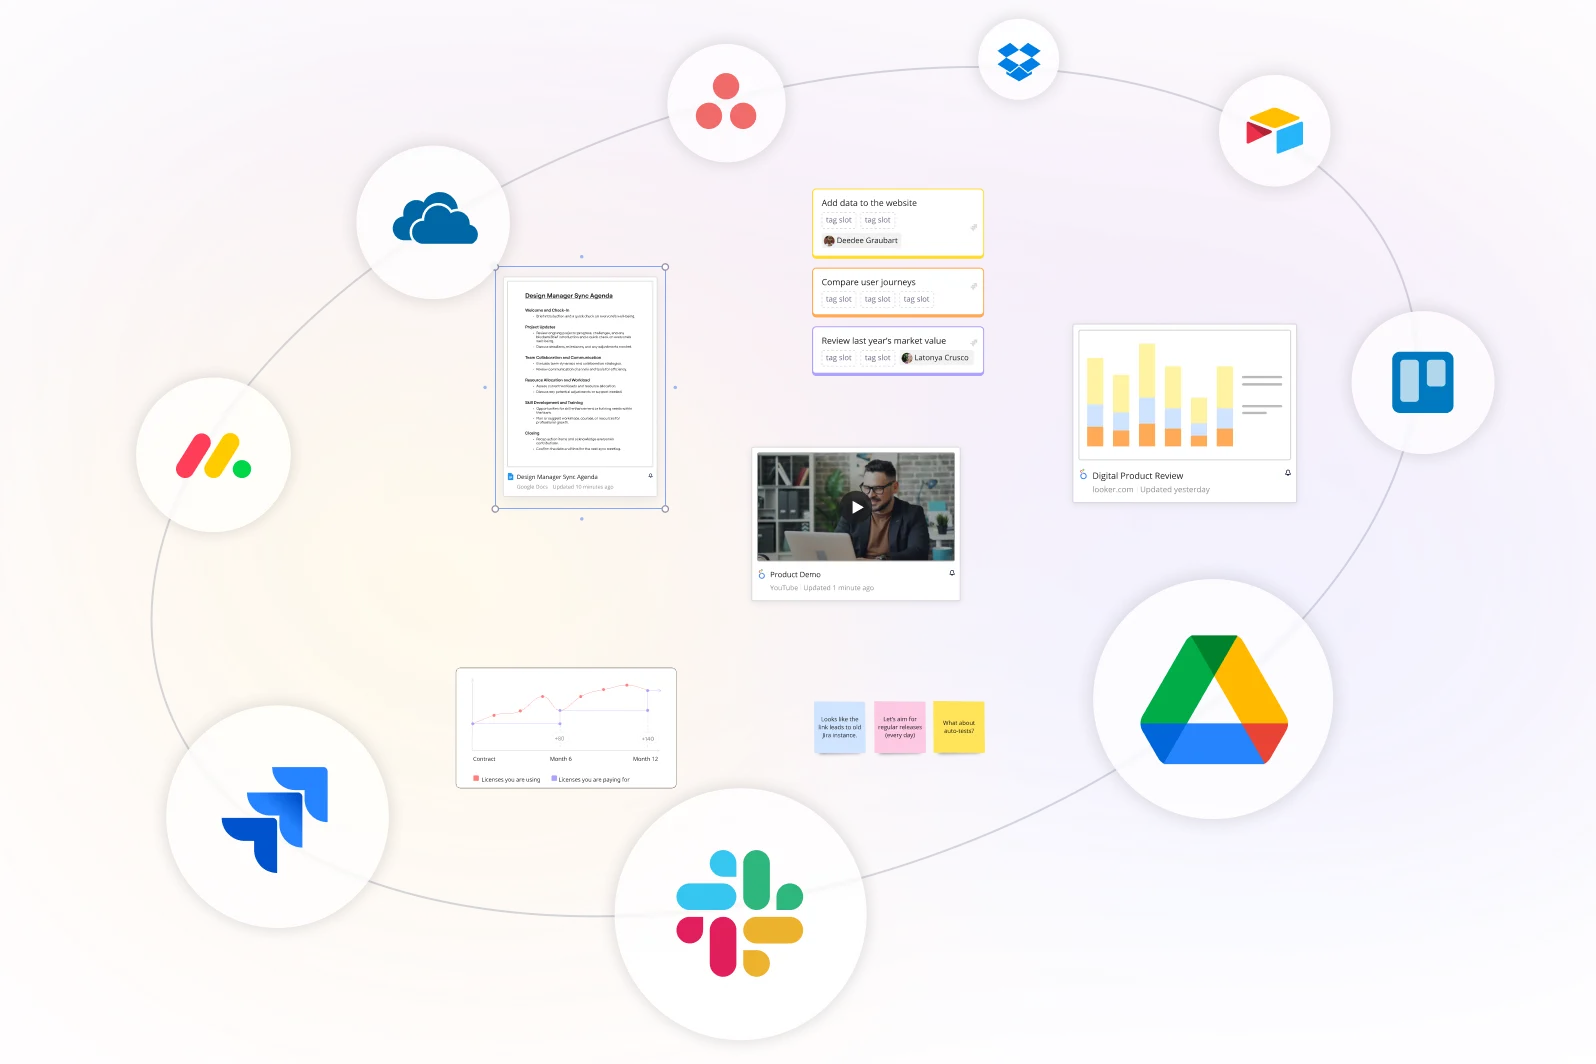
Seamlessly integrated with your workflow
Connect your tree diagrams with the project management and collaboration tools your team already uses. Export structures to documentation systems, share decision trees in stakeholder presentations, or embed organizational charts in team onboarding materials—ensuring your visual hierarchies flow naturally into existing processes and systems.
Integrated with your favorite tools
Related templates

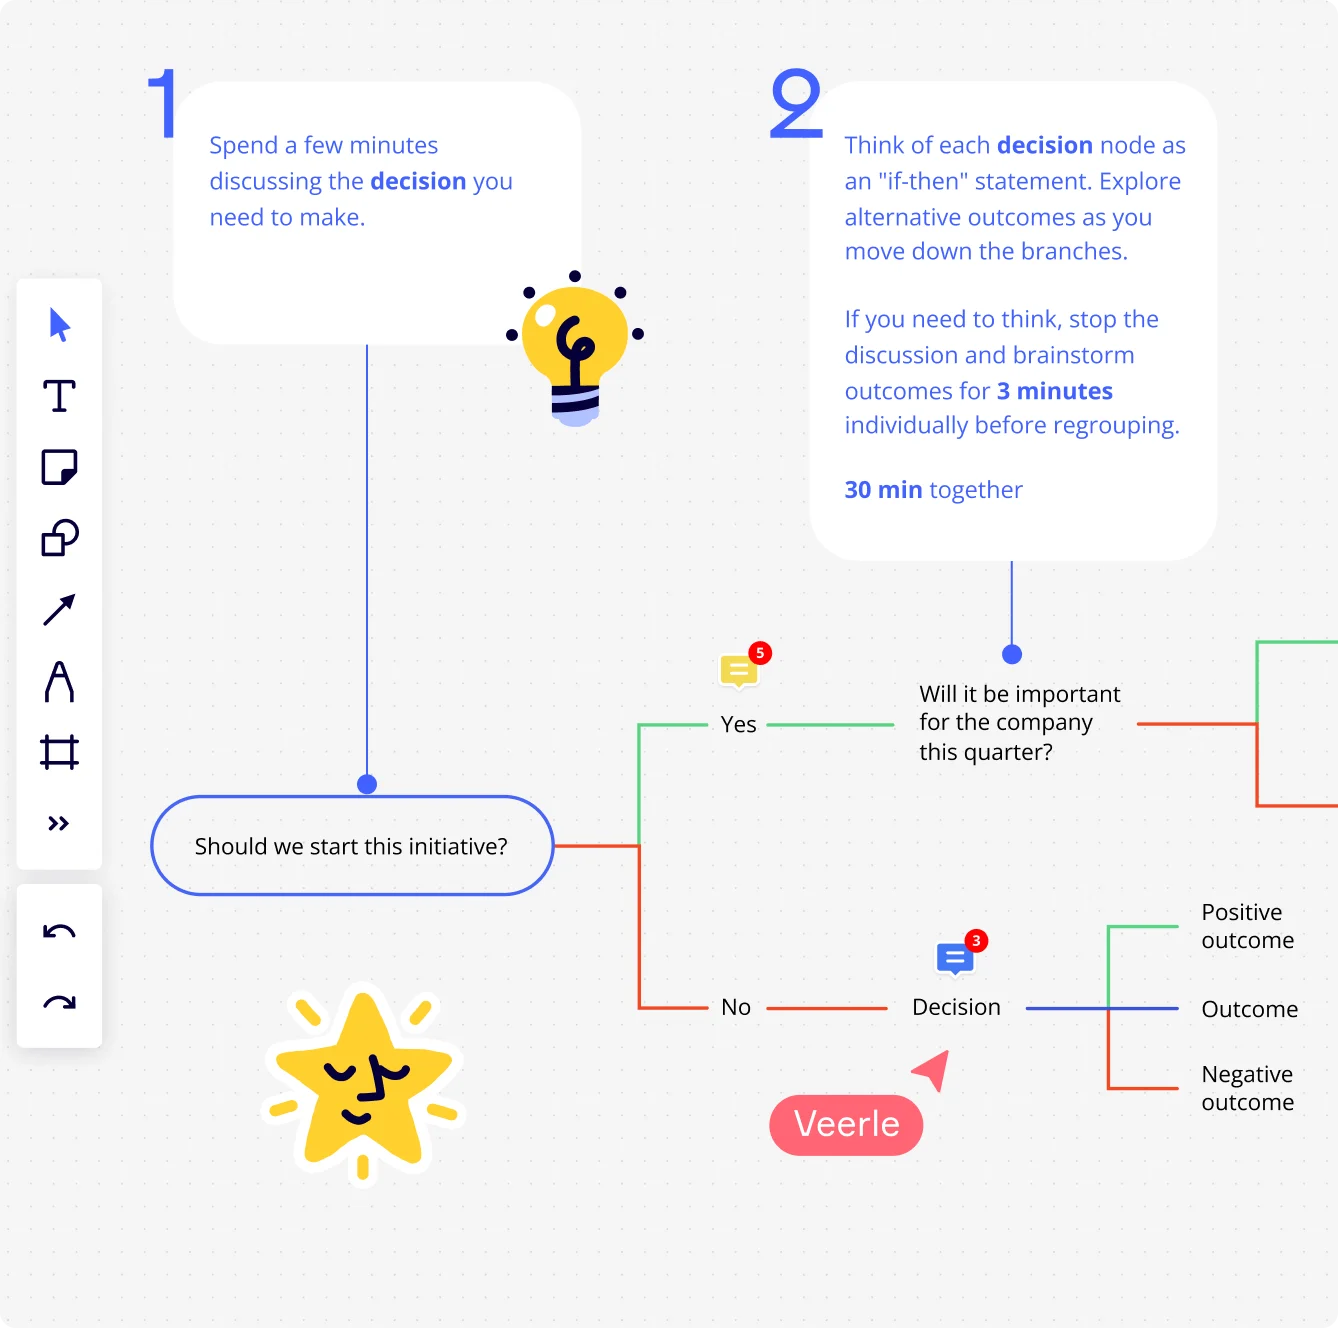
What is a tree diagram?
How to make a tree diagram with Miro

The world's most innovative companies are collaborating in Miro, everyday
“With Miro, we went from project brief to in-market launch in 10 months. That usually takes 3 years at PepsiCo.”
Caroline de Diego
Senior Manager, Global Design & Marketing Innovation at PepsiCo

“Bringing everyone together to plan in Miro means the most impactful initiatives will happen at the right time.”
Lucy Starling
Product Operations Lead at Asos

“The team onboarded in 10 minutes to use Miro for workshops. Getting our organization to adopt this product was a no-brainer.”
Konrad Grzegory
Agile Transformation Lead at CD PROJEKT RED

“Miro templates helped us go from scratch to a full-fledged plan where we mapped activities, ideas, and dependencies.”
Marc Zukerman
Senior Director of Project Management at Hearst

“Miro allows all our teams to align themselves with certain tools and models: they work independently and create products that really meet our customers' needs.”
Luke Pittar
Sustainability Innovation & Design Coach at The Warehouse Group

“To be truly innovative, everyone needs to have a voice, and everyone needs to be able to iterate on each other’s ideas. Miro has made that possible for us.”
Brian Chiccotelli
Learning Experience Designer at HP

Users love Miro for end-to-end innovation. We're the G2 leader in visual collaboration platforms and are rated in the top 50 enterprise tools. Miro helps large companies get meaningful work done.
Top 50 Products for Enterprise
G2 reviews

Tree diagram maker FAQs
What types of tree diagrams can I create with your AI-powered tool?
Miro's tree diagram maker AI supports a variety of tree diagrams, including organizational charts, decision trees, family trees, project hierarchies, and process flows. Use our AI features to generate comprehensive content for any hierarchical structure, then organize it visually using our professional templates.
How can I export or share my tree diagram?
In Miro, you can export and share your tree diagram in many ways. Export it as an image or PDF, or simply share your board link so others can access your work.
How does the AI help with tree diagram creation?
Create with AI helps you brainstorm and generate ideas that populate your tree diagrams, ensuring you don't miss critical elements. You can use existing board content as prompts for AI-generated insights, then manually organize these elements into clear hierarchical structures using our diagramming tools.
What are the pricing options for AI features?
Tree diagram creation is available on all Miro plans, including Free. Please check our pricing page for more details.