This Circular Economy Dashboard helps you strategize for cost efficient, zero-waste, and low- or no-emissions products. Creating circular economy products not only helps the environment, it gives your brand an innovative, attractive unique selling proposition.
Product designers have to collect and analyze numerous data points about their products, especially when analyzing the environmental footprint of the product. For designers who want to design for the circular economy, these data points are crucial to improving the environmental performance of their products.
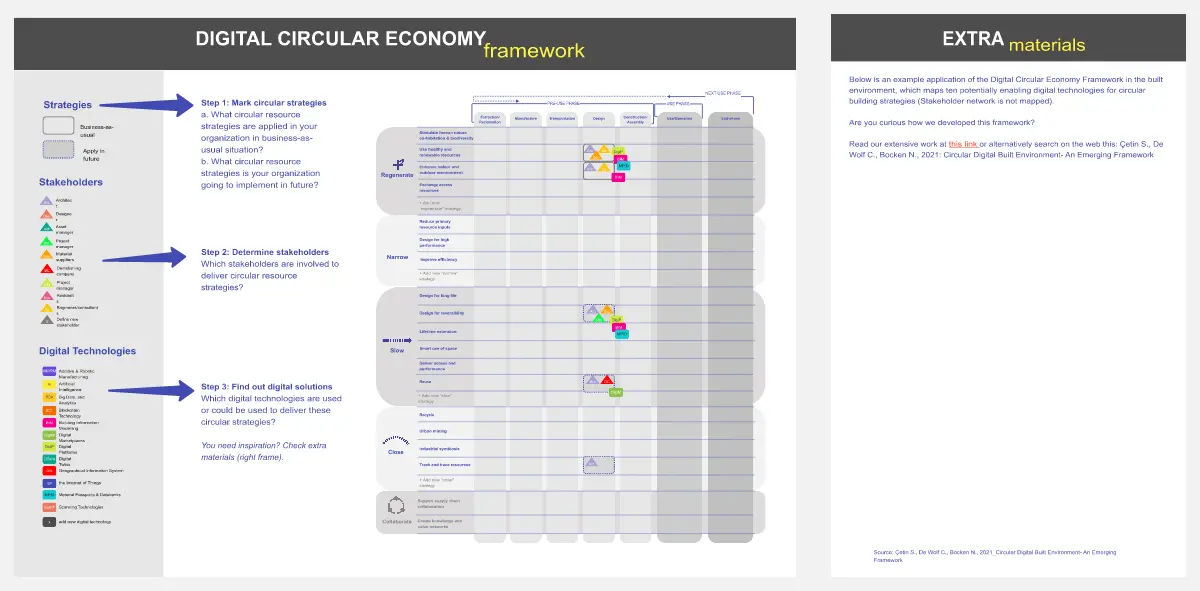
We’ve created a simple, effective flow chart for analyzing the material cost, waste, and C02 emissions of your product at the most significant stages of its life cycle. Within the flow chart, we provide circular economy strategies for improving the environmental impact of your product.
The dashboard walks you through the each step of the life-cycle of a product which fall within three main modules:
For each step in the product life cycle, you’ll estimate the cost, the weight of the materials, and the C02 equivalent for your product. This way, you can easily calculate how much the Design and Manufacturing Cycle and Consumption Cycle modules can be balanced with the waste mitigation opportunities listed in the Circular Economic Activities module.
Why is the Circular Economy Dashboard useful?
If you’re hoping to design products that adhere to circular economic principles, this dashboard helps you plan and understand your product’s environmental performance at a glance. This allows you to analyze your product’s environmental strengths and weaknesses with ease.
One of the biggest challenges for product designers and manufacturers is comparing the different life-cycle alternatives available. This dashboard is the solution to this dilemma, as it helps you quickly explore many possible circular design approaches in an organized way.
Once you’ve entered all of the data points necessary for the modules, you can start to find ways to improve the sum totals, whether your primary aim is to reduce cost, waste, or C02 emissions. It offers an intuitive and user-friendly way to assess, track and continuously improve your product’s environmental performance.
By collecting your data in the dashboard, you can transparently communicate the benefits and design challenges of your product to your stakeholders, too.
Finally, the dashboard’s template allows you to link to other files such as your LCA reports, Bill of Materials, and other Miro spaces where product design ideation can happen.
Try our dashboard and let us know what you think.