플로우차트 템플릿
플로우차트는 새 프로세스를 계획하거나 기존 프로세스를 재평가할 때 유용합니다. 플로우차트 기능을 사용하면 각 단계를 시각화할 수 있습니다. 이는 엔지니어만을 위한 것이 아니라, 플로우차트를 통해 모든 산업 분야의 프로젝트를 관리하는 데 도움이 될 수 있습니다.
순서도 템플릿
다음에 경우 적합합니다:
Flowcharts, Mapping, Diagrams
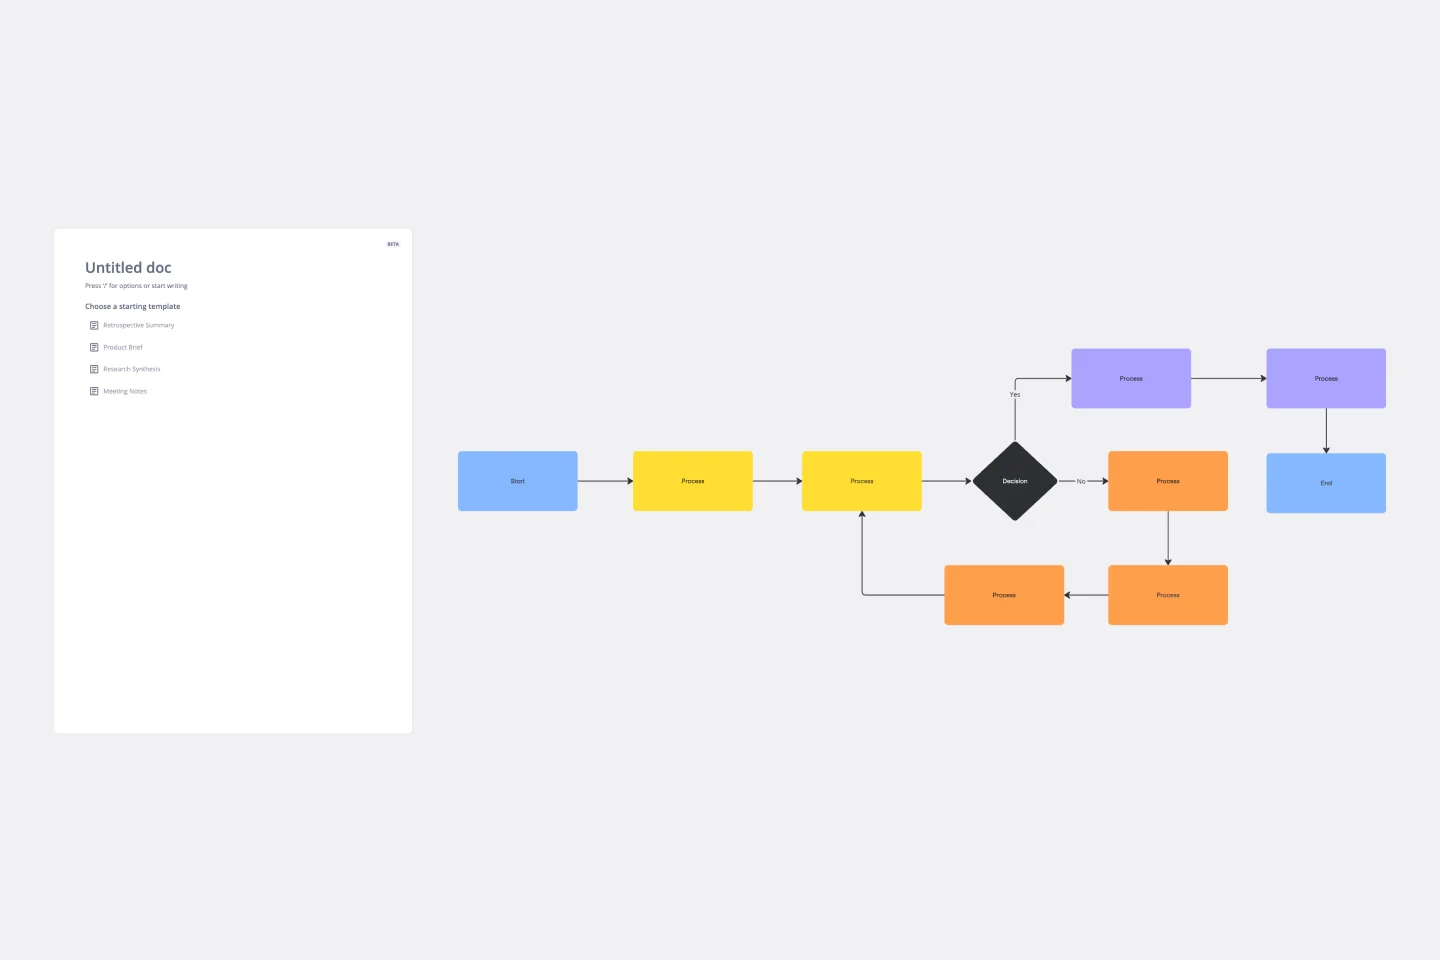
팀에 프로세스 또는 워크플로우를 설명하려고 하고 있나요? 아니면 그냥 혼자 골치 아파하고 있나요? 때때로 가장 좋은 방법은 문제를 눈으로 보는 것이며, 바로 그때가 순서도를 작성할 때입니다. 일반적인 도형 (일반적으로 타원형, 직사각형, 마름모꼴 및 화살표)을 사용하는 순서도는 프로세스 또는 워크플로우가 진행되는 방향과 단계 순서를 보여 줍니다. 이는 명확한 이해를 제공할 뿐만 아니라 잠재적인 결함과 병목 현상을 확인할 수 있으므로, 프로세스를 개선하고 향상시키며 더 나은 제품을 보다 효율적으로 만드는 데 도움이 됩니다.
교차 기능 순서도
다음에 경우 적합합니다:
Org Charts, Business Management
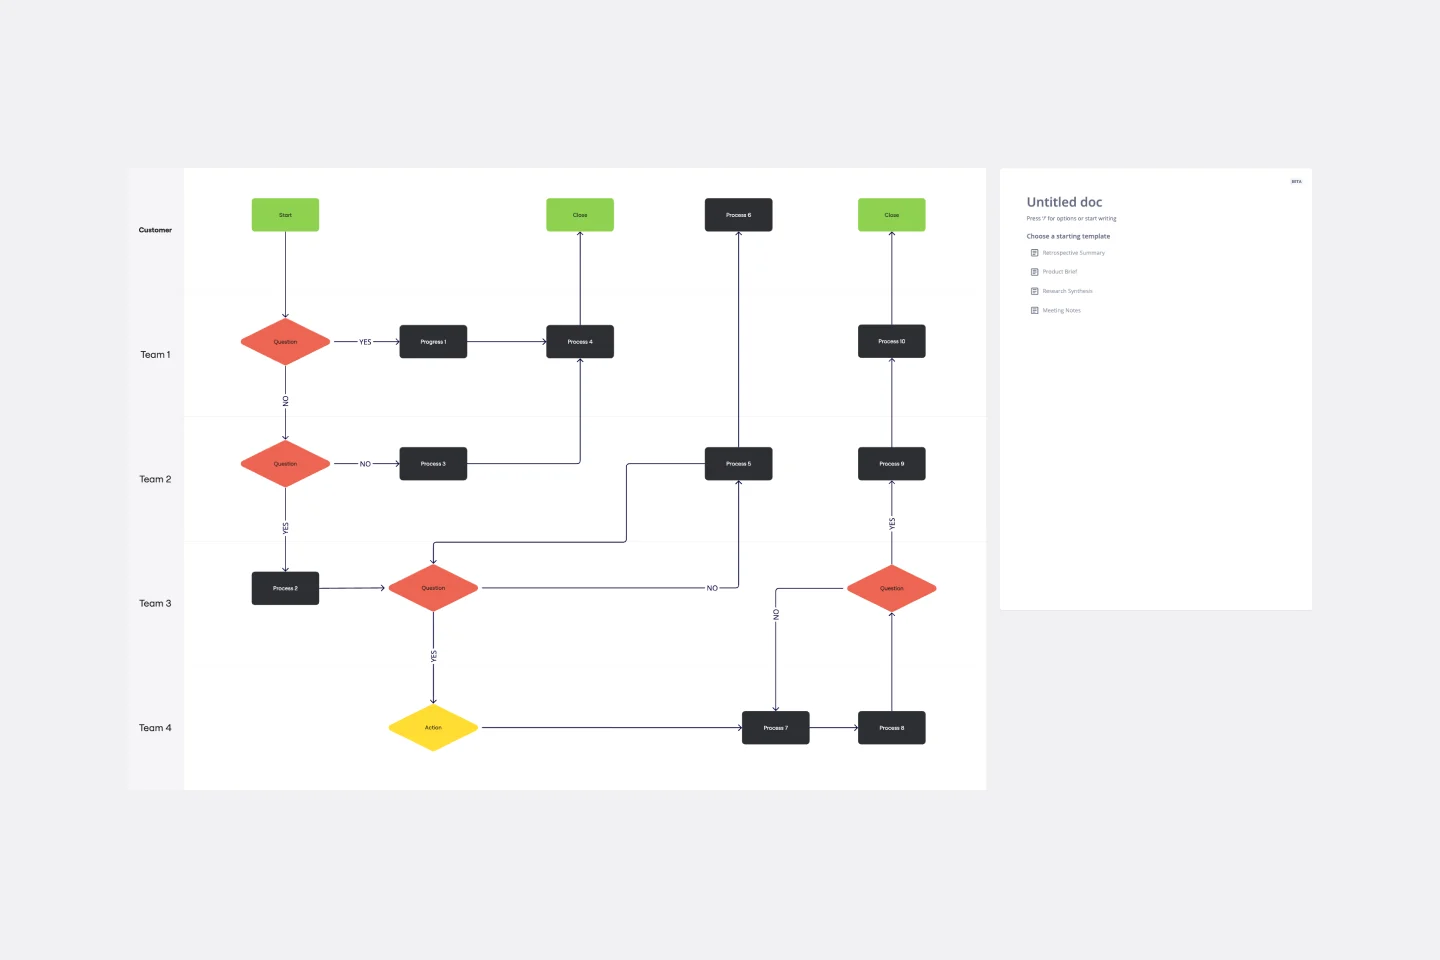
프로젝트의 모든 사람을 빠르게 살펴보고 그들이 기여하는 것을 정확히 볼 수 있습니다. 교차 기능 순서도를 통해 명확성과 투명성을 확보할 수 있습니다. 이는 "수영장 레인" 순서도라고도 부릅니다. 각 개인(각 고객, 클라이언트 또는 특정 직능 부서의 담당자)에게 하나의 분명한 라인이 배정되며 이는 프로젝트의 각 단계에서 그들의 역할을 시각화하는 데 도움이 됩니다. 이 템플릿을 사용하면 프로세스를 간소화하고, 비효율성을 낮추고 의미 있는 교차 기능 관계를 만들 수 있습니다.
Cross Functional (Swimlane) Chart
다음에 경우 적합합니다:
Flowcharts, Mapping, Diagrams
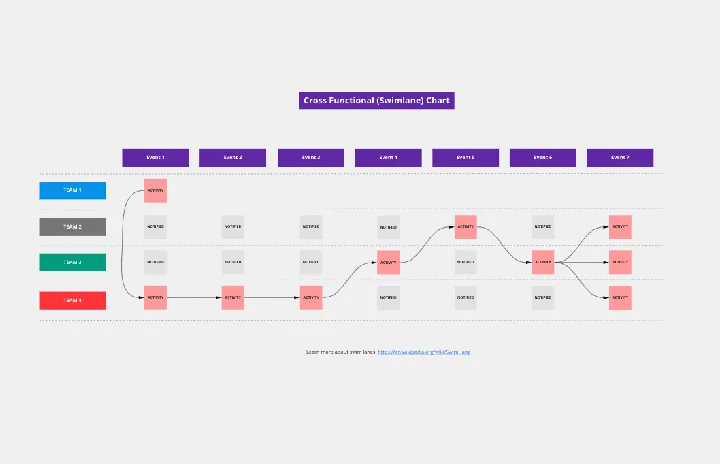
The Cross Functional (Swimlane) Chart template offers a visual tool for mapping out processes or workflows with multiple stakeholders or functional areas. It provides swimlanes for organizing tasks and responsibilities by department or role. This template enables teams to visualize process flows, identify handoffs, and improve coordination and collaboration across functions. By promoting transparency and accountability, the Cross Functional (Swimlane) Chart empowers organizations to streamline workflows and drive cross-functional alignment effectively.
Swim Lane Diagram with Data
다음에 경우 적합합니다:
Flowchart, Mapping, Diagrams
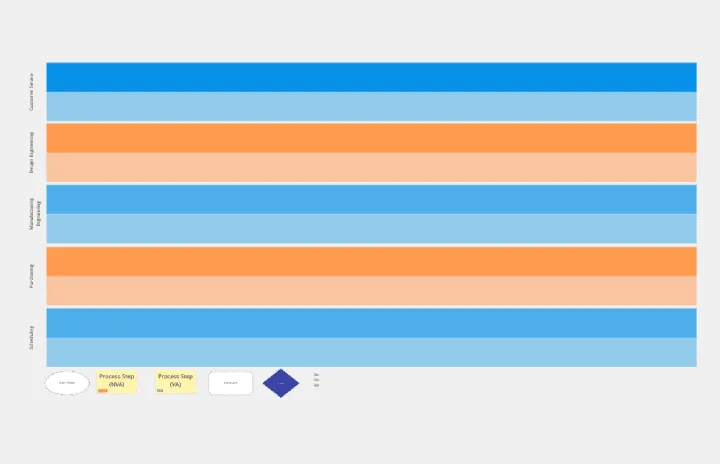
The Swim Lane Diagram with Data template is a visual tool for illustrating processes or workflows with swimlanes that contain additional data or information. It provides elements for documenting process steps, timelines, and performance metrics within each swimlane. This template enables teams to analyze process efficiency, identify bottlenecks, and make data-driven decisions for process improvement. By combining visual clarity with data insights, the Swim Lane Diagram with Data empowers organizations to optimize workflows and drive continuous improvement effectively.
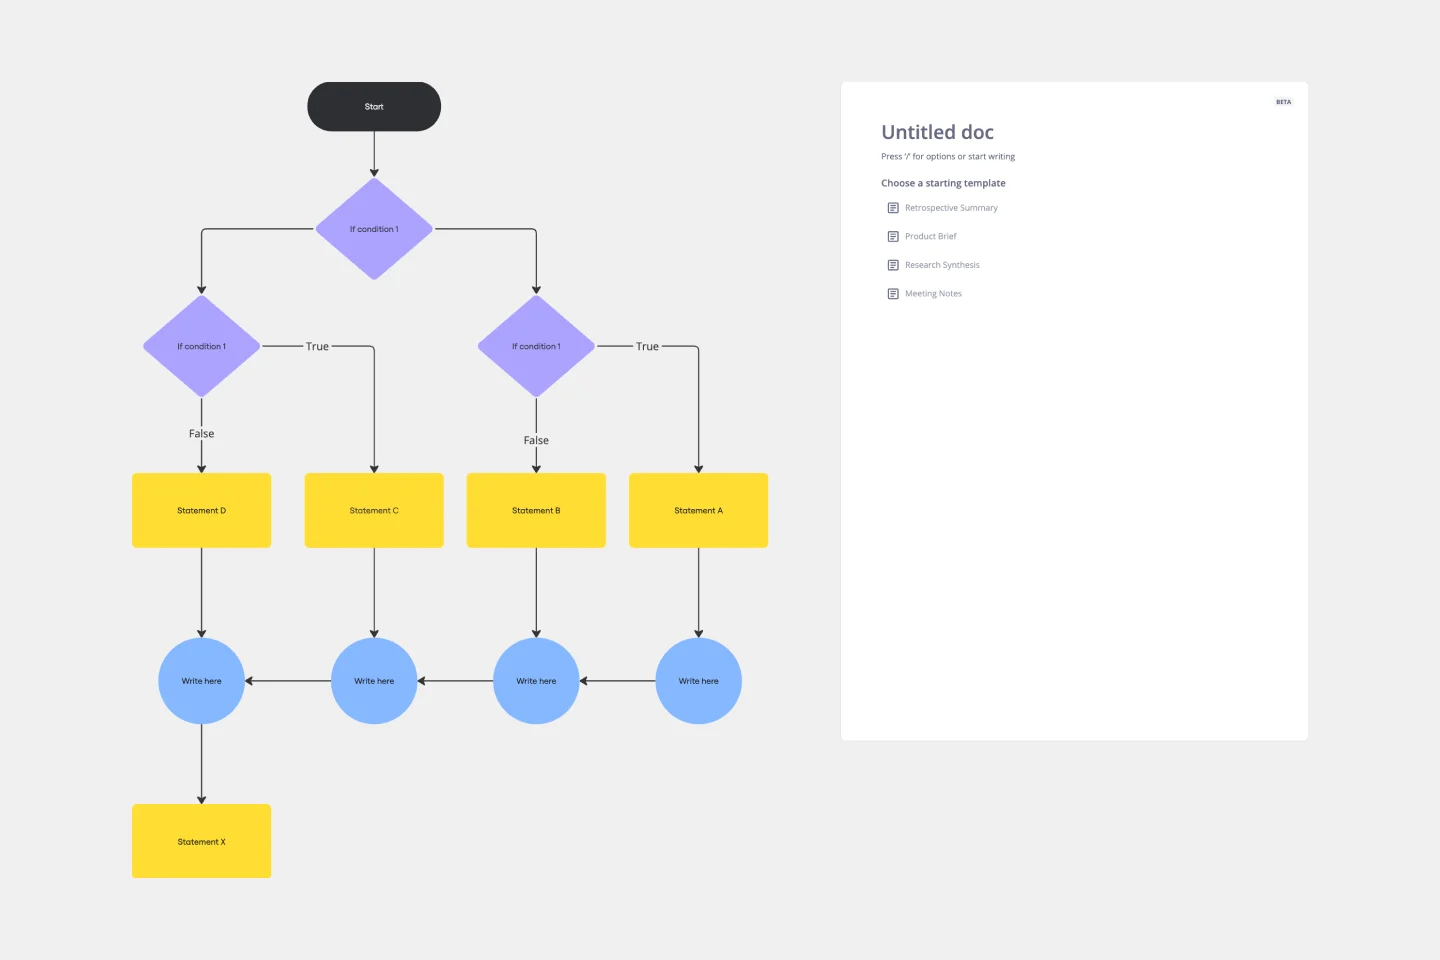
If then Flowchart Template
다음에 경우 적합합니다:
Flowcharts
The If-then Flowchart Template is a useful tool for decision-making. It visually maps out conditional steps and outcomes, allowing users to anticipate potential challenges and opportunities. This foresight is valuable for making informed decisions, especially for those with significant implications. Whether for business strategy, project management, or personal decision-making, the template helps navigate complex decision trees with confidence.
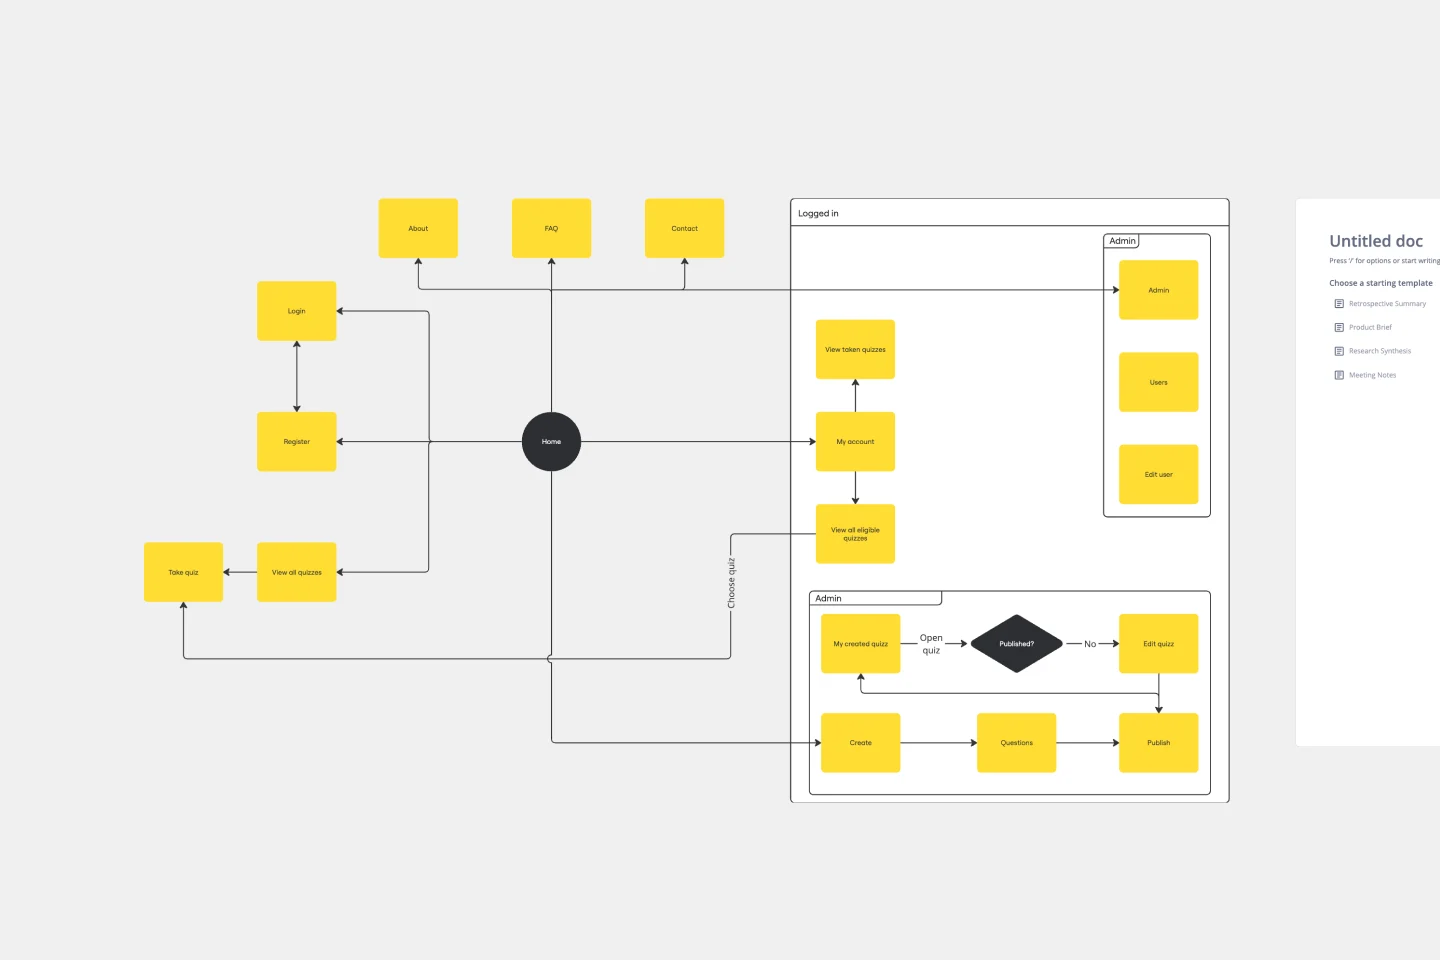
UI Flowchart Template
다음에 경우 적합합니다:
UI, UX, UX Design, Design, Product Design
Our UI Flowchart Template unlocks the potential of seamless design collaboration. Map user flows and product interactions, providing a structured canvas to articulate the intricate journey of users through your digital interface. One key benefit of this template is its ability to facilitate real-time collaboration, ensuring everyone is on the same page and fostering a shared understanding of design decisions. Elevate your design game, enhance collaboration, and bring clarity to your projects with our UI Flowchart Template.